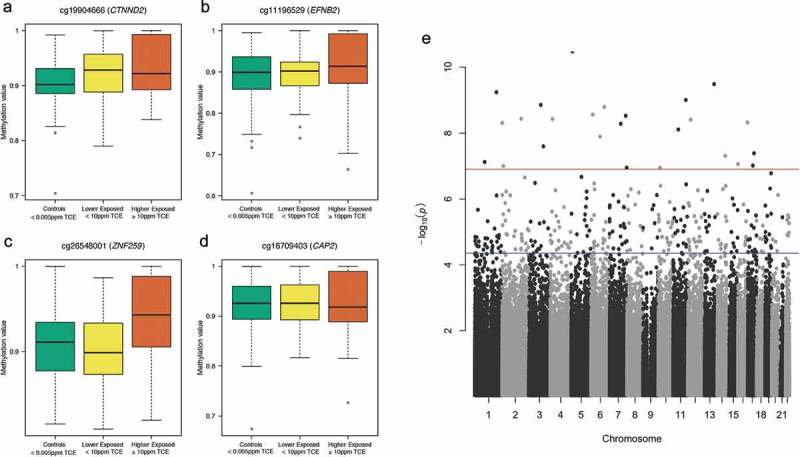
Figure 2.

Differentially variable CpG probes (DVPs) in genes CTNND2 (a), EFNB2 (b), ZNF259 (c), and CAP2 (d) following varying levels of exposure to TCE and Manhattan plot of DVP results (e). The three boxplots displayed for each DVP (A-D) juxtapose the distribution of methylation values (β-values) with the levels of TCE exposure. A wide box is an indicator of increased variability of methylation, and a compressed box is indicative of decreased variability of methylation. The Manhattan plot (e) shows the negative log10 p-value for each CpG probe when tested for differences in variability across the three comparison groups. The red horizontal line (–log10(p) about 7) denotes the threshold for genome-wide significance (Bonferroni corrected p-value < 0.05) and the blue horizontal line (–log10(p) around 4.5) denotes the threshold for DVPs that achieved a Benjamini-Hochberg corrected p-value < 0.05.
