. 2019 Oct 1;8:e41239. doi: 10.7554/eLife.41239

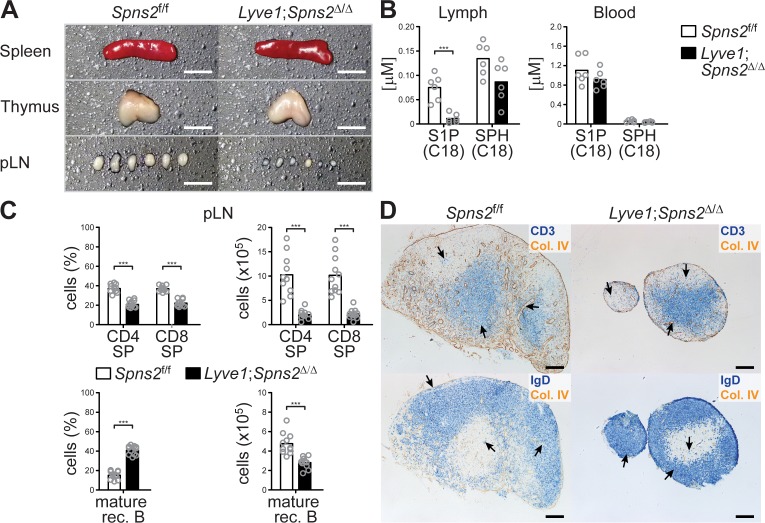
Figure 1. Lyve1CRE-mediated Spns2-deletion in endothelial cells causes hypotrophy in pLNs.

(A) Macroscopic view of spleen, thymus and pLNs of wildtype Spns2f/f (left) and Lyve1;Spns2Δ/Δ (right) mice. (B) Quantification of S1P and sphingosine (SPH) concentrations in lymph and blood. (C) FACS analysis of CD4+ and CD8+ SP T-cells (top) and mature rec. B-cells (bottom) of pLNs of Spns2f/f and Lyve1;Spns2Δ/Δ mice. (D) Light microscopy of pLNs of Spns2f/f (left) and Lyve1;Spns2Δ/Δ (right) mice for CD3+ T-cells (top, blue) and IgD+ mature rec. B-cells (bottom, blue) counterstained for collagen-IV+ (brown) tissue frameworks. Each circle (B, C) represents an individual mouse; bars indicate the mean. Scale bars, 0.2 cm (A) or 200 μm (D). ***p<0.0005 (two-tailed unpaired Student’s t-test (B, C)). Data are representative for six mice per group (A, B), for 2x inguinal, 2x brachial and 2x axial LNs of six mice per group (D) or are pooled from three independent experiments (C) with n = 3 or n = 4 mice per group.

Figure 1.

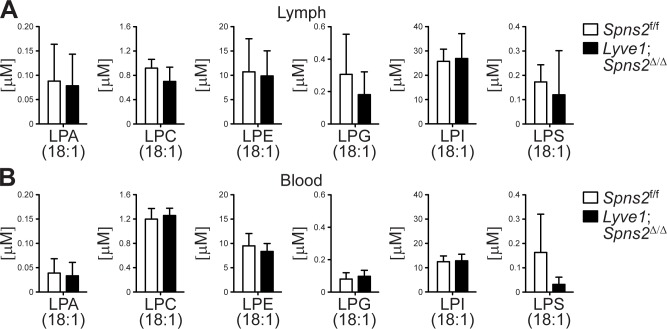
Figure 1—figure supplement 1. Lyve1CRE mediated Spns2-deficiency does not affect glycerol-based lysophospholipid levels, representatively shown for C18:1 species (other species (not shown) were also checked and found to be not different), in lymph and blood.

Figure 1—figure supplement 1.

(A) Quantification of lymph concentrations of lysophosphatidic acid (LPA), lysophosphatidylcholine (LPC), lysophosphatidyethanolamine (LPE), lysophosphatidyglycerol (LPG), lysophosphatidylinositol (LPI) and lysophosphatidylserine (LPS). (B) Blood concentrations of glycerol-based lysophospholipids (as monitored in (A)). Data are representative for six mice per group (A), (B); mean + s.e.m. in A, (B).
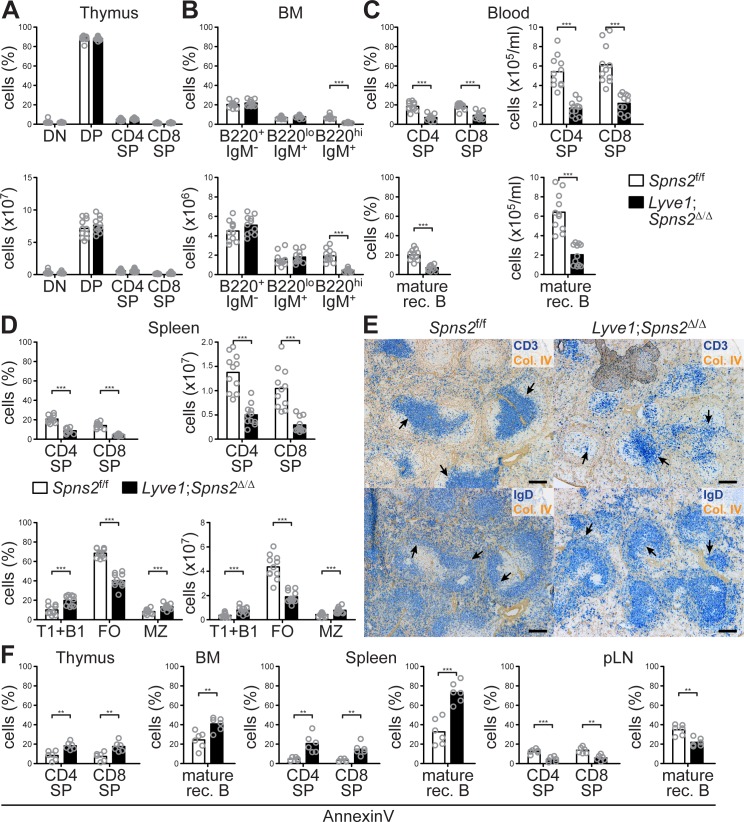
Figure 1—figure supplement 2. Recirculating lymphocyte populations are impaired throughout various lymphatic tissues in Lyve1;Spns2Δ/Δ mice.

Figure 1—figure supplement 2.

(A) FACS analysis of thymocytes and T-cells in the thymus of Spns2f/f and Lyve1;Spns2Δ/Δ mice. (B) FACS analysis of precursor B-cells (B220+/IgM-), immature B-cells (B220lo/IgM+) and mature rec. B-cells (B220hi/IgM+) in the BM of Spns2f/f and Lyve1;Spns2Δ/Δ mice. (C) FACS analysis of CD4+ and CD8+ SP T-cells (top) and mature rec. B-cells (bottom) in the blood of Spns2f/f and Lyve1;Spns2Δ/Δ mice. (D) FACS analysis of CD4+ and CD8+ SP T-cells (top) and B220+/CD21-/CD23- transitional (T1) and B1 B-cells (bottom), B220+/CD21+/CD23+ follicular (FO) B-cells (bottom) and B220+/CD21hi/CD23lomarginal zone (MZ) B-cells (bottom) in the spleen of Spns2f/f and Lyve1;Spns2Δ/Δ mice. (E) Light microscopy of the spleen of Spns2f/f (left) and Lyve1;Spns2Δ/Δ (right) mice for CD3+ T-cells (top, blue) and IgD+ mature rec. B-cells (bottom, blue) counterstained for collagen-IV+ (brown) tissue frameworks. (F) FACS analysis of apoptotic CD4+ and CD8+ SP T-cells (left) and mature rec. B-cells (right) by AnnexinV-staining in the thymus, BM, spleen and pLNs of Spns2f/f and Lyve1;Spns2Δ/Δ mice. Each circle (A–C, D, F) represents an individual mouse; bars indicate the mean. Scale bars, 200 μm (E). *p<0.05; **p<0.005; ***p<0.0005 (two-tailed unpaired Student’s t-test (A–C, D, F)). Data are pooled from three independent experiments (A–D, D, F) with n = 3 or n = 4 mice per group (A–C, D, F), or are representative for six mice per group (E).