

Abstract
It has yet to be quantified how passive leg movement (PLM)-induced hyperemia, an index of vascular function, is distributed beyond the common femoral artery (CFA), into the deep femoral (DFA) and the superficial femoral (SFA) arteries, which supply blood to the thigh and lower leg, respectively. Furthermore, the impact of cuffing the lower leg, a common practice, especially with drug infusions during PLM, on the hyperemic response is, also, unknown. Therefore, PLM was performed with and without cuff-induced blood flow (BF) occlusion to the lower leg in 10 healthy subjects, with BF assessed by Doppler ultrasound. In terms of BF distribution during PLM, of the 380±191ml of blood that passed through the CFA, 69±8% was directed to the DFA, while only 31±8% passed through the SFA. Cuff occlusion of the lower leg significantly attenuated the PLM-induced hyperemia through the SFA (~30%), which was reflected by a fall in BF through the CFA (~20%), but not through the DFA. Additionally, cuff occlusion significantly attenuated the PLM-induced peak change in BF (BFΔpeak) in the SFA (324±159 to 214±114 ml/min), which was, again, reflected in the CFA (1019±438 to 833±476 ml/min), but not in the DFA. Thus, the PLM-induced hyperemia predominantly passes through the DFA and this was unaltered by cuffing. However, as a small fraction of the PLM-induced hyperemia does pass through the SFA to the lower leg, cuffing the lower leg during PLM should be considered to emphasize thigh-specific hyperemia in the PLM assessment of vascular function.
Keywords: Hyperemia, cuff occlusion, vascular health assessment, microvascular function
INTRODUCTION
Vascular function can be defined as the capacity of the vascular system to adjust tone appropriately in response to a given stimulus (Gifford & Richardson, 2017). With both aging and disease, there is evidence of vascular dysfunction, typically linked to the endothelium and the attenuated bioavailability of the antiatherogenic, antithrombotic, and vasodilatory factor nitric oxide (NO) (Deanfield et al., 2007; Seals et al., 2011; Groot et al., 2013; Gifford & Richardson, 2017). As vascular endothelial dysfunction has been documented to be antecedent to cardiovascular disease, it is imperative to have an accurate and reliable tool to assess vascular function, both in the research and clinical setting (Heitzer et al., 2001; Gokce et al., 2003; Widlansky et al., 2003; Deanfield et al., 2007; Lind et al., 2011; Seals et al., 2011). The assessment of passive leg movement (PLM)-induced hyperemia and vasodilation has recently been recognized as a novel, noninvasive technique to evaluate vascular function. This technique has clinical promise as it is able to distinguish differences in vascular function across the spectrum of cardiovascular health and disease (Trinity et al., 2015; Witman et al., 2015; Iepsen et al., 2016; Gifford & Richardson, 2017).
Employing the PLM approach, as described by recent guidelines (Gifford & Richardson, 2017), the participant sits in a chair while their common femoral artery (CFA) is scanned with Doppler ultrasound and their leg is passively moved through a 90 degree range of motion at the knee at a rate of 1Hz. It is presumed that, due to the passive movement of the leg and the subsequent stretch of the thigh muscles, there is mechanical deformation of the blood vessels which initiates the local release of vasodilators, such as NO (Cheng et al., 2009; Jufri et al., 2015). As a result of this movement, within the first 30 seconds there is an initial rapid increase in blood flow (BF) and vascular conductance (VC) that gradually returns to near baseline values (Trinity et al., 2012; Gifford & Richardson, 2017). This movement induced hyperemic response, as measured by the area under the curve (AUC), is up to 80% nitric oxide mediated in healthy humans (Mortensen et al., 2012; Trinity et al., 2012). This rapid dilation of the microvasculature is accompanied by a simultaneous increase in heart rate, stroke volume, and cardiac output in order to support the increased perfusion of the dilated vasculature (Trinity et al., 2011). The initial vasodilation likely persists due to an increase in shear stress (Trinity et al., 2010; Groot et al., 2013).
Although PLM-induced hyperemia has been documented to be a reliable index of vascular function (Gifford & Richardson, 2017), how the increase in BF is distributed beyond the CFA, into the deep femoral artery (DFA), supplying blood to the thigh, and the superficial femoral artery (SFA), which feeds the lower leg, has yet to be quantified. Indeed, even though data exist profiling the BF distribution within the major vessels and compartments of the human leg (Wray et al., 2006; Chiesa et al., 2016), there has not been an assessment of how this BF distribution is affected by PLM. Interestingly, intra-arterial drug infusion studies, aiming to further quantify the role of particular vasodilators to the total PLM-induced hyperemic response, utilize an occlusion cuff placed just below the knee to localize the effects of the drug to the upper leg (Trinity et al., 2012; Trinity et al., 2015; Broxterman et al., 2017). However, the impact of such occlusion on the PLM-induced hyperemic response remains unknown. Thus, there is a knowledge gap in terms of both BF distribution and the effect of cuff occlusion on the PLM-induced hyperemic response.
Therefore, the purpose of this study was twofold. First, we aimed to quantify the PLM-induced hyperemia, beyond the CFA, into the DFA and SFA. Specifically, utilizing Doppler ultrasound, we determined the distribution of the hyperemic response to PLM in the CFA, DFA, and SFA. We hypothesized that the majority of the PLM-induced hyperemia evident in the CFA is directed to the DFA, with little increase in BF in the SFA. Second, utilizing the same methodology, we sought to determine the impact of lower leg BF occlusion on the distribution of the hyperemic response in the CFA, DFA, and SFA. We hypothesized that cuff occlusion would significantly attenuate any PLM-induced hyperemic response evident in the SFA, and consequently of the CFA, but would not impact BF in the DFA.
METHODS
Ethical Approval
The experimental protocol was approved by the University of Utah and Salt Lake City Veteran’s Affairs Medical Center (VAMC) Institutional Review Board (IRB_00030732) and was in compliance with clause 35 of the Declaration of Helsinki, except for registration in a database. All subjects gave written informed consent.
Subjects
Ten healthy subjects (5 females/5 males) volunteered to participate in this research study. Subjects were free from overt cardiovascular and metabolic disease. All data collection took place at the Utah Vascular Research Laboratory (UVRL) located in the Salt Lake City VAMC Geriatric Research, Education, and Clinical Center.
PLM Experimental Protocol
At the time of testing, subjects had refrained from both food and caffeine for at least 4 hours and avoided vigorous exercise for the previous 24 hours, as per previous recommendations for the assessment of vascular function (Gifford & Richardson, 2017). Upon arrival to the laboratory, body weight and height were recorded. Subsequently, subjects rested in an upright-seated position with legs elevated at ~180 degrees on a table for 20 minutes in order to obtain a steady hemodynamic state. The PLM experimental protocol was conducted in this posture and consisted of passive knee flexion-extension of the right leg through a ~90 degree range of motion at 1 Hz for 60 s. Hemodynamic measurements were recorded during baseline for 60 s with the experimental leg supported at a 180 degree knee joint angle, as well as for 60 s following the onset of passive knee flexion-extension. Subjects were encouraged to relax, and the contralateral (left) leg was supported at a 180 degree knee joint angle and remained motionless during the protocol. In order to minimize the chance of an anticipatory response, subjects were informed that the movement would take place in approximately 1 min, but were not told the exact timing of when the movement would take place (Venturelli et al., 2012). A member of the research team moved the leg and verified the absence of muscle contraction. In order to occlude BF to the lower leg, the cuffing portion of the protocol consisted of placing an occlusion cuff (Hokanson, Vellevue, WA) just distal to the knee which was inflated (≥270 mmHg) for at least two minutes prior to baseline, or until any hemodynamic changes from the cuffing (mean arterial pressure (MAP), heart rate (HR), and CFA BF) had subsided, and then the cuff remained inflated until the cessation of PLM. The PLM protocol was performed on two separate days, typically within a month, at approximately the same time of day, in a temperature-controlled environment, with and without cuff-induced BF occlusion to the lower leg.
Measurements
Peripheral hemodynamics.
Simultaneous measurements of CFA and SFA blood velocity and diameter were obtained in the passively moved leg distal to the inguinal ligament using two ultrasound systems, each equipped with a linear array transducer probe (9L, Logiq e9, General Electric Medical Systems, Milwaukee, WI). CFA measurements were taken at least 2 cm above, and SFA measurements taken at least 2 cm below, the bifurcation of the CFA into the SFA and DFA. Pulse wave frequency was determined for each probe based on optimal spectra signal and minimal interference between probe signals. Utilizing real-time Duplex visualization of the ultrasound image (with the artery viewed longitudinally) and the pulse wave spectra, a sustained insonation angle of 60 degrees was ensured, and the sample volume was centered within the vessel and maximized according to vessel size. In parallel with previous research, DFA BF was calculated as CFA BF minus SFA BF (Wray et al., 2005).
Central hemodynamics.
HR and MAP were measured with a Finometer (Finapres Medical Systems, Amsterdam, The Netherlands), with the latter calibrated to each subjects’ MAP, measured by cuff inflation and deflation. This device calculates stroke volume (SV) from beat-by-beat pressure waveforms assessed by photoplethysmography using the Modelflow method (Beatscope, Finapres Medical Systems), which, in combination with HR, has been documented to accurately estimate cardiac output (CO) during various experimental protocols (Sugawara et al., 2003; van Lieshout et al., 2003; Azabji Kenfack et al., 2004; de Vaal et al., 2005; de Wilde et al., 2009).
Thigh Volume.
Thigh volume was calculated based on circumferences of the thigh (distal, middle, and proximal), length from the greater trochanter to the lateral femoral epicondyle, and thigh skinfold measurement using the following formula (Jones & Pearson, 1969; Radegran et al., 1999):
The circumferences and length were measured to the nearest 1 mm using a standard flexible measuring tape. Skinfold thickness was determined as the average of three measurements and was measured using skinfold calipers (Beta Technology Incorporated, Cambridge, MD) at the midpoint of the anterior portion of the thigh.
Data Acquisition and Analysis
HR, SV, CO, and MAP were acquired at 200 Hz via a data acquisition system (AcqKnowledge, Biopac Systems, Goleta,CA). For each artery, diameter (D) during diastole was determined at a perpendicular angle along the central axis of the scanned area. BF was calculated using diameter and intensity-weighted mean blood velocity (Vmean)
VC was then calculated as
Baseline values for all variables were determined as the average over the 60 s period before the onset of the passive movement. For each passive movement, all variables were analyzed second-by-second and smoothed using a 3-s rolling average, in order to smooth large fluctuations in the data that result from asynchronous superimposition of the leg movement on top of the heart rate driven pulse-wave (Gifford & Richardson, 2017). BFΔpeak and VCΔpeak were calculated as the peak minus the baseline. BFAUC and VCAUC were calculated, after normalization for baseline (i.e. the increase in BF above baseline), as the summed response over 60 s.
Statistical Analyses
Baseline peripheral and central hemodynamics between control and cuffed conditions were compared using Student’s paired t-tests. CFA, DFA, and SFA BF responses to uncuffed PLM were compared using two-way (time × artery) ANOVAs with repeated measures. Differences in CFA, DFA, and SFA BFΔpeak and BFAUC were compared within the control condition using one-way ANOVA. The effects of sex and cuffing on BFΔpeak and BFAUC in the CFA, DFA, and SFA were compared using two-way (sex × condition) ANOVAs with repeated measures. The percentage of blood passing through the CFA to the DFA and SFA were compared between males and females using Student’s paired t-tests. MAP, BF, and VC responses to PLM were compared within the control and cuffed conditions using two-way (time × condition) ANOVAs with repeated measures. Tukey’s post hoc analyses were used when a significant main effect was detected. Statistical significance was set at p < 0.05. Values are presented as mean ± SD throughout. SigmaPlot 11 was used for all statistical analyses and development of figures.
RESULTS
Subject Characteristics
Overall, the subjects were 28 ± 2 yrs of age, 175 ± 12 cm tall, weighed 73 ± 12 kg, and had a thigh volume of 64 ± 16 dL. There was no difference in age between males and females (p = 0.09), but the females were significantly shorter (males: 183 ± 8; females: 167 ± 8 cm; p = 0.01), lighter (males: 81 ± 10; females: 64 ± 6 kg; p = 0.01), and had significantly smaller thigh volumes (males: 78 ± 10; females: 53 ± 11 dL; p = 0.01).
Baseline Peripheral and Central Hemodynamics With and Without Cuff Occlusion
Baseline peripheral and central hemodynamics prior to the passive movement in both the control and cuffed conditions are presented in Table 1. There were no significant differences between control and cuffed conditions in terms of baseline MAP, HR, SV, and CO. Cuff occlusion significantly attenuated baseline BF only in the SFA, but not in the CFA or DFA. Cuff occlusion significantly attenuated baseline VC in the SFA, which was reflected in the CFA, but not in the DFA.
Table 1.
Baseline hemodynamics before the commencement of the passive leg movement (PLM) protocol with and without cuffing of the lower leg.
| Control | Cuff | p value | |
|---|---|---|---|
| MAP (mmHg) | 89 ± 9 | 91 ± 9 | 0.45 |
| HR (beats/min) | 57 ± 9 | 60 ± 9 | 0.28 |
| SV (ml/beat) | 94 ± 18 | 90 ± 27 | 0.52 |
| CO (l/min) | 5.3 ± 0.9 | 5.2 ± 1.1 | 0.93 |
| CFA | |||
| BF (ml/min) | 354 ± 67 | 316 ± 88 | 0.09 |
| VC (ml/min/mmHg) | 4.0 ± 0.7 | 3.5 ± 0.8 | 0.04 |
| DFA | |||
| BF (ml/min) | 233 ± 70 | 234 ± 102 | 0.97 |
| VC (ml/min/mmHg) | 2.6 ± 0.8 | 2.6 ± 1.0 | 0.74 |
| SFA | |||
| BF (ml/min) | 121 ± 42 | 82 ± 31 | 0.04 |
| VC (ml/min/mmHg) | 1.4 ± 0.5 | 0.9 ± 0.4 | 0.04 |
MAP, mean arterial pressure; HR, heart rate; SV, stroke volume; CO, cardiac output; CFA, common femoral artery; BF, blood flow; VC, vascular conductance; DFA, deep femoral artery; SFA, superficial femoral artery. BF and VC of DFA was calculated as CFA – SFA. Values are mean ± SD. n = 10.
Central Hemodynamic Responses to PLM
CO, HR, SV, and MAP changed significantly from baseline during PLM in the control and cuffed conditions (all variables, p < 0.001), but there were no significant differences in these responses between conditions (CO, p = 0.70; HR, p = 0.99; SV, p = 0.78; and MAP, p = 0.47). However, there was a tendency for an increase in MAP throughout the protocol when the cuff was inflated (time x condition interaction, p = 0.02, Figure 3).
Figure 3. Mean arterial pressure (MAP) during passive leg movement (PLM) with and without cuffing of the lower leg.

Values are mean ± SD. n = 10.
Distribution of PLM-Induced Hyperemia
The distribution of the PLM-induced hyperemia amongst the CFA, DFA, and SFA is presented in Figure 1. At the onset of passive movement, BF increased immediately in all three arteries, with the PLM-induced BFΔpeak significantly different among the three vessels: highest in the CFA (1019 ± 438 ml/min) and then progressively lower in the DFA (743 ± 301 ml/min) and SFA (324 ± 159 ml/min) (p < 0.001). BF then gradually returned to near baseline values in all three vessels. In terms of BF distribution, as assessed by BF AUC (Figure 1 inlay), it was determined that of the 380 ± 191 ml of the BF that passed through the CFA, 266 ± 142 ml (69 ± 8% of the CFA BF) was directed to the DFA, while only 114 ± 58 ml (31 ± 8% of the CFA BF) passed through the SFA, with the vessels, again, being significantly different from each other (p < 0.001). Although this study was not designed, specifically, to examine sex differences, it is interesting to note that the percentage of BF passing through the CFA to both the DFA and SFA was not significantly different between males and females (both arteries, p = 0.40). However, the males did exhibit significantly greater BF AUCs than the females in the CFA (males: 520 ± 155 ml vs. females: 240 ± 95 ml; p = 0.02), DFA (males: 372 ± 111 ml vs. females: 160 ± 71 ml; p = 0.03), and SFA (males: 148 ± 62 ml vs. females: 80 ± 30 ml; p = 0.01). All differences between males and females in regards to BFAUC and BFΔpeak in the CFA, DFA, and SFA, were ameliorated by normalizing the BF responses for thigh volume, which was significantly greater in the, generally larger, males than the females. Specifically, there were no longer differences between males and females in BFAUC of the CFA (males: 61 ± 18 ml/dL/10 vs. females: 44 ± 9 ml/dL/10; p = 0.11), DFA (males: 43 ± 11 ml/dL/10 vs. females: 29 ± 9 ml/dL/10; p = 0.08), and SFA (males: 18 ± 9 ml/dL/10 vs. females: 15 ± 2 ml/dL/10; p = 0.47), and BFΔpeak of the CFA (males: 177 ± 48 ml/dL/10 vs. females: 125 ± 43 ml/dL/10; p = 0.13), DFA (males: 121 ± 30 ml/dL/10 vs. females: 96 ± 38 ml/dL/10; p = 0.32), and SFA (males: 61 ± 22 ml/dL/10 vs. females: 38 ± 7 ml/dL/10; p = 0.06).
Figure 1. Leg blood flow (BF) in response to passive leg movement (PLM), in the common (CFA), deep (DFA), and superficial (SFA) femoral arteries.

Inset: area under the curve (AUC), calculated as the summed response after normalization for baseline. Values are mean ± SD, with individual data overlaid on the bar graphs. n = 10. * BF in the three vessels was significantly different from each other over time (p < 0.001). BFAUC of the three vessels was significantly different from each other (p < 0.001).
Impact of Lower Leg Cuff Occlusion on the Distribution of PLM-Induced Hyperemia
The response and distribution of PLM-induced hyperemia in the CFA, DFA, and SFA with and without cuff-induced lower leg BF occlusion is presented in Figure 2. Cuff occlusion had a significant main effect on the PLM-induced hyperemia in the SFA over time, which was reflected by a fall in BF in the CFA, but not in the DFA (p = 0.11). Additionally, cuff-occlusion significantly attenuated the PLM-induced BFΔpeak in the SFA (324 ± 159 to 214 ± 114 (cuffed) ml/min), which was, again, reflected in the CFA (1019 ± 438 to 833 ± 476 (cuffed) ml/min), but not in the DFA (p = 0.30). Cuff occlusion significantly attenuated the PLM-induced BFAUC only in the CFA (380 ± 191 to 304 ± 259 ml), but not in the DFA (p = 0.30) or SFA (p = 0.14). However, the proportion of blood passing from the CFA through the DFA and SFA with cuff occlusion was essentially unchanged when compared to the control condition (DFA: control (69 ± 8%) vs. cuffed (73 ± 18%) (p = 0.63), and SFA: control (31 ± 8%) vs. cuffed (27 ± 18%) (p = 0.63). Regarding sex, there were no sex (male vs. female) by condition (control vs. cuff) interactions for BFΔpeak in the CFA (p = 0.87), DFA (p = 0.74), and SFA (p = 0.29), and BFAUC in the CFA (p = 0.43), DFA (p = 0.75), and SFA (p = 0.52). Although not 7 focus of this study or, typically, the PLM assessment, to date, it is interesting to note the time to peak BF did not differ between vessels (CFA: 8.2 ± 2.2 sec, DFA: 7.9 ± 2.1 sec, and SFA: 9.2 ± 1.5 sec, p = 0.32) and this temporal response was not affected by cuff occlusion (CFA: 8.8 ± 1.5 sec, DFA: 8.8 ± 1.7 sec, and SFA: 11.0 ± 3.7 sec, p = 0.10).
Figure 2. The blood flow (BF) response to passive leg movement (PLM) performed with and without cuffing of the lower leg, measured in the common, deep, and superficial femoral arteries.
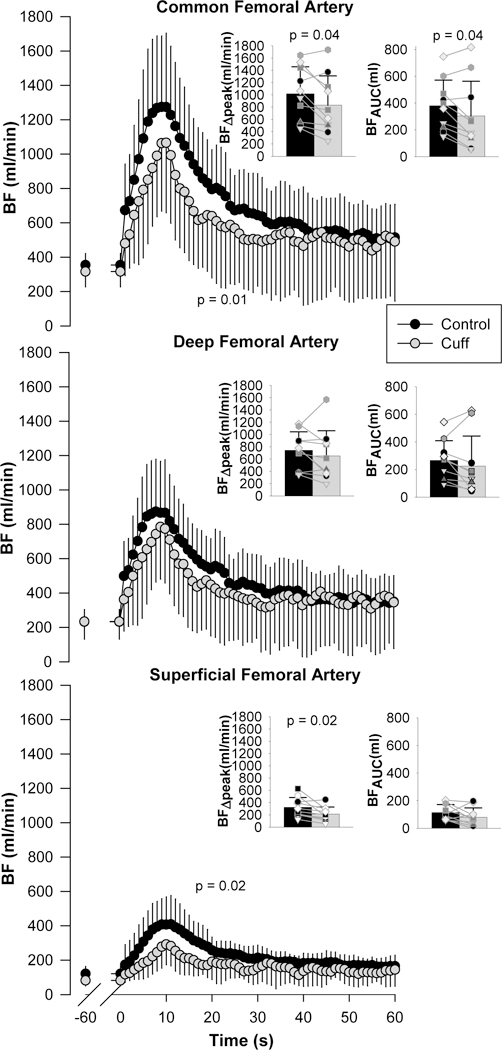
Insets: peak change in BF (BFΔpeak) and BF area under the curve (BFAUC), calculated as the summed response after normalization for baseline. Values are mean ± SD, with individual data overlaid on the bar graphs. n = 10. BF in each condition was significantly different across time (p < 0.001).
Impact of Lower Leg Cuff Occlusion on PLM-Induced Vasodilation
There were no significant differences in MAP during PLM with and without cuff occlusion; although, there was a tendency for an increase in MAP throughout the protocol when the cuff was inflated (time x condition interaction, p = 0.02, Figure 3). However, there were significant differences in VC (PLM-induced vasodilation) with and without cuff occlusion apparent in the CFA, DFA, and SFA (Figure 4.) Specifically, cuff occlusion had a significant main effect on the PLM-induced vasodilation in the microvasculature distal to the SFA and DFA over time, which was reflected by a fall in VC in the CFA. Additionally, cuff occlusion significantly attenuated the PLM-induced VCΔpeak in the SFA (3.8 ± 1.9 to 2.6 ± 1.4 (cuffed) ml/min/mmHg), which was, again, reflected in the CFA (11.9 ± 4.8 to 9.3 ± 5.2 (cuffed) ml/min/mmHg), but not in the DFA (p = 0.07). Somewhat unexpectedly, cuff occlusion did not significantly attenuate the PLM-induced VCAUC in the SFA (1.3 ± 0.6 to 0.9 ± 0.7 (cuffed) ml/mmHg, p = 0.11), but did significantly attenuate the PLM-induced VCAUC in the DFA (2.9 ± 1.4 to 2.1 ± 1.7 (cuffed) ml/mmHg), which was reflected in the CFA (4.2 ± 1.9 to 3.0 ± 2.3 (cuffed) ml/mmHg). Regarding sex, there were no sex (male vs. female) by condition (control vs. cuff) interactions for VCΔpeak in the CFA (p = 0.96), DFA (p = 0.84), and SFA (p = 0.54), and VCAUC in the CFA (p = 0.49), DFA (p = 0.83), and SFA (p = 0.26). Of note, in terms of vasodilation in the conduit vessels themselves, there was no evidence of vasodilation in either of the measured conduit vessels (CFA and SFA), during either the control or cuffed conditions (both vessels, p = 0.9).
Figure. 4. Vasodilatory response, represented as vascular conductance (VC), in the common, deep, and superficial femoral arteries to passive leg movement (PLM) performed with and without cuffing of the lower leg.

Insets: peak change in vascular conductance (VCΔpeak) and vascular conductance area under the curve (VCAUC), calculated as the summed response after normalization for baseline. Values are mean ± SD, with individual data overlaid on the bar graphs. n = 10. VC in each condition was significantly different across time (p < 0.001).
DISCUSSION
The purpose of this study was twofold: First, to determine how PLM-induced hyperemia is distributed beyond the CFA, into the DFA and SFA, and second, to determine the impact of cuff occlusion of the lower leg on the distribution of this hyperemic response. In terms of BF distribution, in response to uncuffed PLM, of the total BF that passed through the CFA, ~70% was directed to the DFA while only ~30% passed through the SFA. Cuff occlusion of the lower leg significantly attenuated the PLM-induced BFΔpeak and main effect over time in the SFA, which was reflected by a fall in BF in the CFA, but not in the DFA. Thus, the PLM-induced hyperemia predominantly passes through the DFA. Although cuff occlusion did attenuate the BF response in the CFA, it is important to note that the proportion of blood passing through the DFA and SFA was essentially unchanged. However, as a small fraction of the PLM-induced hyperemia does pass through the SFA to the lower leg, cuffing the lower leg during PLM should be considered to emphasize the thigh-specific hyperemia in the PLM assessment of vascular function.
Distribution of PLM-Induced Hyperemia
With regards to the PLM-induced CFA hyperemia, as hypothesized, the majority of the movement-induced BF was directed towards the DFA (69 ± 8%). However, the SFA did exhibit a significant increase in BF, receiving 31 ± 8% of the BF from the CFA (Figure 1). Therefore, it is likely that the hyperemic response seen in the CFA is primarily driven by vasodilation of microvasculature downstream of the DFA. Specifically, due to the passive movement of the leg, which alters the knee joint angle, and the subsequent stretch of the thigh muscles, mechanical deformation occurs in the blood vessels of the upper leg. As a consequence, vasodilators are released from the microvasculature, predominantly downstream from the DFA, which initiates vasodilation (Clifford et al., 2006; Cheng et al., 2009; Jufri et al., 2015). Vasodilation is likely sustained by microvascular flow-mediated dilation, with MAP maintained by increases in heart rate, stroke volume, and cardiac output (Trinity et al., 2010; Trinity et al., 2011; Groot et al., 2013). This vasodilation and subsequent hyperemic response is evident in the conduit arteries supplying blood to the upper leg, both the DFA and CFA, with the latter being the sight of BF measurement for the PLM technique of assessing vascular function.
Interestingly, this study reveals that PLM also induces hyperemia in the SFA, although the exact mechanisms are less intuitive than for the DFA. Even though the SFA primarily supplies blood to the lower leg, the SFA has several perforating arteries in the upper leg that perfuse the superficial muscles and the skin of the thigh (Yokochi & Rohen, 1978; Bajzer, 2004). Thus, the surrounding microvasculature likely also becomes distorted as a result of the movement, triggering a vasodilatory response, which manifests as an increase in BF in the upstream SFA. Another consideration is the branching of the SFA at the knee. As the SFA reaches the popliteal fossa, it becomes the popliteal artery and also branches into the genicular arteries (Yokochi & Rohen, 1978; Bajzer, 2004). Due to the bending of the leg, these vessels are being compressed, also potentially initiating a vasodilatory response in the downstream microvasculature. Again, relative to the DFA, the PLM-induced hyperemia in the SFA was comparatively small in this group of young, healthy subjects, accounting for only ~30% of the BF measured in the CFA.
Impact of Lower Leg Cuff Occlusion on Baseline Blood Flow
Previous research has examined the effect of lower leg cuff occlusion on BF distribution among the major arteries of the leg. Specifically, Chiesa et al (Chiesa et al., 2016) occluded BF to the lower leg via a cuff at the level of the knee to determine BF distribution to the upper and lower leg with whole body heating. As the DFA hyperemic response to heating was not different with and without cuff-induced BF occlusion below the knee, it was concluded that BF to the lower leg was supplied solely by the SFA, whereas the upper leg was exclusively perfused by the DFA (Chiesa et al., 2016). These findings are consistent with the results of the current study, in which cuff occlusion significantly diminished the baseline BF only in the SFA, and not in the DFA or CFA (Table 1).
It should be recognized that cuff occlusion may activate ion channel currents and generate endogenous reactive oxygen species, and upon cuff release, initiate NO mediated dilation (Liu & Gutterman, 2002; Thijssen et al., 2011). However, it is important to note that these effects would occur distal to the cuff, while in the current study, all blood flow measurements were acquired proximal to the inflated cuff and should not, therefore, have been directly affected by these physiological mechanisms.
Impact of Cuff Occlusion on the Distribution of the PLM-Induced Hyperemia
Although previous research, focused on temperature regulation, has examined the effect of lower leg cuff occlusion on BF distribution among the major arteries of the leg with heating (Chiesa et al., 2016), the current study is the first to examine the effect of lower leg cuff occlusion on the distribution of PLM-induced hyperemia beyond the CFA, into the DFA and SFA. This study documented that cuff occlusion below the knee significantly attenuated the PLM-induced hyperemic response measured in the SFA (BFΔpeak and main effect over time), which was reflected in the CFA, but not in the DFA (Figure 2). Importantly, despite suprasystolic cuff occlusion below the knee, the SFA still exhibits a PLM-induced hyperemic response, albeit reduced. Again, as the SFA supplies some blood to the upper leg (Bajzer, 2004), there is likely some PLM-induced deformation of the microvasculature beyond the SFA in the upper leg, resulting in vasodilation.
In broad terms, studies employing the PLM technique aim to evaluate the capacity of the vasculature to vasodilate, or to quantify vascular conductance. As pressure has an impact on BF, both are prerequisite measures for quantifying vascular conductance. As the DFA provides blood solely to the upper leg (Chiesa et al., 2016), it is logical that, with no statistical change in the MAP response to cuffed PLM, lower leg cuff-induced BF occlusion did not significantly affect the PLM-induced hyperemic response in the DFA. However, as BF and VC are interdependent, it should be noted, that there was a tendency for DFA BF to be lower with the cuff inflated. Therefore, with cuff occlusion, the combination of the attenuated PLM-induced hyperemic response evident, to some extent, in both the SFA and DFA, explains the reduced hyperemic response measured in the CFA (specifically reduced BFAUC, BFΔpeak, and main effect over time). However, somewhat surprisingly, the difference between the cuffed and uncuffed BF response measured in the CFA is likely minimized by the existence of several perforating arteries emanating from the SFA that perfuse the superficial muscles and skin of the thigh, as well as the knee (Yokochi & Rohen, 1978; Bajzer, 2004). These vessels are proximal to the cuff, when placed below the knee, and are not only likely involved in the PLM-induced hyperemic response, but also negligibly effected by cuff inflation. This is evident from the nonsignificant, minimal difference in the percentage of blood from the CFA passing through the SFA in the control (31 ± 8%, 114 ± 58 ml) and cuffed (27 ± 18%, 80 ± 21 ml) conditions. This suggests that only 12 ± 19% of the uncuffed PLM-induced hyperemia passes through the CFA and, ultimately, into the areas in the lower leg supplied by the SFA (calculated as: ((control SFA BFAUC – cuff SFA BFAUC) ÷ control CFA BFAUC) × 100). Thus, during PLM, 88 ± 19% of the PLM-induced hyperemia that passes through the SFA appears to be actually perfusing the anatomy above the cuff and not the lower leg. However, in the young, healthy subjects in this study, as a fraction of the PLM-induced hyperemia, measured in the CFA, does in fact appear to pass through the SFA and ultimately the lower leg, cuffing the lower leg during PLM should be considered to emphasize the thigh-specific hyperemia in the PLM assessment of vascular function.
Impact of Cuff Occlusion on Vascular Conductance
With lower leg cuff-induced BF occlusion, the PLM-induced vasodilatory response was significantly reduced in the CFA, DFA, and SFA (main effect over time). Interestingly, unlike the response documented for DFA BF, cuffing resulted in a significant main effect in terms of the PLM-induced vasodilation in the DFA over time. These differences can be understood by considering Ohm’s Law and the influence of small changes in both resistance and pressure on flow (West & Luks, 2016). Specifically, cuff occlusion of the lower leg likely increases resistance in the entire leg; while concomitantly, as illustrated in Figure 3, the cuffed condition tended to attenuate the PLM-induced maximal decrease in MAP. Due to this small change in pressure and likely increase in resistance, BF would tend to decrease. In combination, nonsignificant changes in both MAP and BF can have a significant effect on VC, as evidenced by a significant decrease in DFA VC (VCAUC and main effect over time) in the cuffed condition.
Impact of Sex on the Distribution of PLM-Induced Hyperemia and on the Effect of Cuff Occlusion
Although this study was not designed specifically to examine sex differences, due to the equal numbers of male and female participants, some insight can be gained. Indeed, when considering BF distribution during PLM amongst the CFA, DFA, and SFA, the percentage of BF passing through the CFA to the DFA and SFA was not significantly different between males and females. However, interestingly, in this group of subjects, it was evident that males exhibited greater PLM-induced BF AUCs than females in all three arteries. These relatively large differences were considerably attenuated by normalizing the BF responses for thigh volume, which was significantly greater in the, generally larger, males than the females. Specifically, when normalizing CFA, DFA, and SFA BFΔpeak and BFAUC to thigh volume, all differences between males and females were ameliorated. These findings suggest that additional investigations focused upon the role of both sex and thigh mass on the PLM response are warranted. Finally, in terms of the effects of cuff occlusion on the distribution of the PLM-induced hyperemia and vasodilation, there was no evidence that sex played a role, with males and females exhibiting similar responses to cuff occlusion during PLM in all three arteries.
Implications for Future Investigations
The finding that both the hyperemic and vasodilatory responses to PLM, as measured in the CFA, were significantly attenuated with cuff occlusion in young, healthy subjects has potential implications for future investigations. For example, the effect of cuff occlusion on PLM-induced hyperemia in differing populations remains unknown. Specifically, PLM-induced hyperemia is attenuated in aging and disease, but the effect of cuff occlusion on these results has yet to be determined (Groot et al., 2015; Trinity et al., 2015; Witman et al., 2015). Furthermore, intra-arterial drug infusion studies, aiming to further quantify the role of particular vasodilators to the total PLM-induced hyperemic response, regularly utilize an occlusion cuff placed just below the knee to localize the effects of a drug to the upper leg (Trinity et al., 2012; Trinity et al., 2015; Broxterman et al., 2017). For instance, Trinity et al (Trinity et al., 2012) occluded BF to the lower leg and inhibited NO synthase via the continuous intra-arterial infusion of NG-monomethyl-L-arginine during PLM to quantify the contribution of NO to the PLM-induced hyperemic response. However, until now, in terms of the PLM technique, it has been assumed that the SFA BF characteristics do not contribute to the total magnitude of the CFA hyperemic response, and that lower leg cuff-induced BF occlusion does not alter this response. Indeed, the present investigation revealed that the majority of the PLM-induced hyperemia predominantly traverses the DFA and, of note, this was unaltered by cuffing. Though, it is important to remember that vascular function is assessed in the CFA, which is affected by alterations in SFA BF and VC. Thus, future investigations employing PLM in different populations, as well as drug infusion studies utilizing PLM, should consider the effects of cuff occlusion in terms of experimental design and, potentially, interpretation. However, cuff occlusion does not need to be an obligatory component of the PLM technique, instead, the usefulness of a cuff should be determined on a study by study basis. Finally, although not specifically designed to assess sex differences, the current study does suggest that additional investigations focused upon the role of sex and thigh mass on the PLM-induced hyperemic response are warranted.
Experimental Considerations
In this study, simultaneous measurements of CFA and SFA blood velocity and diameter were obtained, but DFA BF was calculated as CFA BF minus SFA BF. The DFA is very difficult to accurately measure during PLM, because the leg movement typically causes both the artery and the vein to move quite vigorously, resulting in noisy pulse-wave velocity recordings and blurring the artery walls. A further challenge is that in some individuals, after the bifurcation of the CFA into the DFA and SFA, the DFA exhibits immediate (less than 2 cm away from the bifurcation) branching arteries, perfusing the muscles of the thigh. In order to avoid turbulent blood flow, it is common to measure at least 2 cm below a bifurcation, but this could result in underestimating total DFA blood flow by not including branches of the DFA that occur within the first 2 cm. Nevertheless, in two subjects, we were able to measure CFA, DFA, and SFA BF during PLM that did not exhibit such early bifurcating branches of the DFA, and documented that the measured CFA BF (BFΔpeak: 848 ± 327 ml/min, BF AUC: 244 ± 67 ml) was equivalent to the calculated CFA BF (measured SFA + DFA BF; BFΔpeak: 730 ± 345 ml/min, BF AUC: 216 ± 78 ml) (p > 0.05). This lack of significant differences adds confidence to the current approach of calculating DFA BF in the present investigation. It should also be noted that the current values for baseline CFA and SFA BF are similar to those previously recorded in the literature (Holland et al., 1998; McDaniel et al., 2010; Trinity et al., 2012; Broxterman et al., 2017; Zuj et al., 2018).
This study determined the distribution of BF during PLM in both healthy, young men and women. It should be noted that, in regards to the women, menstrual cycle phase was not controlled for in this study. However, this study was focused not on vascular function, per se, but on the distribution of BF during PLM with and without cuffing, which was considered unlikely to be affected by menstrual cycle phase. Furthermore, even though the subjects were tested on two separate days, and therefore possibly during different menstrual cycle phases, the current findings are still very clear. Therefore, even if variability existed between visits as a result of menstrual cycle phase, our results were strong enough to still document significant differences.
Conclusion
This investigation quantified the PLM-induced hyperemia, beyond the CFA, into the DFA and SFA, and also examined the effect of lower leg cuff-induced BF occlusion on this response, by performing PLM with and without cuff occlusion. In terms of BF distribution, in response to uncuffed PLM, of the total BF that passed through the CFA, the majority was directed to the DFA (~70%) while only ~30% passed through the SFA. Although cuff occlusion did attenuate the BF response in the CFA, it is important to note that the proportion of blood passing through the DFA and SFA was essentially unchanged. However, as a small fraction of the PLM-induced hyperemia does pass through the SFA to the lower leg, cuffing the lower leg during PLM should be considered to emphasize the thigh-specific hyperemia in the PLM assessment of vascular function.
NEW FINDINGS.
-
What is the central question of this study?
What is the distribution of the hyperemic response to passive leg movement (PLM) in the common (CFA), deep (DFA), and superficial (SFA) femoral arteries? What is the impact of lower leg cuff-induced blood flow occlusion on this response?
-
What is the main finding and its importance?
Of the total blood that passed through the CFA, the majority was directed to the DFA and this was unaffected by cuffing. As a small fraction does pass through the SFA to the lower leg, cuffing during PLM should be considered to emphasize the thigh-specific hyperemia.
Acknowledgments
GRANTS
This work was supported by Veterans Administration Rehabilitation Research and Development Service Grants (E6910-R, E1697-R, E1433-P, E9275-L and E1572-P) and National Institutes of Health under Ruth L. Kirschstein National Research Service Award NIH 1T32HL139451 from the National Heart, Lung, and Blood Institute.
Footnotes
DISCLOSURES
No conflicts of interest, financial or otherwise, are declared by the authors.
REFERENCES
- Azabji Kenfack M, Lador F, Licker M, Moia C, Tam E, Capelli C, Morel D & Ferretti G (2004). Cardiac output by Modelflow method from intra-arterial and fingertip pulse pressure profiles. Clin Sci (Lond) 106, 365–369. [DOI] [PubMed] [Google Scholar]
- Bajzer CT (2004). Arterial supply of the lower extremities. In Guide to Peripheral and Cerebrovascular Intervention; ed. Remedica Dl B., London. [Google Scholar]
- Broxterman RM, Trinity JD, Gifford JR, Kwon OS, Kithas AC, Hydren JR, Nelson AD, Morgan DE, Jessop JE, Bledsoe AD & Richardson RS (2017). Single passive leg movement assessment of vascular function: contribution of nitric oxide. J Appl Physiol (1985) 123, 1468–1476. [DOI] [PMC free article] [PubMed] [Google Scholar]
- Cheng TH, Chen JJ, Shih NL, Lin JW, Liu JC, Chen YL & Chen CH (2009). Mechanical stretch induces endothelial nitric oxide synthase gene expression in neonatal rat cardiomyocytes. Clin Exp Pharmacol Physiol 36, 559–566. [DOI] [PubMed] [Google Scholar]
- Chiesa ST, Trangmar SJ & González-Alonso J (2016). Temperature and blood flow distribution in the human leg during passive heat stress. J Appl Physiol (1985) 120, 1047–1058. [DOI] [PMC free article] [PubMed] [Google Scholar]
- Clifford PS, Kluess HA, Hamann JJ, Buckwalter JB & Jasperse JL (2006). Mechanical compression elicits vasodilatation in rat skeletal muscle feed arteries. J Physiol 572, 561–567. [DOI] [PMC free article] [PubMed] [Google Scholar]
- de Vaal JB, de Wilde RB, van den Berg PC, Schreuder JJ & Jansen JR (2005). Less invasive determination of cardiac output from the arterial pressure by aortic diameter-calibrated pulse contour. Br J Anaesth 95, 326–331. [DOI] [PubMed] [Google Scholar]
- de Wilde RB, Geerts BF, Cui J, van den Berg PC & Jansen JR (2009). Performance of three minimally invasive cardiac output monitoring systems. Anaesthesia 64, 762–769. [DOI] [PubMed] [Google Scholar]
- Deanfield JE, Halcox JP & Rabelink TJ (2007). Endothelial function and dysfunction: testing and clinical relevance. Circulation 115, 1285–1295. [DOI] [PubMed] [Google Scholar]
- Gifford JR & Richardson RS (2017). CORP: Ultrasound assessment of vascular function with the passive leg movement technique. J Appl Physiol (1985) 123, 1708–1720. [DOI] [PMC free article] [PubMed] [Google Scholar]
- Gokce N, Keaney JF Jr., Hunter LM, Watkins MT, Nedeljkovic ZS, Menzoian JO& Vita JA(2003). Predictive value of noninvasively determined endothelial dysfunction for long-term cardiovascular events in patients with peripheral vascular disease. J Am Coll Cardiol 41, 1769–1775. [DOI] [PubMed] [Google Scholar]
- Groot HJ, Trinity JD, Layec G, Rossman MJ, Ives SJ, Morgan DE, Bledsoe A & Richardson RS (2015). The role of nitric oxide in passive leg movement-induced vasodilatation with age: insight from alterations in femoral perfusion pressure. J Physiol 593, 3917–3928. [DOI] [PMC free article] [PubMed] [Google Scholar]
- Groot HJ, Trinity JD, Layec G, Rossman MJ, Ives SJ & Richardson RS (2013). Perfusion pressure and movement-induced hyperemia: evidence of limited vascular function and vasodilatory reserve with age. Am J Physiol Heart Circ Physiol 304, H610–619. [DOI] [PMC free article] [PubMed] [Google Scholar]
- Heitzer T, Schlinzig T, Krohn K, Meinertz T & Munzel T (2001). Endothelial dysfunction, oxidative stress, and risk of cardiovascular events in patients with coronary artery disease. Circulation 104, 2673–2678. [DOI] [PubMed] [Google Scholar]
- Holland CK, Brown JM, Scoutt LM & Taylor KJ (1998). Lower extremity volumetric arterial blood flow in normal subjects. Ultrasound Med Biol 24, 1079–1086. [DOI] [PubMed] [Google Scholar]
- Iepsen UW, Munch GD, Rugbjerg M, Rinnov AR, Zacho M, Mortensen SP, Secher NH, Ringbaek T, Pedersen BK, Hellsten Y, Lange P & Thaning P (2016). Effect of endurance versus resistance training on quadriceps muscle dysfunction in COPD: a pilot study. Int J Chron Obstruct Pulmon Dis 11, 2659–2669. [DOI] [PMC free article] [PubMed] [Google Scholar]
- Jones PR & Pearson J (1969). Anthropometric determination of leg fat and muscle plus bone volumes in young male and female adults. J Physiol 204, 63p–66p. [PubMed] [Google Scholar]
- Jufri NF, Mohamedali A, Avolio A & Baker MS (2015). Mechanical stretch: physiological and pathological implications for human vascular endothelial cells. Vasc Cell 7, 8. [DOI] [PMC free article] [PubMed] [Google Scholar]
- Lind L, Berglund L, Larsson A & Sundstrom J (2011). Endothelial function in resistance and conduit arteries and 5-year risk of cardiovascular disease. Circulation 123, 1545–1551. [DOI] [PubMed] [Google Scholar]
- Liu Y & Gutterman DD (2002). Oxidative stress and potassium channel function. Clin Exp Pharmacol Physiol 29, 305–311. [DOI] [PubMed] [Google Scholar]
- McDaniel J, Fjeldstad AS, Ives S, Hayman M, Kithas P & Richardson RS (2010). Central and peripheral contributors to skeletal muscle hyperemia: response to passive limb movement. J Appl Physiol (1985) 108, 76–84. [DOI] [PMC free article] [PubMed] [Google Scholar]
- Mortensen SP, Askew CD, Walker M, Nyberg M & Hellsten Y (2012). The hyperaemic response to passive leg movement is dependent on nitric oxide: a new tool to evaluate endothelial nitric oxide function. J Physiol 590, 4391–4400. [DOI] [PMC free article] [PubMed] [Google Scholar]
- Radegran G, Blomstrand E & Saltin B (1999). Peak muscle perfusion and oxygen uptake in humans: importance of precise estimates of muscle mass. J Appl Physiol (1985) 87, 2375–2380. [DOI] [PubMed] [Google Scholar]
- Seals DR, Jablonski KL & Donato AJ (2011). Aging and vascular endothelial function in humans. Clin Sci (Lond) 120, 357–375. [DOI] [PMC free article] [PubMed] [Google Scholar]
- Sugawara J, Tanabe T, Miyachi M, Yamamoto K, Takahashi K, Iemitsu M, Otsuki T, Homma S, Maeda S, Ajisaka R & Matsuda M (2003). Non-invasive assessment of cardiac output during exercise in healthy young humans: comparison between Modelflow method and Doppler echocardiography method. Acta Physiol Scand 179, 361–366. [DOI] [PubMed] [Google Scholar]
- Thijssen DH, Black MA, Pyke KE, Padilla J, Atkinson G, Harris RA, Parker B, Widlansky ME, Tschakovsky ME & Green DJ (2011). Assessment of flow-mediated dilation in humans: a methodological and physiological guideline. Am J Physiol Heart Circ Physiol 300, H2–12. [DOI] [PMC free article] [PubMed] [Google Scholar]
- Trinity JD, Amann M, McDaniel J, Fjeldstad AS, Barrett-O’Keefe Z, Runnels S, Morgan DE, Wray DW & Richardson RS (2010). Limb movement-induced hyperemia has a central hemodynamic component: evidence from a neural blockade study. Am J Physiol Heart Circ Physiol 299, H1693–1700. [DOI] [PMC free article] [PubMed] [Google Scholar]
- Trinity JD, Groot HJ, Layec G, Rossman MJ, Ives SJ, Morgan DE, Gmelch BS, Bledsoe A & Richardson RS (2015). Passive leg movement and nitric oxide-mediated vascular function: the impact of age. Am J Physiol Heart Circ Physiol 308, H672–679. [DOI] [PMC free article] [PubMed] [Google Scholar]
- Trinity JD, Groot HJ, Layec G, Rossman MJ, Ives SJ, Runnels S, Gmelch B, Bledsoe A & Richardson RS (2012). Nitric oxide and passive limb movement: a new approach to assess vascular function. J Physiol 590, 1413–1425. [DOI] [PMC free article] [PubMed] [Google Scholar]
- Trinity JD, McDaniel J, Venturelli M, Fjeldstad AS, Ives SJ, Witman MA, Barrett-O’Keefe Z, Amann M, Wray DW & Richardson RS (2011). Impact of body position on central and peripheral hemodynamic contributions to movement-induced hyperemia: implications for rehabilitative medicine. Am J Physiol Heart Circ Physiol 300, H1885–1891. [DOI] [PMC free article] [PubMed] [Google Scholar]
- van Lieshout JJ, Toska K, van Lieshout EJ, Eriksen M, Walloe L & Wesseling KH (2003). Beat-to-beat noninvasive stroke volume from arterial pressure and Doppler ultrasound. Eur J Appl Physiol 90, 131–137. [DOI] [PubMed] [Google Scholar]
- Venturelli M, Amann M, McDaniel J, Trinity JD, Fjeldstad AS & Richardson RS (2012). Central and peripheral hemodynamic responses to passive limb movement: the role of arousal. Am J Physiol Heart Circ Physiol 302, H333–339. [DOI] [PMC free article] [PubMed] [Google Scholar]
- West JB & Luks A (2016). West’s respiratory physiology : the essentials. Wolters Kluwer, Philadelphia. [Google Scholar]
- Widlansky ME, Gokce N, Keaney JF Jr., & Vita JA(2003). The clinical implications of endothelial dysfunction. J Am Coll Cardiol 42, 1149–1160. [DOI] [PubMed] [Google Scholar]
- Witman MA, Ives SJ, Trinity JD, Groot HJ, Stehlik J & Richardson RS (2015). Heart failure and movement-induced hemodynamics: partitioning the impact of central and peripheral dysfunction. Int J Cardiol 178, 232–238. [DOI] [PMC free article] [PubMed] [Google Scholar]
- Wray DW, Uberoi A, Lawrenson L & Richardson RS (2005). Heterogeneous limb vascular responsiveness to shear stimuli during dynamic exercise in humans. J Appl Physiol (1985) 99, 81–86. [DOI] [PubMed] [Google Scholar]
- Wray DW, Uberoi A, Lawrenson L & Richardson RS (2006). Evidence of preserved endothelial function and vascular plasticity with age. Am J Physiol Heart Circ Physiol 290, H1271–1277. [DOI] [PubMed] [Google Scholar]
- Yokochi C & Rohen JW (1978). Photographic anatomy of the human body. University Park Press, Baltimore. [Google Scholar]
- Zuj KA, Prince CN, Hughson RL & Peterson SD (2018). Enhanced muscle blood flow with intermittent pneumatic compression of the lower leg during plantar flexion exercise and recovery. J Appl Physiol (1985) 124, 302–311. [DOI] [PMC free article] [PubMed] [Google Scholar]