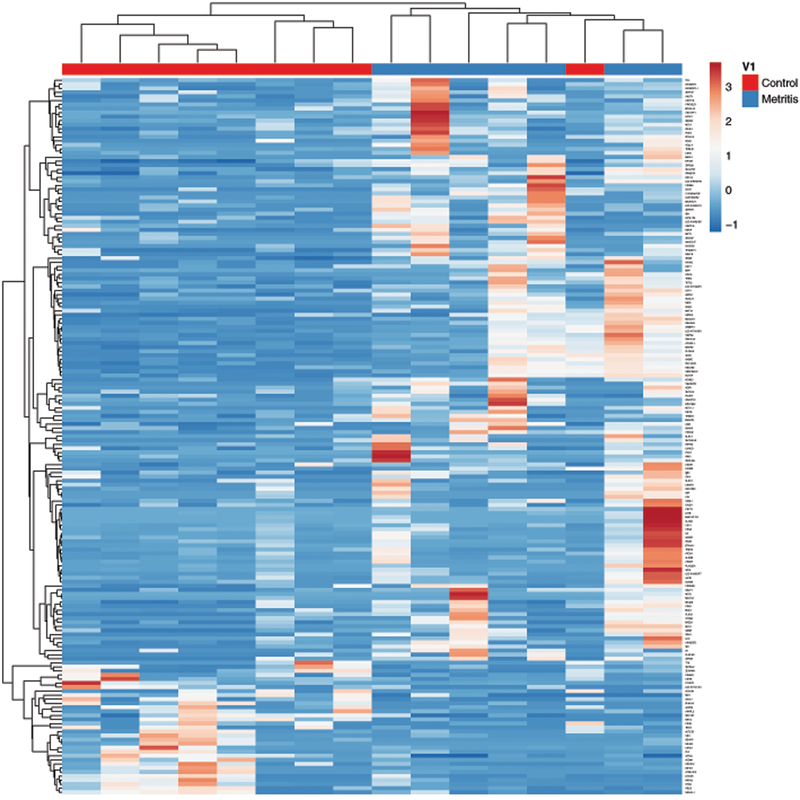
Figure 3. Heatmap of differentially expressed granulosa cell genes in metritis cows.
A heatmap and hierarchical clustering of differentially expressed genes in metritis cows (blue) and control cows (red). Each differentially expressed gene is represented by a single row, and each cow is represented by a single column. Both rows and columns are clustered using correlation distance and average linkage.

