

Oral cavity squamous cell carcinoma (OSCC) is frequently diagnosed at an advanced stage, leading to poor prognosis and high mortality rate. To develop method for OSCC detection, proteome of tumor interstitial fluids (TIFs) has been profiled. The proteins differentially expressed in TIFs were highly associated with aminoacyl tRNA biosynthesis pathway. Importantly, nidogen-1 is a potential diagnostic and/or prognostic biomarker. The results suggest that TIF analysis facilitates understanding of OSCC microenvironment and discovery of biomarker candidates.
Keywords: Head and neck cancer, Biofluids, Biomarker: Prognostic, Biomarker: Diagnostic, Label-free quantification, interstitial fluids, oral cancer
Graphical Abstract

Highlights
Proteome profiling of tissue interstitial fluids (TIFs) of oral cancer.
Pathway of aminoacyl tRNA biosynthesis enriched in proteome of TIFs.
Verification of nidogen-1 as a salivary biomarker of oral cancer.
High correlation between elevated tissue level of nidogen-1 and poor survival.
Abstract
Patients with oral cavity squamous cell carcinoma (OSCC) are frequently first diagnosed at an advanced stage, leading to poor prognosis and high mortality rates. Early detection of OSCC using body fluid-accessible biomarkers may improve the prognosis and survival rate of OSCC patients. As tumor interstitial fluid is a proximal fluid enriched with cancer-related proteins, it is a useful reservoir suitable for the discovery of cancer biomarkers and dysregulated biological pathways in tumor microenvironments. Thus, paired interstitial fluids of tumor (TIF) and adjacent noncancerous (NIF) tissues from 10 OSCC patients were harvested and analyzed using one-dimensional gel electrophoresis coupled with liquid chromatography-tandem mass spectrometry (GeLC-MS/MS). Using label-free spectral counting-based quantification, 113 proteins were found to be up-regulated in the TIFs compared with the NIFs. The gene set enrichment analysis (GSEA) revealed that the differentially expressed TIF proteins were highly associated with aminoacyl tRNA biosynthesis pathway. The elevated levels of 4 proteins (IARS, KARS, WARS, and YARS) involved in the aminoacyl tRNA biosynthesis were verified in the OSCC tissues with immunohistochemistry (IHC). In addition, nidogen-1 (NID1) was selected for verification as an OSCC biomarker. Salivary level of NID1 in OSCC patients (n = 48) was significantly higher than that in the healthy individuals (n = 51) and subjects with oral potentially malignant disorder (OPMD; n = 53). IHC analysis showed that NID1 level in OSCC tissues was increased compared with adjacent noncancerous epithelium (n = 222). Importantly, the elevated NID1 level was correlated with the advanced stages of OSCC, as well as the poor survival of OSCC patients. Collectively, the results suggested that TIF analysis facilitates understanding of the OSCC microenvironment and that salivary NID1 may be a useful biomarker for OSCC.
Oral cavity squamous cell carcinoma (OSCC)1 is frequently diagnosed at its late stage, leading to high mortality of the patients (1, 2). Based on the information from Surveillance, Epidemiology, and End Results Program, the five-year survival rate for localized oral cavity and pharynx cancer is 84% but is reduced to ∼50% for cancer with lymphatic or distal metastasis among the U.S. population. Unfortunately, only 29.3% of oral cavity and pharynx cancers are diagnosed at the local stage. Persistent poor survival of OSCC patients is largely attributable to late diagnosis, suggesting that early detection of OSCC remains one of the most effective strategies to improve the outcome and treatment of the disease (3). The current approach to OSCC detection, which includes visual examination of oral cavity succeeded by inspection with biopsy, is sometimes inefficient (4, 5), indicating that there is an urgent need to identify useful biomarkers for OSCC screening and prognosis.
Acquaintances with tumor microenvironment are useful to develop biomarkers for cancer detection and prognosis (6, 7). To understand OSCC microenvironment, we have previously analyzed the proteomes in conditioned media of OSCC cell lines, and revealed that 2 secreted proteins, guanylate-binding protein 1 and thrombospondin-2, could be potential OSCC biomarkers (8, 9). Compared with the conditioned media, interstitial fluid of tumor tissue (TIF) is a proximal fluid in vivo that bathes the tumor microenvironment, and therefore enriched with myriad cancer-related molecules (10), suggesting that profiling of TIF proteome from OSCC can greatly improve the understanding of the disease.
TIF proteins are principally released from tumor cells and their surrounding cells in the tumor tissues and have a profound influence on pathological behaviors of the tumor cells (11, 12). Analysis of TIF proteome will assist in better comprehending biological processes dysregulated in the cancers. Moreover, TIF proteins have a higher tendency to enter body fluids and thus can be measured using non-invasive diagnostic tests for cancer detection. To date, TIF proteomes of various cancer types have been analyzed, including breast (13, 14), liver (15), kidney (16), ovarian (17, 18), cervical (19), lung (20), and colorectal (21) cancers. However, TIF proteome of OSCC remains poorly characterized.
To explore tumor microenvironment for accelerating identification of OSCC biomarkers, the paired interstitial fluids of tumor and adjacent noncancerous epithelia (NIF) tissues were harvested from 10 OSCC patients in the present study. The TIF and NIF proteomes were analyzed using the gel-enhanced liquid chromatography coupled with tandem mass spectrometry (GeLC-MS/MS) and compared with the spectral counting-based quantification. Gene set enrichment analysis (GSEA) revealed that the proteins differentially expressed in the TIFs are highly associated with aminoacyl-tRNA biosynthesis pathway. Among the proteins with elevated TIF levels, nidogen-1 (NID1) has been selected for verification as a potential biomarker of OSCC. The salivary NID1 level in the OSCC patients was significantly increased compared with the healthy volunteers and individuals with oral potentially malignant disorder (OPMD). Moreover, the immunohistochemistry (IHC) analysis showed that the elevated NID1 level was correlated with the advanced OSCC stages, as well as the poor survival of patients. Collectively, the results suggested that TIF proteome analysis facilitates understanding of the OSCC microenvironment and that salivary NID1 may be a useful biomarker for OSCC.
MATERIALS AND METHODS
Experimental Design and Statistical Rationale
All specimens were collected at Chang Gung Memorial Hospital, Linkou, Taoyuan, Taiwan following the principles of the Declaration of Helsinki. An informed consent form approved by the Chang Gung Medical Foundation Institutional Review Board was signed by each volunteer before sample collection. For collection of interstitial fluid, tissues of oral cavities in the 10 OSCC patients before treatment were harvested from October 2010 to January 2011 (Table I). Paired cancerous (TIF) and adjacent noncancerous (NIF) interstitial proteins were collected, and each individual sample was analyzed twice as technical replicates. The significance of proteins differentially expressed between paired samples was evaluated by the inverted beta-binomial test (22). To control false discovery rate (FDR), p values were adjusted for multiple testing with the Benjamini-Hochberg procedure (23).
Table I. Characteristics of the OSCC patients for collection of interstitial fluids and detection of aminoacyl tRNA biosynthesis-related proteins.
| OSCC patient | Sex | Age (years) | Site | Overall stage | TNM pT status | TNM pN status | Cell differentiation |
|---|---|---|---|---|---|---|---|
| Collection of interstitial fluids | |||||||
| P01 | Male | 50 | Gingiva | IVa | 4A | 0 | Well |
| P02 | Male | 59 | Tongue | IVa | 4A | 2B | Poor |
| P04 | Male | 36 | Buccal mucosa | III | 1 | 2B | Well |
| P05 | Male | 30 | Tongue | III | 3 | 0 | Well |
| P10 | Male | 76 | Tongue | IVa | 2 | 2B | Well |
| P12 | Male | 46 | Gingiva | II | 2 | 0 | Moderate |
| P13 | Male | 36 | Floor of mouth | II | 2 | 0 | Well |
| P14 | Female | 73 | Buccal mucosa | III | 3 | 0 | Poor |
| P15 | Male | 65 | Gingiva | IVa | 4A | 2B | Poor |
| P17 | Male | 54 | Buccal mucosa | III | 2 | 1 | Poor |
| Immunohistochemistry of IARS, KARS, WARS, and YARS | |||||||
| A | Male | 47 | Gingiva | II | 2 | 0 | Moderate |
| B | Male | 53 | Gingiva | IVa | 4A | 2B | Moderate |
| C | Male | 49 | Tongue | II | 2 | 0 | Moderate |
| D | Male | 65 | Tongue | II | 2 | 0 | Moderate |
| E | Male | 74 | Buccal mucosa | II | 2 | 0 | Well |
| F | Female | 55 | Gingiva | IVa | 4A | 2B | Moderate |
| G | Female | 67 | Tongue | IVa | 4A | 0 | Poor |
| H | Male | 47 | Tongue | I | 1 | 0 | Moderate |
| I | Male | 50 | Tongue | III | 1 | 1 | Well |
| J | Male | 33 | Tongue | IVa | 4A | 2B | Poor |
| K | Male | 56 | Buccal mucosa | IVa | 4A | 2B | Moderate |
| L | Male | 67 | Tongue | IVa | 4A | 0 | Moderate |
Saliva samples were collected from 51 healthy volunteers, 53 individuals with OPMD, and 48 OSCC patients from 2012 to 2013. All subjects were examined by an oral mucosal screening test. The individuals with OPMD or OSCC were biopsy-proven and underwent routine check-ups according to the standard protocol. For IHC analysis of proteins involved in aminoacyl-tRNA biosynthesis and NID1, untreated cancer tissues from 12 (Table I) and 222 (Table III) patients with OSCC were obtained, respectively from 2002 to 2009.
Table III. Correlation between the clinicopathological features and the tissue levels of NID1 in untreated OSCC patients.
| Characteristics | No | IHC scorea | p valueb |
|---|---|---|---|
| Gender | |||
| Female | 23 | 125 ± 64 | 0.683 |
| Male | 199 | 135 ± 75 | |
| Age (years) | |||
| < 50.3 | 111 | 127 ± 76 | 0.123 |
| ≥ 50.9 | 111 | 140 ± 71 | |
| Pathological T (pT) status | |||
| T1-T2 | 105 | 115 ± 77 | < 0.001 |
| T3-T4 | 117 | 150 ± 66 | |
| Pathological N (pN) status | |||
| pN negative | 133 | 123 ± 71 | 0.017 |
| pN positive | 89 | 149 ± 76 | |
| Overall pathological stage | |||
| I-II | 73 | 109 ± 74 | < 0.001 |
| III-IV | 149 | 145 ± 70 | |
| Cell differentiationc | |||
| W-D and M-D | 195 | 132 ± 70 | 0.444 |
| P-D | 27 | 147 ± 95 | |
| Perineural invasion | |||
| No | 149 | 127 ± 75 | < 0.042 |
| Yes | 73 | 148 ± 70 | |
| Tumor depth | |||
| ≤ 8 mm | 112 | 113 ± 73 | < 0.001 |
| > 8 mm | 110 | 154 ± 69 |
aData are shown as mean ± SD
bThe p values between two groups were determined by the Mann-Whitney U test.
cW-D, well-differentiation; M-D, moderate differentiation; P-D, poor differentiation.
The procedure for collecting saliva samples has been previously described (8). Briefly, after avoiding eating, drinking, smoking, and using oral hygiene products for at least 1 h, the unstimulated whole saliva was obtained from donors during oral mucosal examination. The collected samples were then centrifuged at 3000 × g for 15 min at 4 °C. The supernatants were immediately treated with a protease inhibitor mixture (2 μl/ml; Sigma-Aldrich, St. Louis, MO), aliquoted into 100 μl and stored at −80 °C without thawing until use to avoid protein degradation.
Preparation of Tissue Interstitial Fluid Samples
To collect TIF and NIF samples, the paired cancerous and adjacent noncancerous tissues (5 × 5 × 5 mm3) in oral cavity of the OSCC patients were harvested by the otolaryngologists during the operation (Table I). After weighting, the tissues were immediately processed. The tissues were washed with ice-cold PBS to avoid blood contamination as much as possible and were dissected into 1–3 mm3 pieces by scalpels. The cut tissues were placed into 1.5-ml microcentrifuge tubes and further washed by ice-cold PBS until the supernatant was clear. To collect interstitial proteins, the cut tissues were incubated with 600 μl of PBS for 1 h in a humidified incubator at 37 °C containing 5% CO2. After centrifuging at 8000 × g for 15 min at 4 °C, the supernatants were immediately treated with a protease inhibitor mixture (2 μl/ml; Sigma-Aldrich) and stored at −80 °C. The samples can be enrolled in the study if their donors have been confirmed as OSCC patients by the pathological reports.
In-gel Digestion and GeLC-MS/MS for Proteome Analysis
Protein concentration of interstitial fluid was determined by BCA assay (Thermo Scientific, Rockford, IL). Proteins (30 μg) of the interstitial fluid samples were separated by 10% SDS-PAGE and stained by 0.5% Coomassie Brilliant Blue G-250 (Amresco Inc., Solon, OH). After destaining with 10% methanol (Mallinckrodt Baker, Phillipsburg, NJ) and 5% acetic acid (Mallinckrodt Baker), each gel lane was cut into 25 pieces and further separated into 2 replicates. Each piece was then dehydrated in acetonitrile (Mallinckrodt Baker) and dried in a SpeedVac. Proteins were reduced with 25 mm NH4HCO3 (Sigma-Aldrich) containing 10 mm dithiothreitol (Biosynth AG, Staad, Switzerland) at 60 °C for 30 min, alkylated with 55 mm iodoacetamide (Amersham Biosciences, UK) at room temperature for 30 min, and then digested by trypsin (20 μg/ml; Promega, Madison, WI) overnight at 37 °C. The digested peptides were extracted by acetonitrile and dried in a SpeedVac.
To identify proteins, the peptides extracted from each piece were analyzed by LTQ-Orbitrap Discovery (Thermo Fisher, Waltham, MA) coupled with HPLC. Briefly, peptide extracts were reconstituted in buffer A (0.1% formic acid; Sigma-Aldrich), loaded across a trap column (Zorbax 300SB-C18, 0.3 × 5 mm; Agilent Technologies, Taiwan) at a flow rate of 0.2 μl/min in buffer A, and separated on a resolving 100 mm analytical C18 column (inner diameter, 75 μm) using a 15 μm tip (New Objective, Woburn, MA). The peptides were eluted with a 60 min gradient at a flow rate of 0.25 μl/min.
The LTQ Orbitrap was operated using Xcalibur 2.0 software (Thermo Fisher). A data-dependent mode containing one MS scan in the Orbitrap at a resolution of 30000 and 10 MS/MS scans (in the linear ion trap) for the 10 most abundant precursor ions was used to acquire data. The m/z scan range for MS scans was set as 350–2000 Da, and the ion signal of (Si(CH3)2O)6H+ at m/z 445.120025 was used as a lock mass for internal calibration. To increase identification coverage, the precursor ions selected for MS/MS analysis were dynamically excluded for 180 s.
Database Searching and Protein Identification
The resulting spectra were searched with Mascot algorithm (Version 2.1, Matrix Science, Boston, MA) against Swiss-Prot human sequence database (released Mar, 2018, selected for Homo sapiens, 20198 entries) of the European Bioinformatics Institute. The peak list was generated using the Thermo ExtractMSn software (Version 1.0.0.8, May 2012 release). The mass tolerances for parent and fragment ions were set as 10 ppm and 0.5 Da, respectively. The oxidation on methionine (+15.99 Da) and carbamidomethylation on cysteine (+57 Da) were set as variable and fixed modifications, respectively. The enzyme was set as trypsin and up to one missed cleavage was allowed. The random sequence database was used to estimate false positive rates for protein matches. The resulting files were further integrated by Scaffold software (Version 4.2.1, Proteome Software, Portland, OR), which included the PeptideProphet algorithm (24) for assignment of peptide MS spectra and the ProteinProphet algorithm (25) for grouping peptides to a unique protein or a protein family if the peptides are shared among several isoforms. The thresholds for PeptideProphet and ProteinProphet probability were set as 0.95 to ensure an overall FDR below 0.5%. Further, only proteins with 2 unique peptides were retained in the present study.
Spectral Counting-based Label-free Protein Quantification
To compare protein levels between TIF and NIF samples, the label-free method, spectral counting, were used to evaluate the protein abundance in each sample (26, 27). The exclusive spectrum count for each identified protein was exported from the Scaffold software in Excel format (Microsoft, Redmond, WA). To reduce the difference between analyses, the normalized spectral count (NSC) of each protein in the analysis was calculated by the spectral count (SC) for a given protein divided by the total SC of the analysis. The fold change was determined by dividing the average NSC of TIF with that of the paired NIF. To keep from dividing by zero and to prevent overestimation of fold-changes, the missing value (unidentified protein but identified in another sample) was filled in a SC of one. The fold changes of identified proteins were further log2 transformed and adjusted by global normalization. The significance of proteins differentially expressed between paired samples was evaluated by the inverted beta-binomial test (22). To control the FDR, p values were adjusted for multiple testing with the Benjamini-Hochberg procedure (23).
Bioinformatics
GSEA was applied to identify dysregulated pathways enriched in TIF and NIF (28). The log2-transfomred fold-changes of TIF over NIF for proteins were calculated and used to rank identified proteins by abundance. This pre-ranked list was used as the input for GSEA-P 3.0, a desktop application for GSEA (29). The enrichment scores were calculated for the Kyoto Encyclopedia of Genes and Genomes (KEGG) pathways embedded in the Molecular Signatures Database (MSigDB) v6.0 (30, 31). The biological pathway with p < 0.05 and FDR < 0.25 was considered statistically significant in the GSEA analysis. The biological process pathway involved by TIF proteins was also enriched with the online tools on the Database for Annotation, Visualization and Integrated Discovery (DAVID, v6.8, https://david.ncifcrf.gov/home.jsp).
To predict or find out the secretion pathways of identified proteins, publicly available bioinformatics software and database were applied. SignalP 4.1 with the neural network algorithm was used to estimate the presence of secretory signal peptide sequences (32). SecretomeP 2.0 (33) and ExoCarta database (34) were used for deducing proteins that may be released through nonsignal peptide-triggered protein secretion. The transmembrane Hidden Markov model (TMHMM v2.0) was used for predicting transmembrane helices in proteins (35).
ELISA and Immunohistochemistry
The NID1 levels were measured in saliva samples (2-fold dilution) by a bead-based immunoassay developed in-house using antibodies and standard protein from R&D systems (Minneapolis, MN). The detailed procedure was described in supplemental materials and methods. The SERPINH1 levels were determined in 10-fold diluted saliva samples by an ELISA kit from Abcam (Cambridge, UK) according to the manufacturer's instruction. IHC staining was performed on paraffin-embedded tissues using antibodies against NID1 (1:50 dilution; R&D systems), isoleucine-tRNA ligase, cytoplasmic (IARS; 1:50 dilution; Abcam), lysine-tRNA ligase (KARS; 1:100 dilution; Abcam), tryptophan-tRNA ligase, cytoplasmic (WARS; 1:200 dilution; Abcam), and tyrosine-tRNA ligase, cytoplasmic (YARS; 1:100 dilution; Abcam). The detailed procedures and scoring system for IHC are described in supplemental materials and methods.
Statistical Analysis
The correlation of protein spectra counts between duplicates was evaluated by Pearson correlation. The difference of salivary protein levels and IHC scores between groups was evaluated using Mann-Whitney U test. The salivary levels of NID1 and SERPINH1 were integrated into a two-marker panel using logistic regression. The receiver operator characteristic (ROC) curves were constructed by plotting sensitivities for given specificity levels, and the area under the ROC curve (AUC) was calculated. The Wilcoxon rank sum test was used to evaluate the association of IHC scores with clinicopathological characteristics of OSCC patients. To compare the survival rates between groups, Kaplan-Meier curves were constructed and compared by the log-rank test. All analyses were performed using SPSS Statistics (version 20.0; IBM, Armonk, NY), and a p value < 0.05 was considered statistically significant.
RESULTS
Proteome Profiling of 10 Pairs of TIF and NIF Samples from OSCC Patients
To understand OSCC microenvironment for facilitating discovery of the disease biomarkers, we have now used the GeLC-MS/MS strategy to perform an in-depth analysis of interstitial fluids from paired cancerous and adjacent noncancerous tissues of 10 OSCC patients (Fig. 1 and Table I). The collected tissue samples were sliced into pieces, and the TIF and NIF proteins were obtained with one-hour incubation in PBS. The harvested proteins were separated by SDS-PAGE and visualized by Coomassie blue staining (supplemental Fig. S1). Each lane was cut into 25 fractions, and each fraction was cut into 2 equal pieces as technical duplicates. Each gel piece was individually destained, digested with trypsin, and analyzed by LC-MS/MS. The resulting spectra were searched with Mascot algorithms against Swiss-Prot protein database and further integrated by Scaffold software (Fig. 1, upper panel). Based on a cutoff of PeptideProbability ≥ 0.95, at least 2 peptides per protein, and ProteinProbability ≥ 0.95, 3313 non-redundant proteins (3068 and 2242 for the TIF and NIF samples, respectively) were identified (supplemental Fig. S2A). The average numbers of identified proteins in each TIF and NIF sample were 1726 and 1142, respectively (supplemental Table S1).
Fig. 1.
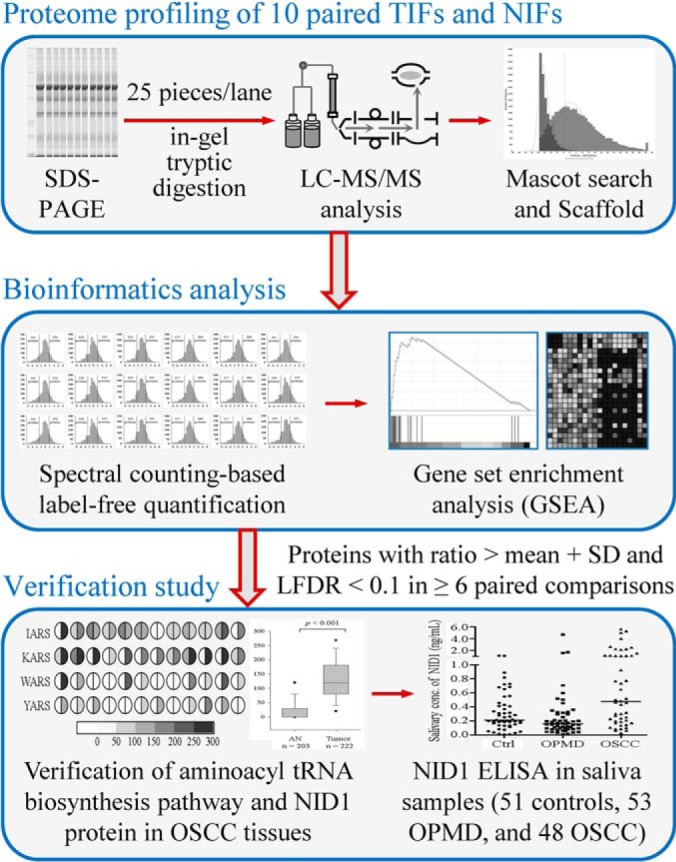
Strategy for the analysis of paired TIFs and NIFs harvested from 10 OSCC patients, comprising proteome profiling by GeLC-MS/MS, bioinformatics analysis, and verification using clinical specimens. Proteins with fold change > mean plus standard deviation (SD) and LFDR < 0.1 in at least 6 out of 10 comparisons were selected as biomarker candidates and prioritized for following verification. The numbers in the parentheses in the bottom panel indicate the sample sizes used in verification study. For IHC analysis, 12 and 222 tissue specimens were used for verification of pathway identified in GSEA and NID1, respectively.
The proteins detected among TIF and NIF samples were analyzed for overlapping members. Among 3313, 1997 (60.3%) were identified in both samples, whereas 1071 (32.3%) and 245 (7.4%) were uniquely found in the TIF and NIF samples, respectively (supplemental Fig. S2A and supplemental Table S2). For 3068 TIF proteins, 1053 (34.3%) were detected in all TIF samples. As to the NIF proteins, 637 (28.4%) out of 2242 were detected in all NIF samples (supplemental Fig. S2B and supplemental Table S2). The proteins identified in each interstitial fluid sample are summarized in supplemental Table S2. The detail information of proteins detected in each duplicate are shown in supplemental Table S3.
To estimate the FDR of peptide identifications, a decoy database containing random sequences was additionally searched. All the FDRs in each analysis were less than 0.2% (supplemental Table S1). In addition, for the technical duplicates, the overlap percentages of protein identification were ranged from 68.2–85.4% and 74.6–81.7% in TIF and NIF samples, respectively, accounting for a reproducibility of 80% in the overall proteome analysis (supplemental Table S1). A total of 1902 (62.0%) and 1250 (55.8%) proteins were found in more than half of the examined TIF and NIF samples, respectively (supplemental Fig. S2B). These observations collectively indicate that the proteome analyses here were adequately performed.
Prediction of Secretory Route for the Proteins in Interstitial Fluids
Proteins in tissue interstitial fluid are released by various cells constituting the tissue microenvironment. To further clarify the secretion routes of the identified proteins, the protein sequence was analyzed by bioinformatics algorithms and the ExoCarta exosome database. Using the SignalP program, 516 out of 3313 were recognized to be released through the classical secretion pathway (supplemental Fig. S3, supplemental Table S2 and S4). The SecretomeP program predicted that 1094 proteins were released via the nonclassical secretory pathway (SignalP probability < 0.90 and SecretomeP score ≥ 0.50). In addition, 1262 proteins have been found in exosomes (SignalP probability < 0.90, SecretomeP score < 0.50, and presented in the ExoCarta database). For the proteins that cannot be categorized into the secretion pathways, 18 proteins were predicted to contain a transmembrane helix, indicating that they may be released through membrane shedding. Collectively, 2890 (87.2%) out of 3313 proteins identified in the interstitial fluids may be released to the tissue microenvironment via different mechanisms (supplemental Fig. S3, supplemental Table S2 and S4). The outcome of the secretion prediction for each protein and interstitial fluid sample is included in supplemental Table S2 and S4, respectively.
Gene Set Enrichment Analysis of Proteins Identified in TIF and NIF Samples
To reveal dysregulated biological pathways in TIF for characterizing OSCC microenvironment, the SC of each identified protein was used for relative quantification of the proteins (Fig. 1, middle panel). To minimize the variation of protein amounts between analyses, the NSC of each protein was calculated by dividing the SC of a protein by the total SC of the analysis. To evaluate the confidence of the spectral counting-based quantification, the correlation of NSCs for overlaps (proteins detected in both duplicate analyses) in duplicate experiments was analyzed. As shown in supplemental Fig. S4, the NSCs of proteins were significantly correlated between the duplicate experiments (p < 0.001). The average of between-duplicate NSC correlations was 0.993, ranged from 0.973 to 0.999, suggesting that the protein quantification were appropriately performed.
To reveal pathways involved in regulation of OSCC microenvironment, GSEA was performed based on the NSCs of identified proteins as described in Materials and Methods. OSCC-associated biological pathways can be identified if the protein expression of a priori defined set of genes was statistically enriched in OSCC TIF or reversely in NIF (28). Using normalized enrichment score (NES) of KEGG pathways in the MSigDB as a cutoff (30), 6 and 14 pathways have been statistically enriched (p < 0.05 and FDR < 0.05) in the TIF and NIF samples, respectively (supplemental Table S5). Among the 6 enriched pathways in TIFs, the aminoacyl tRNA biosynthesis pathway showed the highest NES of 1.87 (Fig. 2 and supplemental Table S5). To verify the enrichment of aminoacyl tRNA biosynthesis pathway in the TIFs, the expressions of 4 members in the aminoacyl tRNA biosynthesis pathway (IARS, KARS, WARS, and YARS) were evaluated in tissue sections from 12 OSCC patients (Table I) using IHC analysis (Fig. 2C). Comparison of the staining scores between tumor and adjacent noncancerous epithelia revealed that most, if not all, OSCC tissues showed higher expression of KARS (12/12), WARS (11/12), and YARS (9/12). Although the number was reduced in IARS, there were 5 OSCC tissues that showed higher expression of IARS compared with adjacent noncancerous epithelia (Fig. 2C).
Fig. 2.

Gene set enrichment analysis (GSEA) of the protein identified in OSCC interstitial fluid. A, Enrichment plot of the aminoacyl tRNA biosynthesis gene set (KEGG, map00970). B, Heat map of all protein among the differential expression of the aminoacyl tRNA biosynthesis gene set. C, Immunohistochemical staining of 4 members (IARS, KARS, WARS, and YARS) of the aminoacyl tRNA biosynthesis gene set in OSCC tissues from 12 patients. The left and right half circles represented the staining scores of paired adjacent noncancerous and cancerous tissues, respectively.
Spectral counting-based quantification for discovery of OSCC biomarkers
To discover biomarker candidates for OSCC, relative levels of the identified proteins between the paired TIF and NIF samples were compared using the spectral counting (Fig. 1, middle panel). The fold change for each TIF protein was determined by dividing the average NSC of the protein in the TIF with that in the paired NIF (supplemental Fig. S5). The significance and FDR of the differential protein expression were evaluated by the inverted beta-binomial test and Benjamini-Hochberg procedure, respectively (22, 23). In each paired comparison, proteins with ratios above the mean ratio plus one standard deviation (SD) and FDR < 0.1 were considered to be overexpressed, whereas proteins with ratios less than the mean minus SD and FDR < 0.1 were considered to be underexpressed (supplemental Table S6). An average of 250 proteins, ranging from 196 to 325, was found to be overexpressed in the TIF samples, and an average of 118 proteins, ranging from 81 to 162, with decreased levels was identified in the TIF samples (supplemental Table S6). The TIF/NIF ratios of identified proteins and the proteins with altered levels in each TIF sample have been listed in supplemental Table S7.
To efficiently narrow down the candidate list of potential OSCC biomarkers, overlapping analysis was performed on the overexpressed proteins among 10 OSCC patients. The results showed that 113 proteins were up-regulated in at least 6 TIF samples. Of note, 7 proteins were overexpressed in all 10 OSCC TIFs compared with their respective NIFs (supplemental Table S7). To further prioritize biomarker candidates among the 113 proteins, their predicted secretion pathways and mRNA expression levels in OSCC tissue from the Oncomine 4.5 database (8) were analyzed. Proteins secreted via the classical pathway were focused on because they are more likely to enter body fluids and are therefore easily detected by immunoassays (supplemental Table S2). Moreover, an elevated TIF protein with up-regulated mRNA level in OSCC tissue implicates that the elevation may have resulted from the tumor itself (supplemental Table S8). The results showed that 9 of 113 proteins were secreted via the classical secretion pathway and had up-regulated OSCC tissue mRNA levels in at least 3 out of 5 datasets (Table II and supplemental Table S8). Among 9 proteins, 7 have been previously reported to be up-regulated in OSCC, including chondroitin sulfate proteoglycan 4 (36), laminin subunit alpha-3 (37), laminin subunit beta-3 (37), laminin subunit gamma-2 (37), periostin (38), serpin H1 (39), and tenascin (38). In addition, laminin subunit beta-1 has been previously reported to be up-regulated in OSCC cells with higher lymphatic metastasis (40). The results suggest that NID1 may be warranted to verify as a novel biomarker for OSCC detection.
Table II. List of up-regulated TIF proteins secreted via classical pathway and whose mRNA levels are elevated in OSCC tissues.
| Protein name (gene name) | Log2 ratio of TIF/NIFa |
Up-regulated mRNA data set numberb | |||||||||
|---|---|---|---|---|---|---|---|---|---|---|---|
| P01 | P02 | P04 | P05 | P10 | P12 | P13 | P14 | P15 | P17 | ||
| Chondroitin sulfate proteoglycan 4 (CSPG4) | 6.19 | 6.58 | 2.47 | 6.00 | 4.72 | 5.92 | 6.89 | 5.21 | 5.80 | 6.29 | 5/5 |
| Laminin subunit alpha-3 (LAMA3) | 5.28 | 6.17 | 4.37 | 3.73 | 5.21 | 3.51 | 4.79 | 6.11 | 7.00 | 5.42 | 5/5 |
| Laminin subunit beta-1 (LAMB1) | 5.68 | 4.36 | 4.72 | 4.11 | 3.63 | 4.59 | 1.84c | 5.25 | 4.48 | 3.57 | 5/5 |
| Laminin subunit beta-3 (LAMB3) | 5.13 | 5.93 | 4.72 | 3.85 | 5.08 | 4.38 | 4.43 | 6.32 | 6.14 | 4.88 | 5/5 |
| Laminin subunit gamma-2 (LAMC2) | 4.59 | 4.94 | 3.76 | 1.41c | 4.68 | 2.71 | 3.63 | 5.69 | 5.61 | 3.47 | 5/5 |
| Nidogen-1 (NID1) | 4.80 | 4.63 | 3.91 | 0.93c | 1.64c | 2.81 | 2.13c | 4.18 | 3.70 | 2.24 | 4/5 |
| Periostin (POSTN) | 4.72 | 2.83 | 7.09 | 4.06 | 4.92 | 2.76 | 5.68 | 4.42 | 0.80c | 2.29 | 5/5 |
| Serpin H1 (SERPINH1) | 0.94c | 3.85 | 5.63 | 5.34 | 4.77 | 3.95 | 4.11 | 2.96 | 4.65 | 2.88 | 3/5 |
| Tenascin (TNC) | 6.71 | 7.65 | 6.48 | 4.36 | 8.03 | 6.79 | 7.10 | 7.94 | 4.63 | 7.09 | 5/5 |
aThe values represent the log2 TIF/NIF ratio of normalized spectra counts in the proteome profiling of interstitial fluids.
bThe data were taken from the Oncomine 4.5 (https://www.oncomine.org/resource/login.html), including Estilo Head-Neck, Talbot Lung, and Ye Head-Neck datasets comparing between tongue squamous cell carcinoma and normal tissues, Ginos Head-Neck dataset comparing head and neck squamous cell carcinoma and normal tissues, and Peng Head-Neck dataset comparing between oral squamous cell carcinoma and normal tissues. Genes with tumor-versus-normal ratio > 1.5 and p < 0.05 were defined as overexpression in cancer tissues.
cThe protein is not upregulated in the TIF samples (p values ≥ 0.05).
Elevated Level of NID1 in Salivary Samples from OSCC Patients
Two candidates, NID1 and SERPINH1, were selected for further verification as salivary biomarkers of OSCC (Fig. 1, lower panel). Their levels were measured in saliva samples from 51 healthy controls and 48 OSCC patients. The individuals with OPMD (n = 53) were also included in the tests to evaluate if such chronic inflammatory diseases in the oral cavity lead to elevated levels of NID1 and SERPINH1. As shown in Fig. 3, the salivary NID1 levels were significantly elevated in OSCC patients (1.05 ± 1.38 ng/ml) compared with the healthy controls (0.32 ± 0.28 ng/ml, p = 0.002) and OPMD individuals (0.33 ± 0.69 ng/ml, p < 0.001). Salivary SERPINH1 level in OSCC patients (12.21 ± 9.05 ng/ml) was significantly higher than that in healthy controls (7.35 ± 4.97 ng/ml, p = 0.003), but was not statistically different to that in OPMD individuals (9.24 ± 6.84 ng/ml, p = 0.069).
Fig. 3.

Saliva levels of NID1 and SERPINH1 in OSCC patients. Salivary (A) NID1 and (B) SERPINH1 levels were measured in 51 healthy controls (Ctrl), 53 noncancerous individuals with oral potentially malignant disorder (OPMD), and 48 OSCC patients (OSCC). Median values are indicated as horizontal lines. C, ROC curve analysis for the use of salivary NID1 and/or SERPINH1 in discriminating OSCC patients (n = 48) from non-OSCC individuals (healthy controls and OPMD individuals; n = 104).
ROC was used to evaluate the ability of NID1 and SERPINH1 as OSCC detection markers. The AUCs of NID1 and SERPINH1 were determined as 0.714 (95% CI, 0.621–0.806) and 0.640 (95% CI, 0.548–0.731) for discriminating the OSCC patients from the noncancerous individuals (51 healthy controls and 53 OPMD individuals), respectively (Fig. 3C). To improve the detection efficiency, these 2 candidates were integrated into a panel using logistic regression. The AUC of the two-marker panel was improved to 0.760 (95% CI, 0.671–0.846; Fig. 3C).
Correlation of NID1 Overexpression with Poor Prognosis of OSCC Patients
Compared with the healthy and OPMD groups, salivary levels of NID1 were increased in the OSCC patients. Therefore, the NID1 expression in oral cavity of 222 OSCC patients was immunohistochemically examined (Fig. 1, lower panel). As shown in Fig. 4A, NID1 was highly expressed in the cytoplasm of OSCC cells, but there was an undetectable or low level of NID1 in adjacent noncancerous epithelia. Tissue sections were further scored based on the intensity and percentage of the cell staining. The IHC score of NID1 in OSCC tissues was significantly higher than that in adjacent noncancerous epithelia (p < 0.001; Fig. 4B).
Fig. 4.

Tissue levels of NID1 in OSCC patients. NID1 expression in OSCC patients was evaluated using immunohistochemical (IHC) staining. A, Representative images of staining from paired adjacent noncancerous and (upper panel) and OSCC tissue (lower panel). Scale bar, 100 μm. Original magnification, ×200. B, The IHC scores of paired adjacent noncancerous (AN) and tumor tissues are represented as a box plot. Box, upper and lower quartiles. Horizontal lines, median. Dashed line, middle 80% distribution. Filled circles, middle 90%. C, D, Survival analysis of OSCC patients with respect to NID1 expression. Kaplan-Meier plots are depicted for long-term overall (C) and disease-free (D) survival of OSCC patients. The plots were stratified using median IHC scores.
The association between the tissue levels of NID1 and clinical manifestations of OSCC in these patients was evaluated. As shown in Table III, elevated level of NID1 was correlated with the advanced pathological T (pT) status (T3-T4), pathological N (pN) status (pN positive), and overall pathological stage (III-IV) in OSCC patients, whereas NID1 level was not correlated with gender, age, and the status of cell differentiation. Moreover, higher level of NID1 was also observed in the OSCC tissues with deeper tumor depth (> 8 mm) and positive perineural invasion (Table III).
Correlation of NID1 Overexpression with OSCC Patient Survival
To evaluate the prognostic value of NID1 expression with regard to OSCC patient survival, OSCC patients were stratified using the median IHC score as the cutoff value, and the survival rates between the 2 groups were compared using Kaplan-Meier plots. As shown in Fig. 4C, the long-term overall survival rates were 50.5% and 73.5% for the patients with high and low NID1 expression, respectively, which were significantly different between the 2 groups according to a long-rank test (p < 0.001). Similarly, the long-term disease-specific survival rates were significantly different between OSCC patients with high and low tumor NID1 expression (45.9% high versus 67.3% low; p < 0.001; Fig. 4D). To determine whether higher tissue NID1 level was an independent predictor of overall survival, multivariate analyses were performed with gender, age, pT status, pN status, overall pathological stage, cell differentiation, perineural invasion, tumor depth, and tissue NID1 level as parameters. As shown in Table IV, the pN status, cell differentiation, tumor depth, and tissue NID1 level were independent predictors of overall survival (p < 0.05). These results collectively indicated that the tissue NID1 level may be useful in predicting prognosis in OSCC patients.
Table IV. The Cox proportional hazard models on overall survival of OSCC patients.
| Characteristics | Multivariate adjusted Harzard Ratio (95% CI)a | p valueb |
|---|---|---|
| Gender | ||
| Male vs. Female | 0.92 (0.45–1.88) | 0.827 |
| Age (years) | ||
| ≥ 50.3 vs. < 50.3 | 0.78 (0.50–1.22) | 0.275 |
| pT status | ||
| T3-T4 vs. T1-T2 | 1.00 (0.51–1.96) | 0.992 |
| pN status | ||
| positive vs. negative | 2.69 (1.53–4.72) | 0.001 |
| Overall pathological stage | ||
| III-IV vs. I-II | 1.21 (0.48–3.02) | 0.684 |
| Cell differentiationc | ||
| P-D vs. W-D and M-D | 2.55 (1.41–4.61) | 0.002 |
| Perineural invasion | ||
| Yes vs. No | 1.04 (0.65–1.68) | 0.859 |
| Tumor depth | ||
| ≥ 8 mm vs. < 8 mm | 2.11 (1.20–3.71) | 0.010 |
| Tissue NID1 level | ||
| high vs. low | 1.89 (1.18–3.03) | 0.008 |
aCI, confidence interval.
bThe p values were determined using the Cox proportional hazard models.
cW-D, well-differentiation; M-D, moderate differentiation; P-D, poor differentiation.
DISCUSSION
Disease proteomics aims to identify and quantify proteins involved in human disease, leading to a better understanding of the disease process, identification of biomarkers for disease prognosis, diagnosis, and development of therapeutic targets (41). The tumor interstitial fluid, located close in proximity to the tumor of interest, is a clinical specimen which contains high concentration of tumor-related molecules that are suitable for cancer research and biomarker identification. TIF proteome of head and neck cancers have been previously profiled, however, the number of identified proteins was limited (42, 43). In the present study, we analyzed 10 pairs of TIF and NIF samples from the OSCC patients using a GeLC-MS/MS approach (Fig. 1, upper panel). A dataset for the interstitial fluid from OSCC patients containing 3270 non-redundant proteins (3005 and 2229 for TIF and NIF, respectively) was constructed (supplemental Fig. S2). To the best of our knowledge, this is the most comprehensive OSCC TIF dataset to date.
The proteins identified in the TIF and NIF samples were examined using spectral counting-based label-free quantification and GSEA to reveal dysregulated biological pathways in OSCC (Fig. 1, middle panel). Based on the proteome profiles of TIF samples, 6 pathways were enriched in the OSCC TIF (supplemental Table S5), including the pathways that have been reported to be involved in cancer progression, such as the pathways of spliceosome, cell cycle, DNA replication, and small cell lung cancer (44, 45). Recently, the alternation of splicing machinery which results in the tumor-associated changes of RNA splicing have been used to develop novel approach of cancer treatment (46). Among the 6 enriched pathways, the aminoacyl tRNA biosynthesis pathway showed the highest NES of 1.87, suggesting possible involvement of aminoacyl tRNA biosynthesis-related proteins in OSCC formation and/or progression. Aminoacyl tRNA synthetases (ARSs) are fundamental enzymes that charge amino acids to their cognate tRNA. Beyond the central role of ARSs in translation, recent studies have revealed their nontranslational functions and have further linked them to the prognosis of cancer (47, 48). For example, human lysyl-tRNA synthetase (KARS) is secreted from cancer cells upon induction by TNF-α and activates proinflammatory signaling in immune cells (49). By in silico analysis of public gene expression databases, Kim et al. showed that ARSs are dysregulated in various types of cancers, including head and neck cancer (48). Consistent with this finding, the present proteomics data showed overexpressed ARS protein levels in the OSCC TIF (Fig. 2). Moreover, IHC demonstrated that 4 ARSs (IARS, KARS, WARS, and YARS) were overexpressed in OSCC tissues (Fig. 2C). Despite the small sample size in the present study (n = 12), a recent study using a large cohort (n = 146) revealed that WARS is overexpressed in OSCC and is positively correlated with tumor invasiveness (50). These results collectively indicated that ARSs are overexpressed in OSCC and that their association with tumor progression needs to be further studied.
Because there is currently no practical OSCC biomarkers for clinical use, the TIF dataset was mined for biomarker candidates by comparing the expression levels of identified proteins in paired samples (supplemental Table S7). This analysis revealed that 113 proteins were overexpressed in at least 6 out of 10 comparisons. Among these proteins, NID1 and SERPINH1 were selected for verification based on a bioinformatics-based analysis combining the gene expression, secretion pathway prediction, and OSCC biomarker novelty. The present results showed that the salivary levels of NID1 and SERPINH1 were significantly elevated in OSCC patients compared with healthy controls (Fig. 3). Compared with OPMD patients, the salivary levels of NID1 were also elevated in OSCC patients, but not for salivary levels of SERPINH1 (Fig. 3), indicating that elevated salivary NID1 levels in OSCC patients may have resulted from cancer but not from chronic disease in the oral cavity. The plasma level of NID1 has been previously reported to be a diagnostic marker for ovarian serous carcinoma (51). For the first time, the present results revealed that the salivary level of NID1 is a biomarker that may differentiate OSCC from noncancerous subjects (AUC, 0.713; Fig. 3C). Therefore, salivary NID level may be used for OSCC detection.
NID1, an essential component of basement membrane, mediates extracellular matrix assembly through its interaction with laminin and collagen IV (52, 53). Cancer formation and metastasis are pathologies associated with disruption of basement membrane, suggesting release of NID1 into tumor microenvironment is correlated with cancer formation and/or metastasis (54). A recent study has reported that NID1 overexpression correlates with tumor invasion in endometrial tumors and that inhibition of NID1 in highly invasive endometrial cells reduces the tumor size and metastasis in an endometrial orthotopic mouse model (55). The present results not only revealed elevated NID1 expression in OSCC tissue compared with adjacent noncancerous epithelia but also that NID1 overexpression in OSCC correlates with increased tumor size (pT status), lymphatic metastasis (pN status), advanced overall pathological stage, positive perineural invasion, and increased tumor depth (Table III). Importantly, OSCC patients with higher NID1 expression showed a poorer overall and disease-free survival (Fig. 4), and the tissue NID1 expression was revealed as an independent predictor for the long-term overall survival of OSCC patients (Hazard ratio = 1.89, p = 0.008; Table IV). Altogether, these results indicated the association between NID1 expression and clinicopathological features of OSCC patients as well as their survival, suggesting that NID1 may be a therapeutic target used for clinical OSCC treatment.
Numerous interferon (IFN)-induced proteins have been identified as the overexpressed proteins in the TIFs (supplemental Table S7 and S8). Using the DAVID software version 6.8 (56), the overexpressed TIF proteins are highly associated with type I IFN signaling pathway (FDR = 1.29 × 10⁻⁵; supplemental Table S9). The result consists with the previous finding that the type I INF signaling pathway is enhanced in oral cancer tissues (57). Previously, it has been reported that the treatment of INF-β can activate downstream signaling and had a marginal effect on growth of oral cancer cells. And the use of INF alone or in combination with conventional treatments has been revealed to have both intrinsic (inhibition of cell growth and induction of apoptosis) and extrinsic (inhibition of angiogenesis and antitumor immunity) effects on tumor cells (58). The IFN-related immunity could be used as one of possible antitumor approaches that aims to improve or restore the immune system function to efficiently eliminate tumors. Despite the antitumor activities reported, however, trials of IFN therapies in solid malignancies have met with varying success (59). For antitumor treatment with IFN, better treatment regimens and identification of suitable patients are needed.
In conclusion, paired TIF and NIF from OSCC patients were harvested and analyzed to construct a proteome dataset. To the best of our knowledge, the present dataset is the most comprehensive proteome dataset of the OSCC microenvironment to date. Dataset mining found that the aminoacyl tRNA biosynthesis pathway is enriched in OSCC and that salivary NID1 is a potential biomarker for OSCC. The present data collectively demonstrated the utility of analyzing TIF sample in understanding OSCC microenvironment and identifying salivary biomarkers.
Data Availability
The MS raw data for proteome analysis of interstitial fluids were deposited on the ProteomeXchange Consortium website (http://proteomecentral.proteomexchange.org) via the PRIDE partner repository (60), data set identifier: PXD008654. The information of identified proteins are provided as the supplemental data.
Supplementary Material
Acknowledgments
We sincerely thank Prof. Jau-Song Yu (Director, Molecular Medicine Research Center, Chang Gung University, Taiwan) and Mr. Hao-Yun Chou for the support and suggestions.
Footnotes
* This work was supported by grants to C.C.W. from Ministry of Science and Technology (MOST), Taiwan (MOST 107-2320-B-182-009 and MOST 108-2320-B-182-030-MY3), Chang Gung Memorial Hospital (CGMH), Taiwan (CLRPD190018 and BMRPC77), Research Center for Emerging Viral Infections, Chang Gung University, and Molecular Medicine Research Center, Chang Gung University, from Featured Areas Research Center Program within the Framework of Higher Education Sprout Project by Ministry of Education and Ministry of Science and Technology, Taiwan (MOST 107-3017-F-182-001). We thank Biosignature Research Grant CIRPD3B0013 for supporting bioinformatics and computing resources.
 This article contains supplemental material.
1 The abbreviations used are:
- OSCC
- oral cavity squamous cell carcinoma
- AUC
- area under the ROC curve
- CID
- collision-induced dissociation
- DAVID
- Database for Annotation, Visualization and Integrated Discovery
- FDR
- false discovery rate
- GSEA
- gene set enrichment analysis
- HCD
- higher-energy collision-induced dissociation
- KEGG
- Kyoto Encyclopedia of Genes and Genomes
- NID1
- nidogen-1
- NIF
- interstitial fluids of adjacent noncancerous tissue
- OPMD
- oral potentially malignant disorders
- ROC
- receiver operator characteristic
- SERPINH1
- serpin H1
- TIF
- interstitial fluids of tumor tissue.
REFERENCES
- 1. Miller K. D., Siegel R. L., Lin C. C., Mariotto A. B., Kramer J. L., Rowland J. H., Stein K. D., Alteri R., and Jemal A. (2016) Cancer treatment and survivorship statistics, 2016. CA Cancer J. Clin. 66, 271–289 [DOI] [PubMed] [Google Scholar]
- 2. Siegel R. L., Miller K. D., and Jemal A. (2017) Cancer statistics, 2017. CA Cancer J. Clin. 67, 7–30 [DOI] [PubMed] [Google Scholar]
- 3. Dasgupta S., Dash R., Das S. K., Sarkar D., and Fisher P. B. (2012) Emerging strategies for the early detection and prevention of head and neck squamous cell cancer. J. Cell. Physiol. 227, 467–473 [DOI] [PMC free article] [PubMed] [Google Scholar]
- 4. Downer M. C., Moles D. R., Palmer S., and Speight P. M. (2004) A systematic review of test performance in screening for oral cancer and precancer. Oral Oncol. 40, 264–273 [DOI] [PubMed] [Google Scholar]
- 5. Reibel J. (2003) Prognosis of oral pre-malignant lesions: significance of clinical, histopathological, and molecular biological characteristics. Crit. Rev. Oral Biol. Med. 14, 47–62 [DOI] [PubMed] [Google Scholar]
- 6. Ahirwar D. K., Nasser M. W., Ouseph M. M., Elbaz M., Cuitino M. C., Kladney R. D., Varikuti S., Kaul K., Satoskar A. R., Ramaswamy B., Zhang X., Ostrowski M. C., Leone G., and Ganju R. K. (2018) Fibroblast-derived CXCL12 promotes breast cancer metastasis by facilitating tumor cell intravasation. Oncogene 37, 4428–4442 [DOI] [PMC free article] [PubMed] [Google Scholar]
- 7. Clark A. M., Kumar M. P., Wheeler S. E., Young C. L., Venkataramanan R., Stolz D. B., Griffith L. G., Lauffenburger D. A., and Wells A. (2018) A model of dormant-emergent metastatic breast cancer progression enabling exploration of biomarker signatures. Mol. Cell. Proteomics 17, 619–630 [DOI] [PMC free article] [PubMed] [Google Scholar]
- 8. Hsu C. W., Yu J. S., Peng P. H., Liu S. C., Chang Y. S., Chang K. P., and Wu C. C. (2014) Secretome profiling of primary cells reveals that THBS2 is a salivary biomarker of oral cavity squamous cell carcinoma. J. Proteome Res. 13, 4796–4807 [DOI] [PubMed] [Google Scholar]
- 9. Yu C. J., Chang K. P., Chang Y. J., Hsu C. W., Liang Y., Yu J. S., Chi L. M., Chang Y. S., and Wu C. C. (2011) Identification of guanylate-binding protein 1 as a potential oral cancer marker involved in cell invasion using omics-based analysis. J. Proteome Res. 10, 3778–3788 [DOI] [PubMed] [Google Scholar]
- 10. Wagner M., and Wiig H. (2015) Tumor interstitial fluid formation, characterization, and clinical implications. Front. Oncol. 5, 115. [DOI] [PMC free article] [PubMed] [Google Scholar]
- 11. Haslene-Hox H., Tenstad O., and Wiig H. (2013) Interstitial fluid-a reflection of the tumor cell microenvironment and secretome. Biochim. Biophys. Acta 1834, 2336–2346 [DOI] [PubMed] [Google Scholar]
- 12. Wu C. C., Hsu C. W., Chen C. D., Yu C. J., Chang K. P., Tai D. I., Liu H. P., Su W. H., Chang Y. S., and Yu J. S. (2010) Candidate serological biomarkers for cancer identified from the secretomes of 23 cancer cell lines and the human protein atlas. Mol. Cell. Proteomics 9, 1100–1117 [DOI] [PMC free article] [PubMed] [Google Scholar]
- 13. Celis J. E., Moreira J. M., Cabezon T., Gromov P., Friis E., Rank F., and Gromova I. (2005) Identification of extracellular and intracellular signaling components of the mammary adipose tissue and its interstitial fluid in high risk breast cancer patients: toward dissecting the molecular circuitry of epithelial-adipocyte stromal cell interactions. Mol. Cell. Proteomics 4, 492–522 [DOI] [PubMed] [Google Scholar]
- 14. Gromov P., Gromova I., Bunkenborg J., Cabezon T., Moreira J. M., Timmermans-Wielenga V., Roepstorff P., Rank F., and Celis J. E. (2010) Up-regulated proteins in the fluid bathing the tumour cell microenvironment as potential serological markers for early detection of cancer of the breast. Mol. Oncol. 4, 65–89 [DOI] [PMC free article] [PubMed] [Google Scholar]
- 15. Hsieh S. Y., He J. R., Yu M. C., Lee W. C., Chen T. C., Lo S. J., Bera R., Sung C. M., and Chiu C. T. (2011) Secreted ERBB3 isoforms are serum markers for early hepatoma in patients with chronic hepatitis and cirrhosis. J. Proteome Res. 10, 4715–4724 [DOI] [PubMed] [Google Scholar]
- 16. Teng P. N., Hood B. L., Sun M., Dhir R., and Conrads T. P. (2011) Differential proteomic analysis of renal cell carcinoma tissue interstitial fluid. J. Proteome Res. 10, 1333–1342 [DOI] [PubMed] [Google Scholar]
- 17. Haslene-Hox H., Oveland E., Berg K. C., Kolmannskog O., Woie K., Salvesen H. B., Tenstad O., and Wiig H. (2011) A new method for isolation of interstitial fluid from human solid tumors applied to proteomic analysis of ovarian carcinoma tissue. PLoS ONE 6, e19217. [DOI] [PMC free article] [PubMed] [Google Scholar]
- 18. Hoskins E. R., Hood B. L., Sun M., Krivak T. C., Edwards R. P., and Conrads T. P. (2011) Proteomic analysis of ovarian cancer proximal fluids: validation of elevated peroxiredoxin 1 in patient peripheral circulation. PLoS ONE 6, e25056. [DOI] [PMC free article] [PubMed] [Google Scholar]
- 19. Uleberg K. E., Munk A. C., Brede C., Gudlaugsson E., van Diermen B., Skaland I., Malpica A., Janssen E. A., Hjelle A., and Baak J. P. (2011) Discrimination of grade 2 and 3 cervical intraepithelial neoplasia by means of analysis of water soluble proteins recovered from cervical biopsies. Proteome Sci. 9, 36. [DOI] [PMC free article] [PubMed] [Google Scholar]
- 20. Li S., Wang R., Zhang M., Wang L., and Cheng S. (2013) Proteomic analysis of non-small cell lung cancer tissue interstitial fluids. World J. Surg. Oncol. 11, 173. [DOI] [PMC free article] [PubMed] [Google Scholar]
- 21. de Wit M., Kant H., Piersma S. R., Pham T. V., Mongera S., van Berkel M. P., Boven E., Ponten F., Meijer G. A., Jimenez C. R., and Fijneman R. J. (2014) Colorectal cancer candidate biomarkers identified by tissue secretome proteome profiling. J. Proteomics 99, 26–39 [DOI] [PubMed] [Google Scholar]
- 22. Pham T. V., and Jimenez C. R. (2012) An accurate paired sample test for count data. Bioinformatics 28, i596–i602 [DOI] [PMC free article] [PubMed] [Google Scholar]
- 23. Benjamini Y., Drai D., Elmer G., Kafkafi N., and Golani I. (2001) Controlling the false discovery rate in behavior genetics research. Behav. Brain Res. 125, 279–284 [DOI] [PubMed] [Google Scholar]
- 24. Keller A., Nesvizhskii A. I., Kolker E., and Aebersold R. (2002) Empirical statistical model to estimate the accuracy of peptide identifications made by MS/MS and database search. Anal. Chem. 74, 5383–5392 [DOI] [PubMed] [Google Scholar]
- 25. Nesvizhskii A. I., Keller A., Kolker E., and Aebersold R. (2003) A statistical model for identifying proteins by tandem mass spectrometry. Anal. Chem. 75, 4646–4658 [DOI] [PubMed] [Google Scholar]
- 26. Kuo R. L., Chen C. J., Tam E. H., Huang C. G., Li L. H., Li Z. H., Su P. C., Liu H. P., and Wu C. C. (2018) Interactome analysis of NS1 protein encoded by influenza A H7N9 virus reveals an inhibitory role of NS1 in host mRNA maturation. J. Proteome Res. 17, 1474–1484 [DOI] [PubMed] [Google Scholar]
- 27. Wu C. C., Chu H. W., Hsu C. W., Chang K. P., and Liu H. P. (2015) Saliva proteome profiling reveals potential salivary biomarkers for detection of oral cavity squamous cell carcinoma. Proteomics 15, 3394–3404 [DOI] [PubMed] [Google Scholar]
- 28. Subramanian A., Tamayo P., Mootha V. K., Mukherjee S., Ebert B. L., Gillette M. A., Paulovich A., Pomeroy S. L., Golub T. R., Lander E. S., and Mesirov J. P. (2005) Gene set enrichment analysis: a knowledge-based approach for interpreting genome-wide expression profiles. Proc. Natl. Acad. Sci. U.S.A. 102, 15545–15550 [DOI] [PMC free article] [PubMed] [Google Scholar]
- 29. Subramanian A., Kuehn H., Gould J., Tamayo P., and Mesirov J. P. (2007) GSEA-P: a desktop application for Gene Set Enrichment Analysis. Bioinformatics 23, 3251–3253 [DOI] [PubMed] [Google Scholar]
- 30. Liberzon A., Subramanian A., Pinchback R., Thorvaldsdottir H., Tamayo P., and Mesirov J. P. (2011) Molecular signatures database (MSigDB) 3.0. Bioinformatics 27, 1739–1740 [DOI] [PMC free article] [PubMed] [Google Scholar]
- 31. Liberzon A. (2014) A description of the Molecular Signatures Database (MSigDB) Web site. Methods Mol. Biol. 1150, 153–160 [DOI] [PubMed] [Google Scholar]
- 32. Petersen T. N., Brunak S., von Heijne G., and Nielsen H. (2011) SignalP 4.0: discriminating signal peptides from transmembrane regions. Nat. Methods 8, 785–786 [DOI] [PubMed] [Google Scholar]
- 33. Bendtsen J. D., Jensen L. J., Blom N., Von Heijne G., and Brunak S. (2004) Feature-based prediction of non-classical and leaderless protein secretion. Protein Eng. Des. Sel. 17, 349–356 [DOI] [PubMed] [Google Scholar]
- 34. Keerthikumar S., Chisanga D., Ariyaratne D., Al Saffar H., Anand S., Zhao K., Samuel M., Pathan M., Jois M., Chilamkurti N., Gangoda L., and Mathivanan S. (2016) ExoCarta: A web-based compendium of exosomal cargo. J. Mol. Biol. 428, 688–692 [DOI] [PMC free article] [PubMed] [Google Scholar]
- 35. Krogh A., Larsson B., von Heijne G., and Sonnhammer E. L. (2001) Predicting transmembrane protein topology with a hidden Markov model: application to complete genomes. J. Mol. Biol. 305, 567–580 [DOI] [PubMed] [Google Scholar]
- 36. Farnedi A., Rossi S., Bertani N., Gulli M., Silini E. M., Mucignat M. T., Poli T., Sesenna E., Lanfranco D., Montebugnoli L., Leonardi E., Marchetti C., Cocchi R., Ambrosini-Spaltro A., Foschini M. P., and Perris R. (2015) Proteoglycan-based diversification of disease outcome in head and neck cancer patients identifies NG2/CSPG4 and syndecan-2 as unique relapse and overall survival predicting factors. BMC Cancer 15, 352. [DOI] [PMC free article] [PubMed] [Google Scholar]
- 37. Tanis T., Cincin Z. B., Gokcen-Rohlig B., Bireller E. S., Ulusan M., Tanyel C. R., and Cakmakoglu B. (2014) The role of components of the extracellular matrix and inflammation on oral squamous cell carcinoma metastasis. Arch. Oral Biol. 59, 1155–1163 [DOI] [PubMed] [Google Scholar]
- 38. Choi P., Jordan C. D., Mendez E., Houck J., Yueh B., Farwell D. G., Futran N., and Chen C. (2008) Examination of oral cancer biomarkers by tissue microarray analysis. Arch. Otolaryngol. Head Neck Surg. 134, 539–546 [DOI] [PMC free article] [PubMed] [Google Scholar]
- 39. Lee S. S., Tseng L. H., Li Y. C., Tsai C. H., and Chang Y. C. (2011) Heat shock protein 47 expression in oral squamous cell carcinomas and upregulated by arecoline in human oral epithelial cells. J. Oral Pathol. Med. 40, 390–396 [DOI] [PubMed] [Google Scholar]
- 40. Zhuang Z., Jian P., Longjiang L., Bo H., and Wenlin X. (2010) Oral cancer cells with different potential of lymphatic metastasis displayed distinct biologic behaviors and gene expression profiles. J. Oral Pathol. Med. 39, 168–175 [DOI] [PubMed] [Google Scholar]
- 41. Hanash S. (2003) Disease proteomics. Nature 422, 226–232 [DOI] [PubMed] [Google Scholar]
- 42. Lee L. Y., Chen Y. J., Lu Y. C., Liao C. T., Chen I. H., Chang J. T., Huang Y. C., Chen W. H., Huang C. C., Tsai C. Y., and Cheng A. J. (2015) Fascin is a circulating tumor marker for head and neck cancer as determined by a proteomic analysis of interstitial fluid from the tumor microenvironment. Clin. Chem. Lab. Med. 53, 1631–1641 [DOI] [PubMed] [Google Scholar]
- 43. Stone M. D., Odland R. M., McGowan T., Onsongo G., Tang C., Rhodus N. L., Jagtap P., Bandhakavi S., and Griffin T. J. (2010) Novel in situ collection of tumor interstitial fluid from a head and neck squamous carcinoma reveals a unique proteome with diagnostic potential. Clin. Proteomics 6, 75–82 [DOI] [PMC free article] [PubMed] [Google Scholar]
- 44. Macheret M., and Halazonetis T. D. (2015) DNA replication stress as a hallmark of cancer. Annu. Rev. Pathol. 10, 425–448 [DOI] [PubMed] [Google Scholar]
- 45. Mishra R. (2013) Cell cycle-regulatory cyclins and their deregulation in oral cancer. Oral Oncol. 49, 475–481 [DOI] [PubMed] [Google Scholar]
- 46. Anczukow O., and Krainer A. R. (2016) Splicing-factor alterations in cancers. RNA 22, 1285–1301 [DOI] [PMC free article] [PubMed] [Google Scholar]
- 47. Guo M., and Schimmel P. (2013) Essential nontranslational functions of tRNA synthetases. Nat. Chem. Biol. 9, 145–153 [DOI] [PMC free article] [PubMed] [Google Scholar]
- 48. Kim D., Kwon N. H., and Kim S. (2014) Association of aminoacyl-tRNA synthetases with cancer. Top. Curr. Chem. 344, 207–245 [DOI] [PubMed] [Google Scholar]
- 49. Park S. G., Kim H. J., Min Y. H., Choi E. C., Shin Y. K., Park B. J., Lee S. W., and Kim S. (2005) Human lysyl-tRNA synthetase is secreted to trigger proinflammatory response. Proc. Natl. Acad. Sci. U.S.A. 102, 6356–6361 [DOI] [PMC free article] [PubMed] [Google Scholar]
- 50. Lee C. W., Chang K. P., Chen Y. Y., Liang Y., Hsueh C., Yu J. S., Chang Y. S., and Yu C. J. (2015) Overexpressed tryptophanyl-tRNA synthetase, an angiostatic protein, enhances oral cancer cell invasiveness. Oncotarget 6, 21979–21992 [DOI] [PMC free article] [PubMed] [Google Scholar]
- 51. Li L., Zhang Y., Li N., Feng L., Yao H., Zhang R., Li B., Li X., Han N., Gao Y., Xiao T., and Wu L. (2015) Nidogen-1: a candidate biomarker for ovarian serous cancer. Jpn. J. Clin. Oncol. 45, 176–182 [DOI] [PubMed] [Google Scholar]
- 52. Aumailley M., Battaglia C., Mayer U., Reinhardt D., Nischt R., Timpl R., and Fox J. W. (1993) Nidogen mediates the formation of ternary complexes of basement membrane components. Kidney Int. 43, 7–12 [DOI] [PubMed] [Google Scholar]
- 53. Hopf M., Gohring W., Kohfeldt E., Yamada Y., and Timpl R. (1999) Recombinant domain IV of perlecan binds to nidogens, laminin-nidogen complex, fibronectin, fibulin-2 and heparin. Eur. J. Biochem. 259, 917–925 [DOI] [PubMed] [Google Scholar]
- 54. Willumsen N., Bager C. L., Leeming D. J., Bay-Jensen A. C., and Karsdal M. A. (2017) Nidogen-1 degraded by cathepsin S can be quantified in serum and is associated with non-small cell lung cancer. Neoplasia 19, 271–278 [DOI] [PMC free article] [PubMed] [Google Scholar]
- 55. Pedrola N., Devis L., Llaurado M., Campoy I., Martinez-Garcia E., Garcia M., Muinelo-Romay L., Alonso-Alconada L., Abal M., Alameda F., Mancebo G., Carreras R., Castellvi J., Cabrera S., Gil-Moreno A., Matias-Guiu X., Iovanna J. L., Colas E., Reventos J., and Ruiz A. (2015) Nidogen 1 and Nuclear Protein 1: novel targets of ETV5 transcription factor involved in endometrial cancer invasion. Clin. Exp. Metastasis 32, 467–478 [DOI] [PubMed] [Google Scholar]
- 56. Huang da W, Sherman B. T., and Lempicki R. A. (2009) Bioinformatics enrichment tools: paths toward the comprehensive functional analysis of large gene lists. Nucleic Acids Res. 37, 1–13 [DOI] [PMC free article] [PubMed] [Google Scholar]
- 57. Chi L. M., Lee C. W., Chang K. P., Hao S. P., Lee H. M., Liang Y., Hsueh C., Yu C. J., Lee I. N., Chang Y. J., Lee S. Y., Yeh Y. M., Chang Y. S., Chien K. Y., and Yu J. S. (2009) Enhanced interferon signaling pathway in oral cancer revealed by quantitative proteome analysis of microdissected specimens using 16O/18O labeling and integrated two-dimensional LC-ESI-MALDI tandem MS. Mol. Cell. Proteomics 8, 1453–1474 [DOI] [PMC free article] [PubMed] [Google Scholar]
- 58. Parker B. S., Rautela J., and Hertzog P. J. (2016) Antitumour actions of interferons: implications for cancer therapy. Nat. Rev. Cancer 16, 131–144 [DOI] [PubMed] [Google Scholar]
- 59. Medrano R. F. V., Hunger A., Mendonca S. A., Barbuto J. A. M., and Strauss B. E. (2017) Immunomodulatory and antitumor effects of type I interferons and their application in cancer therapy. Oncotarget 8, 71249–71284 [DOI] [PMC free article] [PubMed] [Google Scholar]
- 60. Vizcaino J. A., Csordas A., Del-Toro N., Dianes J. A., Griss J., Lavidas I., Mayer G., Perez-Riverol Y., Reisinger F., Ternent T., Xu Q. W., Wang R., and Hermjakob H. (2016) 2016 update of the PRIDE database and its related tools. Nucleic Acids Res. 44, 11033. [DOI] [PMC free article] [PubMed] [Google Scholar]
Associated Data
This section collects any data citations, data availability statements, or supplementary materials included in this article.
Supplementary Materials
Data Availability Statement
The MS raw data for proteome analysis of interstitial fluids were deposited on the ProteomeXchange Consortium website (http://proteomecentral.proteomexchange.org) via the PRIDE partner repository (60), data set identifier: PXD008654. The information of identified proteins are provided as the supplemental data.