

Abstract
To determine the extent to which centrally administered corticotropin-releasing factor (CRF) activates neurons that express CRF receptors (CRF-Rs), we followed the kinetics and distribution (relative to those of CRF-Rs) of Fos induction seen in response to intracerebroventricular (icv) injection of the peptide (1–10 μg). CRF provoked widespread Fos expression: its strength was dose-related, it peaked at 2 hr after injection, and it was antagonized in a dose-dependent manner by coinjection of CRF-R antagonists. The activation pattern closely mimicked the distribution of CRF-R1 mRNA, in including widespread Fos induction throughout the cortical mantle, in cell groups involved in sensory information processing, and in the cerebellum and several of its major afferents and targets. Dual labeling revealed extensive correspondence of CRF-stimulated Fos-immunoreactivity (Fos-ir) and CRF-R1 mRNA at these and other loci. Unique sites of CRF-R2 expression were relatively unresponsive to CRF but were more so after icv administration of urocortin (UCN), a new mammalian CRF-related peptide. Both CRF and UCN elicited activational responses in cell groups that are involved in central autonomic control but that express neither CRF-R, including the central amygdaloid and paraventricular hypothalamic nuclei, and brainstem catecholaminergic cell groups. The results support an ability of CRF-related peptides in the ventricular system to access receptor-expressing cells directly but leave open questions as to the basis for the recruitment of central autonomic structures, many of which have been identified as stress-related sites of CRF action.
Keywords: corticotropin-releasing factor, corticotropin-releasing factor receptors, fos, intracerebroventricular injections, neuropeptides, stress, urocortin
The intracerebroventricular (icv) route of administration is used commonly to assess central effects of neuropeptides. The tacit assumption in such studies is that the exogenous agent is capable of accessing cells within the brain parenchyma that bear cognate receptors. To our knowledge, the ability of a peptide given intracerebroventricularly to exert receptor-specific influences has not been tested explicitly. Moreover, substantial evidence is available to suggest that proteinaceous material delivered intracerebroventricularly is apt to exert its dominant effects (1) on tissue proximal to the ventricular lining at or near the site of infusion, (2) at the pial surface of the brain, or (3) peripherally, because the bulk flow of CSF rapidly clears solutes from the ventricular system to the systemic circulation (for review seeFenstermacher and Kaye, 1988; Pardridge, 1992, 1997; Prokai, 1998) (also see Aird, 1984; Crawley et al., 1991; de Lange et al., 1994). Each of these alternatives predicts a limited capacity of peptides delivered via the icv route to access the brain parenchyma.
Corticotropin-releasing factor (CRF) is a neuropeptide expressed in the endocrine hypothalamus that plays a critical role in initiating pituitary–adrenal responses to stress (Vale et al., 1981; Rivier et al., 1982), but CRF also displays a broad extrahypothalamic distribution, aspects of which have been implicated in icv injection studies as mediating autonomic and behavioral components of the stress response (Brown et al., 1982; Sutton et al., 1982) (for review seeFisher, 1993; Koob et al., 1993). This has generally been taken as being indicative of a role for this peptide system in integrating complementary physiological and behavioral response avenues that may be called into play under threatening circumstances. Receptors for CRF are distributed in a manner fully consistent with the neuroendocrine actions of the peptide but are frequently out of register with central CRF-containing projections, particularly at stress-related sites of peptide action (Potter et al., 1994; Chalmers et al., 1995). Partly because of such disparities, some have embraced the concept of “parasynaptic” or “volume” transmission as an important means of intercellular information transfer in brain, where ligands may act at receptors distant from release points and be conveyed to them via the extracellular fluid and/or the CSF (Herkenham, 1987; Agnati et al., 1995). Findings that CRF is present in CSF at concentrations typically exceeding those in plasma (Suda et al., 1983) and is actively cleared from it (Oldfield et al., 1985; Martins et al., 1996, 1997) may be taken as being consistent with such a view, as are such outcomes as the failure to localize a discrete parenchymal site at which the peptide elicits sympathomimetic effects with greater sensitivity than it does when given intracerebroventricularly (Brown, 1986).
The recent cloning and characterization of two distinct CRF receptors [CRF-R1: Chang et al. (1993), Chen et al. (1993), Vita et al. (1993); CRF-R2: Lovenberg et al. (1995b), Perrin et al. (1995)], and of urocortin (UCN), a new mammalian member of the CRF peptide family hypothesized to be a preferred ligand for CRF-R2 (Vaughan et al., 1995), permits analysis of the specificity with which central CRF-related peptides target neurons bearing CRF-Rs. We have provided evidence that icv UCN provokes activational responses, as assessed by induction of the immediate-early gene product, Fos, in several sites enriched in CRF-R2 expression, as well as in others expressing CRF-R1 or neither subtype (Vaughan et al., 1995). Here we report the results of studies in which a similar approach has been used to follow the kinetics and distribution of Fos induction seen in response to icv CRF infusion.
Portions of the results have been published previously in abstract form (Bittencourt et al., 1996).
MATERIALS AND METHODS
Animals. Adult male Sprague Dawley rats weighing 250–350 gm were used in this study and housed two per cage in a vivarium maintained on a 12 hr light/dark cycle (lights on at 6 A.M.). The animals had free access to food and water at all times and were allowed a minimum of 7 d to adapt to housing conditions before any manipulation. All animals were stereotaxically implanted under ketamine/xylazine/acepromazine anesthesia (25:5:1 mg/kg, s.c.) with a 26 ga guide cannula that terminated in a lateral ventricle at least 7 d before experimentation. During the recovery period, the rats were handled twice a day and mock-injected to acclimate them to the injection procedure. On the day of testing, rats were injected between 11 A.M. and 12 noon; this involved inserting a 33 ga injector through the guide, allowing the animals to remain undisturbed for 2 hr to minimize any effect of handling, and then remotely administering peptides and/or antagonists, all dissolved in 10 μl of a saline vehicle, over ∼1 min. The animals then remained in their home cages until the time they were killed. Synthetic rat CRF and UCN used for injection were generously provided by Dr. Jean Rivier (Salk Institute). All procedures were approved by the Institutional Animal Care and Use Committee of the Salk Institute.
Procedures. To follow the time course of Fos induction, rats received a single icv injection of CRF (1 μg in 10 μl saline) or vehicle and were anesthetized and perfused 0.5, 1, 2, 3, or 4 hr later (n = 4 per group).
To assess the dose-relatedness of Fos induction patterns, groups of animals received a single icv injection of 0.5, 1, 2, or 10 μg CRF in 10 μl saline, or of vehicle alone, and were perfused 2 hr later, the time point at which maximal Fos-immunoreactivity (Fos-ir) expression was observed. For purposes of comparison, additional animals were injected with 1 or 10 μg synthetic ovine CRF9–33, a CRF fragment that is bound with very low affinity by known CRF-binding moieties (Sutton et al., 1995), or with synthetic UCN, a CRF family member hypothesized to interact preferentially with type 2 CRF receptors (Vaughan et al., 1995), and perfused at the same 2 hr time point (n = 3–6 per group).
The receptor specificity of Fos induction patterns was evaluated in groups of animals that received a single icv injection of 1 μg of CRF alone, or mixed with 1, 10, or 100 μg of the nonselective CRF receptor antagonist [d-Phe12, Nle21,38] rat/human CRF12–41 (Rivier et al., 1993; Perrin et al., 1995) and were perfused 2 hr later. Controls included separate groups injected with saline or antagonist alone (n = 4–6 per group).
The peptide specificity of Fos induction patterns was evaluated in groups of animals injected with 1 μg synthetic CRF or UCN, or with 10 μl of the saline vehicle (n = 5 per group). Additional series of sections from these animals were prepared for hybridization histochemical demonstration of CRF-R1 or CRF-R2 mRNA, either alone or with concurrent demonstration of peptide-stimulated Fos-ir (see below).
Tissue processing and immunohistochemistry. At the end of their respective treatment periods, rats were anesthetized with chloral hydrate (35 mg/kg, i.p.) and perfused with 50–75 ml of saline, followed by 550–700 ml of 4% paraformaldehyde in 0.1 mborate buffer at 4°C. The brains were post-fixed for 4 hr in the same fixative at 4°C and then transferred to a solution of 0.05m potassium-PBS with 10% sucrose added at 4°C for 12–14 hr. Regularly spaced series (5 × 1-in-5) of 30-μm-thick frozen sections were cut in the frontal plane, saved, and collected in ethylene glycol-based cryoprotectant solution in which they were stored at −20°C until tissue from all animals to be compared directly had been collected, so as to allow immunolabeling to be performed under comparable conditions, using common reagents and processing conditions. Sections were stained using conventional avidin–biotin immunoperoxidase methods to localize a primary antiserum raised against a synthetic N-terminal fragment of human Fos (Santa Cruz Biotechnology) and used at a 1:10,000 dilution. Adjoining series of sections were stained with thionin for reference purposes. Tests for specificity of immunolabeling involved substitution of nonimmune serum for the primary antiserum or use of primary antiserum that had been incubated overnight at 4°C with 50 μm of the synthetic immunogen. Neither procedure gave rise to any suggestion of specific labeling in material from control or experimental animals.
In situ hybridization. To allow direct comparison of Fos-induction patterns with CRF receptor distributions, material from both control (saline-injected) and CRF-treated (1 μg) animals was prepared for hybridization histochemical demonstration of CRF-R1 and CRF-R2 mRNAs. This was performed using or33P- or35S-labeled antisense cRNA probes. Techniques for probe synthesis, hybridization, and autoradiographic localization of mRNA signal were adapted from Simmons et al. (1989). Briefly, tissue processed as above was mounted onto poly-l-lysine-coated slides and then digested with 10 μg/ml of proteinase K for 30 min at 37°C. For CRF-R1 mRNA localization, radiolabeled antisense and sense (control) cRNA copies were synthesized from a full-length rat (1.3 kb) CRF-R1 cDNA (Potter et al., 1994) subcloned into a pBluescript SK transcription vector (Stratagene, La Jolla, CA). Several probes against rat or mouse CRF-R2 sequences were screened. The best results were obtained using a probe encompassing 0.9 kb of the coding sequence and 0.1 kb of 5′ untranslated region of mouse CRF-R2β, which was adjusted to an average fragment length of ∼200 bases by limited alkaline hydrolysis (Cox et al., 1984) before application to tissue sections. Use of this probe enabled both CRF-R2 RNA processing variants (Lovenberg et al., 1995a) to be detected.
The probes were used at concentrations of ∼107 cpm/ml and applied to sections overnight at 56–58°C in a solution containing 50% formamide, 0.3m NaCl, 10 mm Tris, pH 8.0, 1 mmEDTA, 0.05% tRNA, 10 mm dithiothreitol, 1× Denhardt's solution, and 10% dextran sulfate, after which they were treated with 20 μg/ml of ribonuclease A for 30 min at 37°C and washed in 15 mm NaCl/1.5 mm sodium citrate at 55–60°C. Sections were then dehydrated and exposed to x-ray films for 1–2 d. Sections were defatted in xylene, rinsed in absolute ethanol, air-dried, coated with Kodak NTB-2 liquid autoradiographic emulsion, and exposed at 4°C in the dark and desiccated, typically for 3–4 weeks. They were then developed with Kodak D-19 for 3.5 min at 14°C, rinsed briefly in distilled water, fixed with film strength Kodak rapid fixer for 2 min at 14°C, rinsed again, and counterstained with thionin for reference purposes.
Analysis. The relative strength of expression of Fos-ir was evaluated using a semiquantitative rating scale by two independent observers without knowledge of the treatment status of the animals. A similar approach was used to assess the relative strength of CRF-R1 and CRF-R2 mRNA signals. Interobserver reliability was >95%. To provide an independent assessment of the validity of these ratings, counts of the number of Fos-ir neurons as a function of experimental status were generated for select cell groups in certain experiments. These were performed by counting all Fos-ir nuclei in a complete series of sections through the structure(s) of interest, as defined in adjoining series stained for Nissl material, and extrapolating estimated counts using the method of Abercrombie (1946).
Combined immunohistochemistry and hybridization histochemistry. To assess the extent to which CRF-induced Fos-ir expression was localized to cells expressing CRF receptors, series of sections from animals injected with 1 μg CRF were prepared for avidin–biotin immunoperoxidase localization of Fos-ir followed by isotopic hybridization histochemical detection of CRF-R1 or CRF-R2 receptor mRNA. This involved the following modifications of the immunolabeling procedure to allow it to be wedded effectively with hybridization histochemistry: (1) pretreatment of sections with hydrogen peroxide and sodium borohydride were omitted, (2) incubations in primary antiserum were performed in buffer containing 3% BSA and 2.5 mg/ml heparin sulfate in place of normal blocking serum, and (3) nickel enhancement steps were omitted (Watts and Swanson, 1989; Chan et al., 1993).
RESULTS
Kinetics of CRF-induced Fos expression
Fos-ir expression in control rats that received icv injections of saline was low or undetectable in most regions of the brain (Fig.1). The few areas in which substantial immunolabeling was observed have been identified previously as sites of constitutive Fos protein expression in nonmanipulated rats (Herdegen et al., 1995; Li and Sawchenko, 1998). Treatment with 1 μg CRF, the dose most commonly used in icv injection studies, provoked widespread Fos induction in brain that followed a time course similar to that described in many acute challenge paradigms (Chan et al., 1993). Thus, CRF-stimulated Fos-ir was detectable at 0.5 hr after administration, substantial at 1 hr, maximal at 2 hr, and diminished thereafter, such that by 4 hr after injection, neither the distribution nor the strength of Fos expression differed discernibly from that seen in controls. We encountered no region of the brain in which the activation pattern clearly and consistently departed from this basic temporal progression.
Fig. 1.
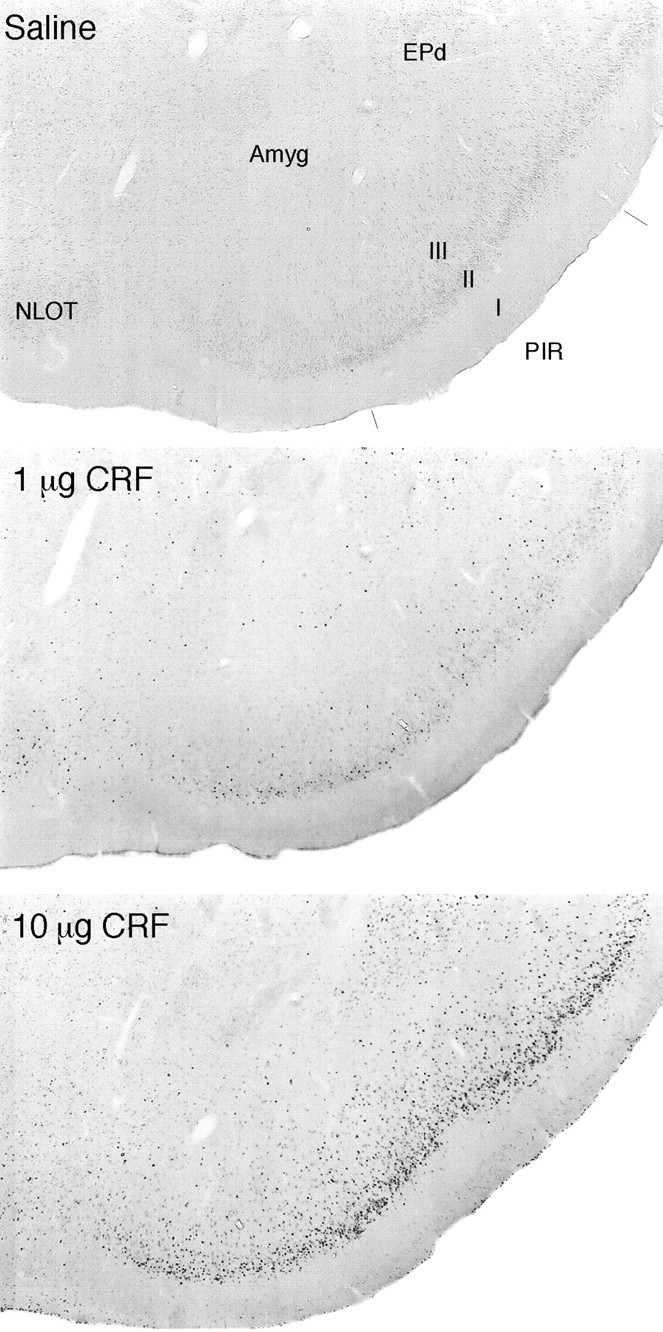
Dose-related Fos-ir induction in response to central CRF. Bright-field photomicrographs are of immunoperoxidase preparations to show Fos-ir expression in the piriform cortex (PIR) and adjoining regions of saline-treated controls, and rats given icv injections of 1 or 10 μg CRF 2 hr before they were killed. Relative to low levels of expression seen in vehicle-treated animals, 1 μg CRF provokes Fos-ir in piriform cortex, the endopiriform nucleus (EPd), and the nucleus of the lateral olfactory tract (NLOT); substantially more robust responses of similar topography are seen in rats receiving 10 μg doses of peptide. Amyg, Amygdala. All photomicrographs 30× magnification.
The distribution and apparent strength of Fos induction seen in response to 0.5 or 2 μg CRF were quite similar to that observed after 1 μg icv injections, although a general tendency for higher doses to elicit more robust responses was apparent over this range. Treatment with 10 μg consistently provoked a decidedly more robust Fos-ir response, although the overall pattern of induction was preserved (Fig.1), except for the fact that higher doses gave rise to labeling in non-neuronal cells in the ependyma and meninges, as well as diffusely in tissue adjoining the ventricular system (see below).
Coadministration of the non-selective CRF receptor antagonist [D-Phe12, Nle21,38] r/hCRF12–41 (Rivier et al., 1993; Perrin et al., 1995) interfered in a dose-related manner with Fos expression seen in response to treatment with 1 μg CRF (Fig.2, Table1). Although 1 μg of antagonist did not substantially or consistently affect CRF-induced Fos-ir, the response was markedly attenuated in rats that received 10-fold, and essentially eliminated in ones that received 100-fold, excesses of the antagonist. Again, we noted no site of Fos induction in brain in which the response to combined CRF and antagonist treatment varied from this basic pattern. Treatment with higher doses (≥10 μg) of the antagonist alone did not elicit activational responses in most of the brain parenchyma but did stimulate Fos induction in the ependyma and diffusely in immediately adjoining periventricular tissue (Fig.3) as well as in the leptomeninges. Ependymal labeling was most pronounced near the site of the icv injection, although meningeal labeling extended bilaterally around the entire circumference of the brain, particularly in animals treated with the higher dose of antagonist; frank labeling of the ependymal and pial surfaces was frequently observed at the caudalmost limit of our tissue samples, at the spinal medullary junction. Occasionally, small foci of Fos-ir induction were observed somewhat deeper in the brain parenchyma near sites of ependymal/periventricular expression, but this was not observed in all experiments and displayed no consistent topography when it was. As noted above, such ependymal/periventricular and meningeal labeling was seen reliably in response to 10 μg CRF or antagonist; 1 μg doses yielded only sporadic and relatively low-level ependymal/periventricular labeling and somewhat more consistent but still relatively weak labeling at and near the pial surface. A similar dose-related pattern of responses was seen after injection of 1 or 10 μg of synthetic ovine CRF9–33, a fragment that is bound with very low affinity by each of the known rat CRF-binding moieties (Sutton et al., 1995); the complete absence of labeling in nonperiventricular portions of the brain parenchyma after injection of this peptide supports the view that Fos induction at the ependymal and pial surfaces is a primarily concentration-dependent effect.
Fig. 2.
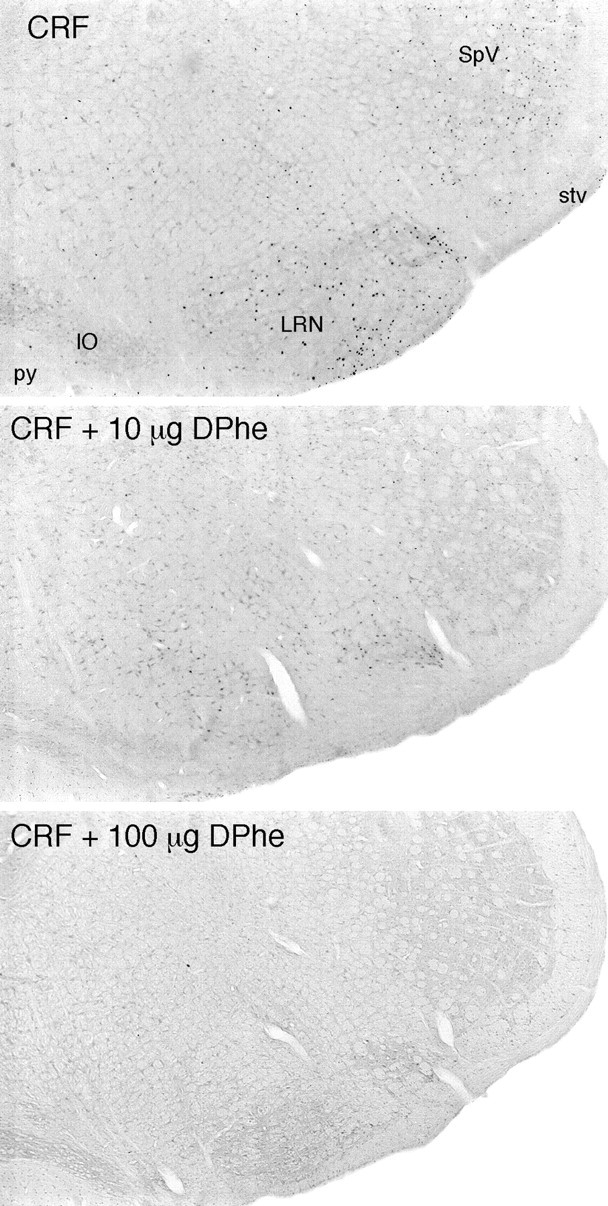
Coinjection of a CRF receptor antagonist interferes with central CRF-induced Fos expression in rat brain. Bright-field photomicrographs are of immunoperoxidase preparations to show Fos-ir expression in the ventrolateral medulla of rats that received icv injections of 1 μg CRF alone (top) or with 10 μg (middle) or 100 μg [DPhe12, Nle21,38] r/hCRF12–41. Major sites of peptide-stimulated Fos induction in the lateral reticular (LRN) and spinal trigeminal (SpV) nuclei are markedly diminished in animals coinjected with 10 μg, and essentially abolished in rats treated with 100 μg, of the antagonist. All sections are from animals killed at 2 hr after icv injection, the time of maximal Fos induction in most brain regions. IO, Inferior olivary complex; py, pyramidal tract;stv, spinal tract of the trigeminal nerve. All photomicrographs 30× magnification.
Table 1.
Estimated numbera of Fos-ir neurons in select rat brain cell groups after icv CRF and/or antagonist treatment
| Structure | Treatment | |||
|---|---|---|---|---|
| Vehicle | 1 μg CRF1-b | 1 μg CRF + 10 μg d-Phec | 1 μg CRF + 100 μgd-Phec | |
| Lateral septal nucleus | 84 ± 16 | 1796 ± 267 | 672 ± 78*,† | 262 ± 28*,† |
| Medial septal nucleus | 35 ± 14 | 1424 ± 138 | 548 ± 88*,† | 80 ± 12*,ns |
| Central nucleus of the amygdala | 71 ± 15 | 1664 ± 339 | 608 ± 84*,† | 143 ± 17*,† |
| Medial nucleus of the amygdala | 25 ± 6 | 608 ± 80 | 344 ± 58*,† | 48 ± 12*,ns |
| Basolateral nucleus of the amygdala | 9 ± 5 | 992 ± 136 | 432 ± 104*,† | 29 ± 8*,ns |
| Nucleus of the solitary tract | 44 ± 11 | 1752 ± 220 | 343 ± 48*,† | 75 ± 20*,ns |
| Dorsal column nuclei | 14 ± 2 | 900 ± 130 | 432 ± 76*,† | 5 ± 4*,ns |
Values are mean (±SEM) corrected (Abercrombie, 1946) counts of the number of Fos-ir neurons in complete series of sections through the indicated structures. Rats were killed 2 hr after icv injection of 10 μl saline (vehicle; n = 4), 1 μg CRF in 10 μl saline (n = 5) alone, or in combination with 10 μg (n = 6) or 100 μg (n = 4) of the CRF receptor antagonist [D-Phe12, Nle21,38] rat CRF12–41. To minimize presumed nonspecific influences near the site of infusion, counts from the lateral septal nucleus were taken from the side contralateral to the injection.
All values obtained in response to CRF treatment alone differ from respective vehicle-treated controls;p < 0.001.
Counts from antagonist-treated animals are compared with values from rats treated with CRF (left symbol) or vehicle (right symbol).
*Differs significantly from CRF-stimulated value, p < 0.05; nsp > 0.05.
Differs significantly from vehicle-treated control value,p < 0.05; nsp > 0.05.
Fig. 3.
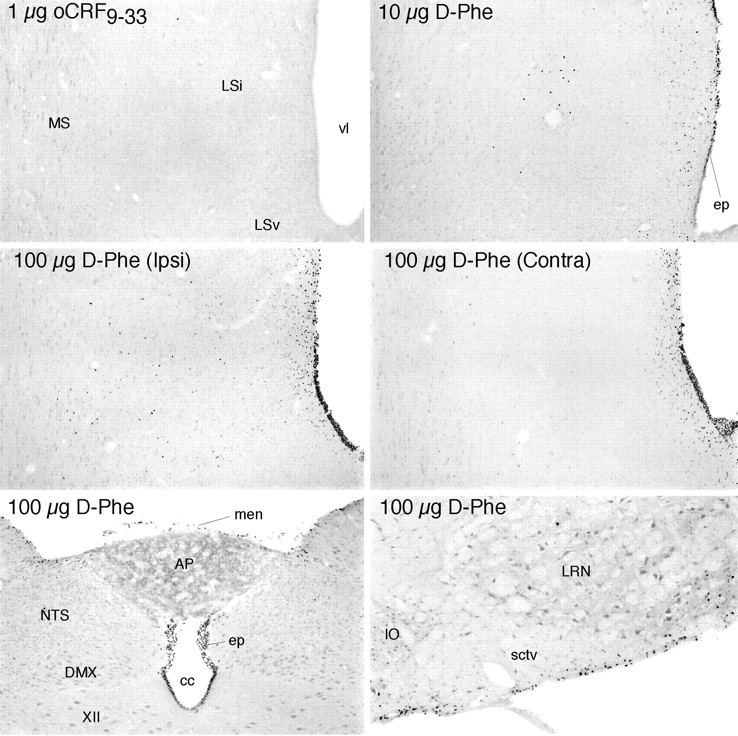
Effects of icv injections at the brain-fluid interfaces. Bright-field photomicrographs show Fos-ir expression in the septal region, near the site of icv injection (top four panels) and caudal brainstem (bottom) in rats killed 2 hr after treatment. Injection of 1 μg oCRF9–33, a peptide fragment that is bound with low affinity by each of the known CRF binding moieties, provokes little evidence of Fos induction even near the site of infusion (top). This contrasts with the effects of 1 μg injections of CRF or UCN (Fig. 7). Injection of 10 μg of the CRF receptor antagonist [D-Phe12, Nle21,38] rat/human CRF12–41(D-Phe) evokes activational responses primarily in the ependymal lining of the ventricular system (ep) near the site of infusion and in immediately adjoining cells but only sporadically in deeper aspects of the brain parenchyma. High doses of the antagonist alone (100 μg D-Phe;middle) produce more robust labeling of the ependyma and periventricular regions, although deep parenchymal labeling is prominent near the site of infusion on the ipsilateral (Ipsi) but not the contralateral (Contra) side of the brain. High doses of the antagonist also result in extensive labeling of the ependyma throughout the ventricular system, as evidenced by labeling seen near the medullary spinal transition area (bottom) and additionally in the meninges (men) and in cells at and just deep to the pial surface of the brain (bottom). Note that labeling at the ependymal and pial surfaces spreads substantially to include cells in deeper regions of the parenchyma only near the site of icv injection.XII, Hypoglossal nucleus; AP, area postrema; cc, central canal; DMX, dorsal motor nucleus; IO, inferior olive;LSv, lateral septal nucleus ventral; Lsi, lateral septal nucleus intermediate; LRN, lateral reticular nucleus; MS, medial septal nucleus;NTS, nucleus of the solitary tract; sctv, spinocerebellar tract; vl, lateral ventricle. All photomicrographs 75× magnification, except bottom right(100×).
Distribution of CRF-induced Fos expression
Table 2 summarizes the relative strength of Fos induction seen in brain regions of rats killed 2 hr after icv injection of 1 μg CRF, in relation to patterns of CRF-R1 and CRF-R2 mRNA expression in these same animals (Figs.4, 5). In general, Fos-ir expression in these experiments was bilaterally symmetrical and displayed no consistent tendency to vary in intensity as a function of distance from the site of infusion or from the ventricular or pial surfaces. Instead, the most obvious characteristic that linked most of the major sites of Fos induction together was the extent to which their relative strength and distribution approximated those of CRF-R1 mRNA expression.
Table 2.
Strengtha and distribution of central CRF- or UCN-induced Fos expression relative to those of type 1 and type 2 CRF receptor mRNAs
| CRF-R1 mRNA | Fos-icv CRF | CRF-R2 mRNA | Fos-icv UCN | |
|---|---|---|---|---|
| Forebrain | ||||
| Isocortex | ||||
| II–III | ++ | +++ | − | + |
| IV | +++ | ++++ | − | ++ |
| V | + | + | − | ++ |
| VI | ++ | +++ | + | ++ |
| Claustrum | ++ | ++ | + | + |
| Olfactory regions | ||||
| Main bulb | ||||
| Periglomerular layer | ++ | ++ | − | + |
| Mitral layer | +++ | ++ | − | + |
| Exterior plexiform layer | ++ | ++ | − | + |
| Granule cell layer | +++ | +++ | ++ | ++ |
| Anterior olfactory nucleus | ++ | ++ | + | + |
| Olfactory tubercle | ++ | +++ | + | + |
| Piriform cortex | +++ | +++ | + | ++ |
| Hippocampal formation | ||||
| Entorhinal area | ++ | ++ | ++ | ++ |
| Subiculum | ++ | + | + | ++ |
| Ammon's Horn | ++ | + | + | +/− |
| Dentate gyrus | ++ | + | + | + |
| Amygdala | ||||
| Medial nucleus | ++ | ++ | ++ | ++ |
| Cortical nucleus (anterior/posterior) | ++/+ | ++/+ | ++/+++ | ++/+ |
| Central nucleus (lateral/medial) | −/+ | +++/+ | −/− | +++/+ |
| Lateral nucleus | + | + | − | − |
| Basolateral nucleus | +++ | ++ | − | + |
| Septum | ||||
| Lateral nucleus | + | ++ | ++++ | ++++ |
| Medial nucleus/nucleus diagonal band | +++ | +++ | + | ++ |
| Bed nucleus stria terminalis | ++ | ++ | ++ | ++ |
| Anteromedial part | + | + | − | + |
| Anterolateral part | ++ | ++ | − | + |
| Oval nucleus | − | ++ | − | +++ |
| Posterior part | ++ | ++ | +++ | ++ |
| Basal ganglia | ||||
| Caudoputamen | +++ | ++ | − | + |
| Globus pallidus | ++ | + | + | |
| Substantia innominata | ++ | + | − | − |
| Magnocellular preoptic nucleus | +++ | ++ | + | + |
| Subthalamic nucleus | +++ | +++ | − | + |
| Substantia nigra | ||||
| Pars compacta | +++ | ++ | − | + |
| Pars reticulata | ++ | ++ | − | + |
| Ventral tegmental area | ++ | + | − | + |
| Thalamus | ||||
| Anterior group | + | + | − | + |
| Midline group | ||||
| Paraventricular nucleus | + | ++ | − | ++ |
| Nucleus Reuniens | ++ | ++ | − | ++ |
| Intralaminar group | + | ++ | ++ | |
| Ventral group | ++ | ++ | − | + |
| Posterior complex | ++ | ++ | − | − |
| Reticular nucleus | − | − | − | − |
| Medial geniculate nucleus (medial/lateral) | ++/+ | ++/++ | −/− | +/− |
| Lateral geniculate nucleus (dorsal/ventral) | ++/+++ | ++/+++ | −/− | −/++ |
| Hypothalamus | ||||
| Periventricular zone | ||||
| Suprachiasmatic nucleus | + | + | − | − |
| Paraventricular nucleus | ||||
| Autonomic part | + | + | − | + |
| Parvicellular part | − | ++ | − | +++ |
| Magnocellular part | − | − | + | ++ |
| Anterior periventricular nucleus | + | + | − | − |
| Arcuate nucleus | ++ | ++ | + | + |
| Posterior periventricular nucleus | + | + | + | + |
| Supraoptic nucleus | − | − | + | ++ |
| Medial zone | ||||
| Medial preoptic nucleus | ++ | ++ | ++ | ++ |
| Dorsomedial nucleus | +++ | +++ | + | ++ |
| Ventromedial nucleus | − | + | +++ | ++ |
| Premammillary nucleus | ++ | ++ | + | + |
| Supramammillary nucleus | ++ | + | − | − |
| Lateral zone | ||||
| Lateral preoptic area | + | ++ | − | + |
| Lateral area | + | ++ | + | + |
| Posterior area | +++ | +++ | − | ++ |
| Brainstem | ||||
| Sensory | ||||
| Visual | ||||
| Superior colliculus | ++ | +++ | − | + |
| Olivary pretectal nucleus | ++ | + | − | + |
| Medial pretectal area | ++ | ++ | + | ++ |
| Somatosensory | ||||
| Mesencephalic nucleus V | +++ | + | + | + |
| Principal sensory nucleus V | +++ | +++ | − | + |
| Spinal nucleus V | +++ | +++ | − | + |
| External cuneate nucleus | ++++ | +++ | − | ++ |
| Auditory | ||||
| Cochlear nuclei | ++ | ++ | − | + |
| Lateral superior olive | ++ | + | − | − |
| Nucleus of the lateral lemniscus | +++ | ++ | − | + |
| Inferior colliculus | +++ | +++ | − | ++ |
| Vestibular | ++ | ++ | ||
| Medial | ++ | ++ | − | + |
| Lateral | ++ | ++ | − | + |
| Spinal | +++ | ++ | − | ++ |
| Visceral | ||||
| Nucleus of the solitary tract | + | ++ | ++ | +++ |
| Parabrachial nucleus (lateral medial) | +++/++ | +++/+ | −/− | +++/+ |
| Motor | ||||
| Oculomotor (III) | + | + | − | − |
| Facial nucleus (VII) | ++ | ++ | − | + |
| Nucleus ambiguous (X) | ++ | + | − | + |
| Reticular core | ||||
| Periaqueductal gray | + | ++ | − | ++ |
| Ventral tegmental nucleus | ++ | ++ | − | ++ |
| Nucleus of the incertus | ++++ | ++++ | − | ++++ |
| Laterodorsal tegmental nucleus | ++++ | +++ | − | ++ |
| Locus coeruleus | − | +++ | − | ++++ |
| Raphé | ||||
| Dorsal raphé | + | +++ | +++ | +++ |
| Median raphé | ++ | + | ++ | ++ |
| Nucleus of the raphémagnus | ++ | ++ | − | + |
| Nucleus of the raphépallidus | + | ++ | − | ++ |
| Nucleus of the raphéobscurus | ++ | + | − | + |
| Interpedunuclar nucleus | ++ | ++ | ++ | ++ |
| Reticular formation | ||||
| Pedunculopontine nucleus | ++++ | ++ | − | ++ |
| Gigantocellular reticular field | ++ | + | − | +++ |
| Ventrolateral medulla (A1/C1) | −/+ | ++/++ | −/− | ++/++ |
| Pre- and post-cerebellar | ||||
| Pontine gray | ++++ | +++ | − | ++ |
| Lateral reticular nucleus | ++++ | +++ | − | ++ |
| Red nucleus | +++ | ++ | − | − |
| Tegmental reticular nucleus | ++ | ++ | − | ++ |
| Inferior olive | ++ | ++ | − | + |
| Cerebellum | ||||
| Deep nuclei | +++ | ++ | − | + |
| Cortex | ||||
| Purkinje layer | ++ | + | − | + |
| Molecular layer | ++ | ++ | − | + |
| Granule layer | +++ | +++ | − | ++ |
The relative strength of the expression of each marker was rated by two independent observers without knowledge of the treatment status of the animals. Ratings reflect primarily the density of positively labeled cells, with (−) representing a complete lack of above-control levels of staining, (+) isolated positively labeled cells, and (++++) labeling in a substantial majority of all cells in a given cell group or field. Ratings separated by a slash (/) indicate those applicable to subregions of the particular cell group, as indicated at the left. Ratings of mRNA expression were adjusted secondarily on the basis of the strength of hybridization signal, but never by more than a single rating point. Ratings were based on analysis of complete series of sections through the brains of five rats that received icv injections of 1 μg CRF or UCN 2 hr before they were killed.
Fig. 4.
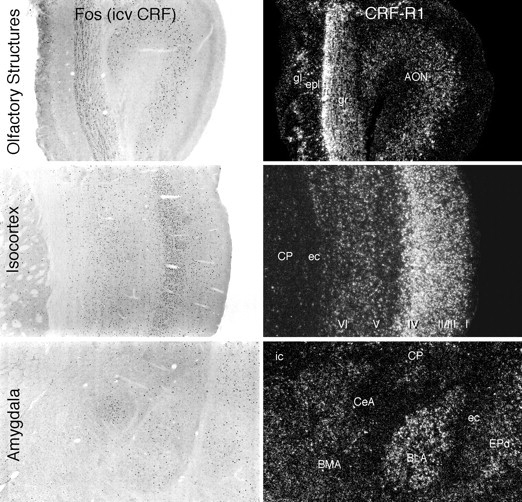
Relationship of forebrain sites of CRF-induced Fos-ir to loci of CRF-R1 mRNA expression. Patterns of Fos induction in various brain regions seen at 2 hr after icv injection of 1 μg CRF (bright-field photomicrographs, left) in relation to the distribution of CRF-R1 mRNA expression in the same regions (dark-field photomicrographs, right). At each level, the correspondence between the distribution of the two markers is striking and extends to the laminar and/or subnuclear levels. All major sites of Fos induction shown here express CRF-R1, except for the lateral part of the central nucleus of the amygdala (CeA), which expresses neither CRF receptor. I–VI, Isocortical layers; AON, anterior olfactory nucleus;BLA, basolateral nucleus of the amygdala;BMA, basomedial nucleus of the amygdala;CP, caudoputamen; ec, external capsule;epl, external plexiform layer (olfactory bulb);EPd, dorsal endopiriform nucleus; gl, glomerular layer (olfactory bulb); gr, granule cell layer (olfactory bulb); ic, internal capsule;m, mitral cell layer (olfactory bulb). All photomicrographs 30× magnification.
Fig. 5.
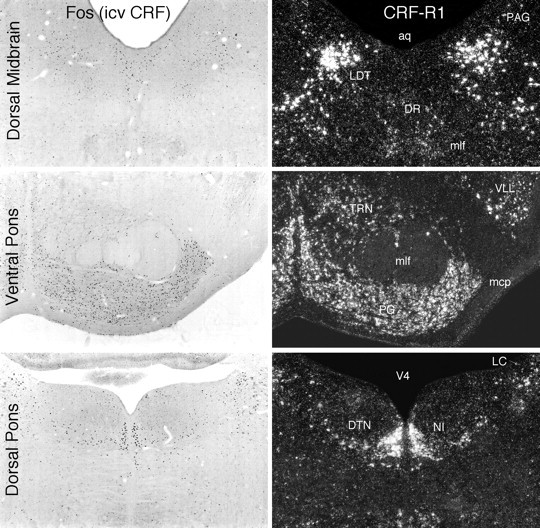
Some brainstem sites of CRF-induced Fos-ir in relation to loci of CRF-R1 mRNA expression. Shown are patterns of Fos induction in brainstem regions seen at 2 hr after icv injection of 1 μg CRF (bright-field, left) and patterns of CRF-R1 mRNA expression in the same regions (dark-field, right). Again, the distributions of the two markers are highly congruent, and most major areas in which Fos induction was detected also express CRF-R1, except for the locus coeruleus (LC), which expresses neither CRF-R, and the dorsal raphé nucleus (DR), aspects of which express CRF-R1 at low levels but CRF-R2 more robustly. aq, Cerebral aqueduct;DTN, dorsal tegmental nucleus; LDT, laterodorsal tegmental nucleus; mcp, middle cerebellar peduncle; mlf, medial longitudinal fasciculus;NI, nucleus incertus; PAG, periaqueductal gray; PG, pontine gray; TRN, tegmental reticular nucleus; V4, fourth ventricle;VLL, ventral nucleus of the lateral lemniscus. All photomicrographs 30× magnification.
CRF-induced Fos expression was seen throughout the olfactory system, from the olfactory bulb to the piriform cortex, for example, with regional emphases that closely mirrored the rich R1 mRNA distribution, save that the intensity of expression in the mitral cell layer of the bulb was less than would be predicted by the relative strength of receptor expression (Fig. 4). Fos induction was seen pervasively throughout the isocortical mantle with the same laminar emphases exhibited in the pattern of CRF-R1 mRNA, being most dense in layer 4, somewhat less so in layers 2/3 and 6, and relatively sparse in layer 5. Similarly impressive was the degree of Fos/CRF-R1 correspondence seen in subcortical cell groups associated with the processing of somatosensory (dorsal column, pedunculopontine, and laterodorsal tegmental nuclei, as well as the principal sensory and spinal trigeminal nuclei), visual (lateral geniculate, superior colliculus, and pretectal nuclei), and vestibular sensory information (Fig. 5). Although a number of structures along the central auditory pathway (cochlear nuclei, medial geniculate, and inferior colliculus) displayed congruent distributions of the two markers, CRF-induced Fos-ir in the superior olivary nucleus and the nuclei of the lateral lemniscus did not approximate the strong receptor expression observed in these loci. Fos induction was also seen to parallel the strong expression of CRF-R1 transcripts in such major precerebellar and postcerebellar structures as the red, lateral reticular, external cuneate, and basilar pontine nuclei, as well as in the cerebellar cortex itself. Correlated expression of CRF-R1 mRNA and CRF-induced Fos-ir was also apparent among most components of the extrapyramidal motor system and the limbic forebrain/hypothalamus, with relatively minor variations in emphasis.
CRF-stimulated Fos induction was generally muted or lacking in areas in which CRF-R2 expression predominates, such as in the lateral septal (Fig. 6) and ventromedial hypothalamic nuclei. One potential exception to this was seen in the dorsal raphé nucleus, a major seat of CRF-R2 expression but only a minor one of the R1 subtype, and where a rather robust activational response was observed whose distribution more closely approximated that of R2-expressing elements (Fig. 5).
Fig. 6.

Many neurons that are sensitive to icv CRF injection express CRF-R1 mRNA. Bright-field photomicrographs of combined immunohistochemical and hybridization histochemical preparations show localization of CRF-stimulated Fos-ir (brown nuclei) and CRF-R1 mRNA (blacksilver grains). Overlapping distributions are seen in field CA3 of the hippocampal formation, basolateral amygdaloid (BLA), medial septal (MS), and lateral reticular (LRN) nuclei, among many other regions. Examples of doubly labeled cells are indicated (arrows). All photomicrographs 300× magnification.
The most prominent exceptions to the general correspondence described above were the moderate to strong Fos-ir responses observed consistently among members of a group of interconnected structures known to be pivotally involved in central autonomic and neuroendocrine regulation (Sawchenko, 1983; Saper, 1995), several of which have been identified as sites of CRF action in eliciting stress-related responses. This group includes the oval subnucleus of the bed nucleus of the stria terminalis (Ju and Swanson, 1989), the parvicellular division of the paraventricular nucleus of the hypothalamus, the lateral part of the central nucleus of the amygdala (Fig. 4), the lateral parabrachial nucleus, the A1 and C1 regions of the ventrolateral medulla, and the medial division of the nucleus of the solitary tract (NTS). Of these, CRF-R1 expression was seen only in the lateral parabrachial nucleus, including its external lateral subnucleus (Fulwiler and Saper, 1984), which comprised the dominant locus of CRF-induced Fos expression, whereas CRF-R2 was detected in the medial NTS. [Interestingly, CRF-R1 expression in the NTS was localized discretely to its central subnucleus, a cell group that is not concerned directly with autonomic function (Cunningham and Sawchenko, 1989) and that also displayed focal and robust Fos-ir in response to icv CRF)]. An additional cell group found consistently to display CRF-induced Fos-ir, but expression of neither CRF-R subtype, was the locus coeruleus (Fig. 5).
Apart from those noted above, the only additional site at which the strength and extent of CRF-induced Fos-ir expression did not approximate those of CRF-R1 mRNA expression was the hippocampal formation, a locus at which challenge-induced Fos-ir has been seen to underestimate activational responses revealed using other markers, including c-fos mRNA induction [see discussion in Li and Sawchenko (1998)].
Dual immunohistochemical and hybridization histochemical localization
Concurrent dual labeling was performed on tissue obtained from rats killed at 2 hr after icv injection of 1 μg CRF in an effort to determine the extent to which similarities in the patterns of CRF-induced Fos-ir and CRF-R mRNA reflected expression in common populations of neurons. Material prepared in this manner was invariably associated with somewhat diminished sensitivity of each constituent method. This, coupled with the limited cellular resolution of receptor mRNA signal seen even under optimal (single labeling) circumstances, defeated any attempt to draw categorical conclusions. Nonetheless, examples of Fos-ir neurons overlain by above-background CRF-R1 mRNA signal were seen regularly in each of the more prominent sites of receptor expression highlighted above and in Table 2, and frank majorities of all Fos-ir cells in such regions displayed positive hybridization signals for CRF-R1 mRNA (Fig. 6). Relatively few cell groups were identified that reliably displayed dual Fos/CRF-R2 labeling. These were seen commonly in the dorsal raphé nucleus, the granule cell layer of the olfactory bulb, occasionally in the lateral septum and deep layers of isocortex, and rarely in the NTS or ventromedial nucleus of the hypothalamus.
Distribution of UCN-induced Fos expression
Despite the substantial overlap in the distributions of CRF-stimulated Fos-ir and CRF-R1 mRNA, the sheer breadth of the Fos induction pattern leaves open some question as to its specificity. Previous work had indicated that icv UCN provoked Fos induction in several sites enriched in CRF-R2 expression, as well as in others that express CRF-R1 or neither receptor (Vaughan et al., 1995). Here we have compared directly the activational effects of icv UCN versus CRF in relation to the CRF-R distributions (Figs.7, 8, Tables 2, 3).
Fig. 7.
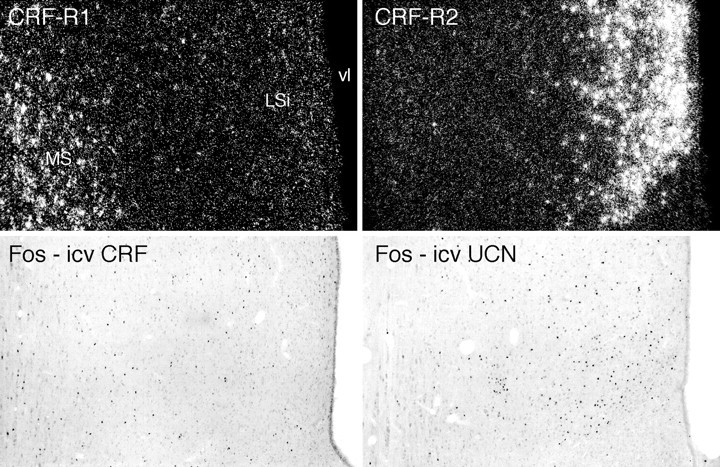
In the septal region, icv CRF- and UCN-induced Fos induction patterns preferentially conform to sites of CRF-R1 and CRF-R2 mRNA expression, respectively. Top, Sections through the septal region to show the differential distributions of CRF-R1 mRNA in the medial septal nucleus (MS) and CRF-R2 transcripts in the intermediate lateral septal nucleus (LSi). Bottom, Patterns of Fos induction seen 2 hr after icv injections of 1 μg CRF or UCN preferentially localize to regions enriched in CRF-R1 and CRF-R2 expression, respectively, but show overlap with the “nonpreferred” receptor distribution. vl, Lateral ventricle. All photomicrographs 75× magnification.
Fig. 8.
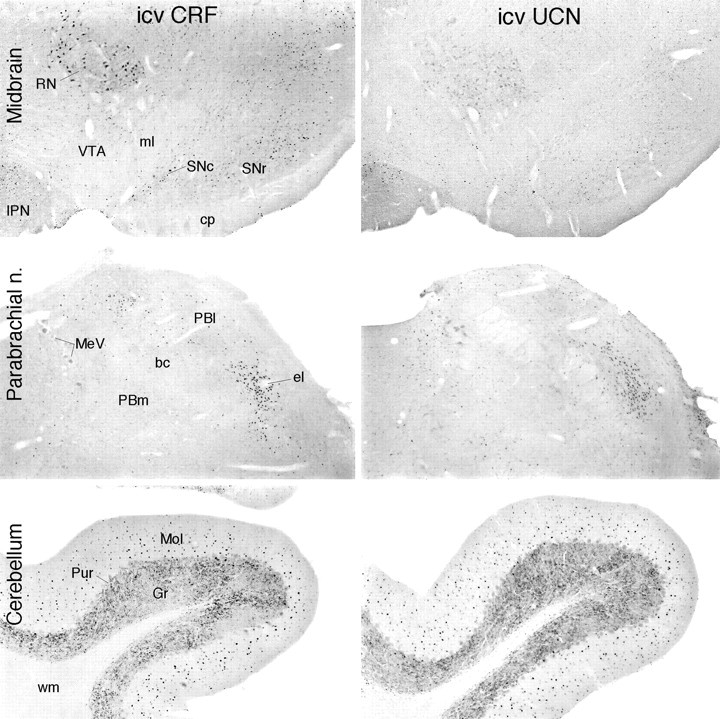
UCN provokes Fos induction comparable to that elicited by CRF in some, but not all, sites of CRF-R1 expression. Bright-field photomicrographs show immunoperoxidase material from animals killed 2 hr after icv injection of 1 μg CRF or UCN to compare Fos-ir induction patterns. In the ventral midbrain (top), CRF provokes activational responses in the substantia nigra (SNc, SNr), and the red (RN) and interpeduncular (IPN) nuclei, all of which are sites of CRF-R1 expression. UCN-stimulated Fos is seen principally in the interpeduncular nucleus, which alone among the structures shown is a site of substantial CRF-R2 expression. Both peptides provoke comparably robust activational responses in the lateral parabrachial nucleus (middle; concentrated in its external lateral subnucleus, el), a pivotal structure in the central autonomic system that expresses CRF-R1, but not CRF-R2, mRNA. In the cerebellar cortex (bottom), another unique site of CRF-R1 expression, icv UCN elicits a Fos-ir response the strength and distribution of which are similar to that provoked by CRF. Magnifications: top, 30×; middle andbottom, 50×.
Table 3.
Estimated numbera of Fos-ir neurons in rat brain cell groups after icv CRF or UCN
| Structure | Dominant receptor3-b | Treatment | ||
|---|---|---|---|---|
| Vehicle | 1 μg CRF | 1 μg UCN3-c | ||
| Lateral septal nucleus (intermediate) | R2 | 98 ± 11 | 1284 ± 115 | 3025 ± 347* |
| Medial septal nucleus | R1 | 26 ± 8 | 2362 ± 154 | 1033 ± 114* |
| Ventromedial nucleus hypothalamus | R2 | 12 ± 4 | 229 ± 41 | 165 ± 13ns |
| Dorsomedial nucleus hypothalamus | R1 | 78 ± 13 | 1179 ± 217 | 760 ± 66ns |
| Central nucleus amygdala (lateral) | Neither | 41 ± 9 | 1010 ± 113 | 1332 ± 85ns |
| Medial nucleus amygdala | R1 + R2 | 25 ± 6 | 881 ± 92 | 467 ± 52* |
| Basolateral nucleus amygdala | R1 | 9 ± 2 | 498 ± 73 | 108 ± 54* |
| Nucleus of the solitary tract (medial) | R2 | 52 ± 11 | 971 ± 110 | 1464 ± 224ns |
| Dorsal column nucleus (cuneate nucleus) | R1 | 17 ± 5 | 535 ± 35 | 91 ± 18* |
Values are mean (±SEM) corrected (Abercrombie, 1946) counts of the number of Fos-ir neurons in complete series of sections through the indicated structures. Rats were killed 2 hr after icv injection of 10 μl saline (vehicle; n = 5), 1 μg CRF in 10 μl saline (n = 5), or 1 μg UCN in 10 μl saline (n = 5). To minimize presumed nonspecific influences near the site of infusion, counts from the lateral septal nucleus were taken from the side contralateral to the injection. Note that the sampling is of several structures.
To facilitate comparison, the principal CRF-R subtype(s) expressed in each cell group is indicated.
All values obtained in response to treatment with either peptide differ from respective vehicle-treated controls;p < 0.001.
*Differs significantly from CRF-stimulated value, p < 0.05; ns, p > 0.05.
In general, the Fos induction pattern stimulated by icv UCN was substantially more restricted than that seen in response to CRF and displayed a greater propensity to be enriched in regions of CRF-R2 expression, yet it was manifest in some, but by no means all, sites of CRF-R1 expression. Among areas expressing the type 2 receptor, UCN was more potent than CRF in inducing activational responses in the lateral septal nucleus (Fig. 7). The choroid plexus, which is known to express an RNA processing variant (CRF-R2β) of the CRF-R2 transcript found in the brain parenchyma (CRF-R2α) (Lovenberg et al., 1995), reliably displayed Fos induction in response to icv UCN but not CRF. Although this raises the possibility that neuroactive agents released into the ventricular system from the choroid plexus might contribute in a secondary way to the UCN-induced pattern of Fos induction, we noted no consistent relationship between responsive sites and proximity to the ventricular surface. Two sites at which the type 2 receptor is expressed strongly, the ventromedial nucleus of the hypothalamus and the posterior cortical nucleus of the amygdala, displayed only scant activational responses to icv injection of either peptide. Areas expressing both receptors, such as the interpeduncular nucleus (Fig.8), the medial nucleus of the amygdala, and the mesencephalic raphé nuclei, showed roughly comparable responses to each peptide, although in these cases the topography of Fos induction conformed most closely to the pattern of CRF-R2 mRNA expression.
Among sites of CRF-R1 expression, UCN-induced Fos-ir was variable. In isocortex, for example, induction was seen most consistently in deeper layers, where R2 expression is concentrated, and much more sporadically in superficial ones where R1 expression dominates. UCN-induced Fos-ir did occasionally mimic the R1 distribution in small patches, but this was not seen consistently within or between animals, and displayed no consistent laminar or areal specificity when it was. UCN was quite ineffective in inducing Fos-ir in brainstem sensory and most precerebellar or postcerebellar structures found to be enriched in CRF-R1 and CRF-induced Fos expression. By contrast, UCN was roughly equipotent to CRF in activating such major sites of R1 expression as the nucleus incertus, lateral reticular nucleus, and cerebellar cortex (Fig. 8).
UCN elicited widespread cellular activation in the same core group of central autonomic structures highlighted above as being responsive to CRF (Fig. 8, Table 2). These responses were at least as robust as those seen after icv CRF and were even more so in the case of the locus coeruleus. In other components of this system, activational responses to UCN differed in nuance from those elicited by CRF. Thus, in addition to cells in the parvocellular division of the paraventricular nucleus of the hypothalamus, UCN elicited activation of hypothalamic magnocellular neurosecretory cell groups. In the NTS complex, UCN-responsive structures included the area postrema, where CRF-R2 but not CRF-R1 mRNA expression was apparent.
DISCUSSION
The host of studies that have used icv administration of CRF are cast most commonly in terms of the capacity of this treatment to mimic responses seen under stressful circumstances, and repeated or long-term treatment paradigms have implicated elevated central CRF levels as an important factor in the etiology of stress-related physiological and behavioral disorders (Linthorst et al., 1997; Buwalda et al., 1998). The fact that icv CRF elicits such stress-like effects as activation of the sympathoadrenal system (Brown et al., 1982; Fisher, 1993), generalized arousal and anxiety-like behaviors (Sutton et al., 1982;Koob et al., 1993), suppression of immune functions (Irwin et al., 1988; Friedman and Irwin, 1995), and appetitive behavior (Gosnell et al., 1983; Spina et al., 1996) spawned the concept of CRF as an integrator of multiple components of the organismic response to stress, an idea that has provided a dominant unifying framework for a field of study. The present findings suggest that icv CRF activates CRF-R1-expressing neurons in a highly preferential manner, supporting the utility of this approach as a means by which to generically access this peptide system. Yet this congruence follows the emphases of the cellular CRF-R1 mRNA distribution (Potter et al., 1994) in being most in evidence among cell groups involved in aspects of cortical, cerebellar, and several modalities of sensory information processing, and substantially less so in stress-related sites of peptide action.
The present findings are largely in accord with previous accounts of limited aspects of the Fos induction pattern seen after icv CRF (Arnold et al., 1992; Andreae and Herbert, 1993; Imaki et al., 1993; Parkes et al., 1993; Vellucci and Parrott, 1994; Marrosu et al., 1996) as well as with indications that the response displays an orderly time course (Imaki et al., 1993; Parkes et al., 1993), is dose-related (Arnold et al., 1992; Marrosu et al., 1996), and can be mitigated in a dose-dependent manner by coinjection of CRF-R antagonists (Arnold et al., 1992), although the latter is not necessarily indicative of direct peptide effects on any individual cell group. In examining the peptide-induced pattern of cellular activation more broadly, and directly in relation to CRF-R expression, we find a strong general correspondence with the distribution of CRF-R1-expressing cells, which extends to the subnuclear/laminar levels in most areas. Co-labeling for CRF-R1 mRNA and CRF-induced Fos-ir revealed extensive overlap in many brain regions. The specificity of this relationship is supported by the finding that sites preferentially enriched in CRF-R2 expression (Chalmers et al., 1995) were insensitive to icv CRF, an observation in line with the low affinity with which CRF is bound by this receptor and the low potency with which it signals through it (Lovenberg et al., 1995b; Vaughan et al., 1995). The activational response seen in the dorsal raphé nucleus presented a possible exception to this general rule, although the extent to which the relatively weak expression of CRF-R1 at this locus and its proximity to the ventricular system may have contributed to this response are unclear.
Central injections of UCN, a CRF-related peptide, provoked a pattern of Fos induction distinct from and more restricted than that yielded by CRF. This included recruitment of sites with the brain parenchyma and beyond (choroid plexus) that uniquely express CRF-R2, with an inconsistent involvement of CRF-R1-enriched regions. In contrast to CRF, UCN is bound with comparably high affinities by both receptor subtypes (Vaughan et al., 1995) and has been reported to be even somewhat more potent than CRF in activating the type 1 receptorin vivo and in vitro (Vaughan et al., 1995; Asaba et al., 1998). We are aware of no facile explanation for the observation that UCN was found to be as potent as CRF in activating some major sites of CRF-R1 expression (e.g., cerebellar cortex) and less so at others (e.g., isocortex).
CRF-induced activation of central autonomic structures
The principal exceptions to the general relationships highlighted above were the activational responses provoked by either peptide in a set of interconnected cell groups that comprise a core circuitry subserving central autonomic and neuroendocrine regulation, which is not readily explicable on the basis of the known distribution of CRF-Rs. These are of critical importance, because most have been identified as sites of CRF action in eliciting stress-related responses but have been found to display little or no capacity for CRF-R expression (Potter et al., 1994; Chalmers et al., 1995) or CRF binding (De Souza et al., 1985). Included among this grouping are the central nucleus of the amygdala, which has been identified repeatedly as a site of CRF action relevant to behavioral and autonomic components of the stress response (Brown et al., 1985; Gray, 1993; Koob et al., 1993); the paraventricular nucleus, whose hypophysiotropic CRF-expressing neurons receive a CRF-ir input (Liposits et al., 1985), comprising a possible basis for posited feedback and feedforward (Parkes et al., 1993) effects on the central limb of the HPA axis and which is otherwise a sensitive site for peptide effects on ingestive (Krahn et al., 1986) and cardiovascular responses (Brown, 1986); and the nucleus of the solitary tract and ventrolateral medulla, the linchpins of interoceptive information processing in brain and where CRF acts at low doses to elicit sympathomimetic effects on cardiovascular parameters (Brown, 1986; Fisher, 1993; Milner et al., 1993). Many would include among this grouping the locus coeruleus, the widespread noradrenergic output of which is thought to set levels of arousal and “behavioral vigilance” (Foote et al., 1983) and where unit activity is enhanced by icv or local administration of CRF (Valentino, 1990).
This generalized profile of central autonomic arousal could represent effects secondary to some peripheral consequence of central CRF injection. Despite strong evidence that icv CRF is rapidly cleared into the systemic circulation (Martins et al., 1996, 1997), the effects of CRF or UCN on blood pressure, which may be taken as a general index of sympathetic activity, are found consistently to be opposite in sign when given centrally (increased) versus intravenously (reduced), arguing against a predominantly peripheral site of action (Brown and Fisher, 1985; Fisher, 1993; Vaughan et al., 1995; Spina et al., 1996). Moreover, it is unlikely that the expected increase in arterial pressure that would attend icv administration would contribute to the activation of central autonomic circuitry, because this system is well known to be recruited to activation by hypotensive challenges and inhibited by hypertensive ones (Chan and Sawchenko, 1994; Li and Dampney, 1994). A more plausible explanation would be that generalized recruitment of central autonomic structures may be secondary to effects exerted directly on a component cell group that does express a CRF-R and is anatomically related to the others. Candidates for such a role would include the lateral parabrachial nucleus and the medial NTS, which express CRF-R1 (Potter et al., 1994) and CRF-R2 (our present findings and unpublished observations), respectively. CRF-R1 can be induced in the paraventricular nucleus by various stressors (Luo et al., 1994; Rivest et al., 1995) or icv CRF (Mansi et al., 1996; Makino et al., 1997), although this capacity would not appear to be relevant to the mounting of an acute Fos response; whether the paraventricular nucleus may express CRF-R2 under basal or stimulated conditions remains unsettled (cf. Chalmers et al., 1995; Mansi et al., 1996; Lee and Rivier, 1997; Makino et al., 1997). Alternative mechanisms to explain the response profile include possible presynaptic expression of a known CRF-R, involvement of a novel receptor subtype, or involvement of the CRF-binding protein, a centrally expressed protein distinct from CRF receptors (Potter et al., 1991, 1992), whose role in signaling beyond a capacity to bind CRF and UCN remains to be established (Behan et al., 1995). Overall, the lack of a readily identifiable basis in CRF-R expression for the generalized central autonomic activation seen in response to icv CRF or UCN poses an unresolved challenge to the widely held view of CRF as an integrator of multiple modalities of stress responses. It is relevant to point out in this regard that although the effectiveness of CRF receptor antagonists in mitigating CRF-induced activational responses in brain extends to central autonomic cell groups (Arnold et al., 1992; Parkes et al., 1993), antagonist treatment has proven substantially less efficacious in interfering with responses of components of this system to stress (Arnold et al., 1992; Koob et al., 1993; Imaki et al., 1995).
Does icv CRF access receptor-bearing neurons directly?
Possible explanations for the striking general correspondence between the CRF-induced Fos and CRF-R1 distributions include a scenario involving an initial activation of neurons at or near the ependymal or pial surfaces, with subsequent recruitment of receptor-bearing neurons by complex neuronal pathways. Although consistent with evidence suggesting a limited capacity of tracer proteins in CSF to penetrate the brain parenchyma (Pardridge, 1997), this explanation is not supported by the present findings. Ependymal and periventricular labeling were seen to occur more as a function of peptide dose than biological activity, arguing that activation of cells at or near these surfaces is insufficient to mimic the broad pattern of Fos induction elicited by CRF. Alternatively, it is possible that global activation of the central CRF-R system may be secondary to some physiological consequence of CRF injection. Evidence militating against this has been considered above, and even if one were to allow that so expansive and diverse a collection of cell groups as those that express CRF-R1 could be recruited to activation by some acute metabolic emergency, it would remain difficult to explain the more restricted and distinctive cellular activation pattern elicited by UCN. A third possibility, and the one seemingly most compatible with our findings, would hold simply that CRF administered via the icv route is able to access receptor-expressing cells directly. The route(s) that might provide for such are addressed only indirectly by the present findings. The ependyma is composed of specialized glial bound by junctions of the zonula adherens type (Brightman and Reese, 1969) and has been likened to a selectively permeable sieve (Del Bigio, 1995), which permits relatively slow access of CSF proteins to the brain parenchyma. Studies that have followed the fate of tracers such as horseradish peroxidase (HRP) have defined potential sites of solute exchange between the CSF and brain extracellular fluid. After icv or intracisternal injection, HRP is observed to penetrate the parenchyma in a dense but narrow band adjoining the ependymal and pial surfaces, consistent with the view that access by these routes is limited; however, tracer has also been found to distribute through fluid-filled perivascular (Virchow-Robin) spaces associated with large penetrating blood vessels (Brightman and Reese, 1969; Wagner et al., 1974), and more recent evidence suggests that these spaces may be continuous with the basal laminae surrounding the parenchymal microvasculature. Thus, within a matter of minutes after initiating icv HRP infusion, reaction product has been observed to outline the entire capillary network and to be detectable in the adjoining extracellular space, suggesting a “paravascular” route that might provide for solute exchange between the CSF and the brain parenchyma (Rennels et al., 1985). Although the patterns of Fos induction described herein support the view that access across the ependymal and pial surfaces is limited, the low temporal resolution of the method precludes any assessment of the potential for generalized distribution by way of the paravascular route highlighted above. Although there remain other significant unresolved issues, most notably the basis for peptide-induced central autonomic activation, the results support the utility and validity of the icv injection approach as a means by which to determine central receptor-mediated effects of members of the CRF neuropeptide family.
Footnotes
This work was supported by National Institutes of Health Grant DK-26741 and was conducted in part by the Foundation for Medical Research. P.E.S is an investigator of the Foundation for Medical Research. J.C.B. was a visiting scientist on leave from the Department of Anatomy-ICB, University of Sao Paulo, Brazil, and was supported by CNPq (Grants 203301/87-0 and 300583/91-5; J.C.B. is a CNPq investigator). We are grateful to Dr. Jean Rivier for synthetic peptides and antagonists, and to Carlos Arias, Kris Trulock, and Belle Wamsley for excellent assistance in the preparation of histological materials, illustrations, and manuscript, respectively.
Correspondence should be addressed to Dr. P. E. Sawchenko, The Salk Institute for Biological Studies, 10010 N. Torrey Pines Road, La Jolla, CA 92037. E-mail: sawchenko@salk.edu.
REFERENCES
- 1.Abercrombie M. Estimation of nuclear populations from microtome populations from microtome sections. Anat Rec. 1946;94:239–247. doi: 10.1002/ar.1090940210. [DOI] [PubMed] [Google Scholar]
- 2.Agnati LF, Zoli M, Stromberg I, Fuxe K. Intercellular communication in the brain: wiring versus volume transmission. Neuroscience. 1995;69:711–726. doi: 10.1016/0306-4522(95)00308-6. [DOI] [PubMed] [Google Scholar]
- 3.Aird RB. A study of intrathecal, cerebrospinal fluid-to-brain exchange. Exp Neurol. 1984;86:342–358. doi: 10.1016/0014-4886(84)90192-4. [DOI] [PubMed] [Google Scholar]
- 4.Andreae LC, Herbert J. Expression of c-fos in restricted areas of the basal forebrain and brainstem following single or combined intraventricular infusions of vasopressin and corticotropin-releasing factor. Neuroscience. 1993;53:735–748. doi: 10.1016/0306-4522(93)90620-u. [DOI] [PubMed] [Google Scholar]
- 5.Arnold FJL, De Lucas Bueno M, Shiers H, Hancock DC, Evan GI, Herbert J. Expression of c-fos in regions of the basal limbic forebrain following intra-cerebroventricular corticotropin-releasing factor in unstressed or stressed male rats. Neuroscience. 1992;51:377–390. doi: 10.1016/0306-4522(92)90322-s. [DOI] [PubMed] [Google Scholar]
- 6.Asaba K, Makino S, Hashimoto K. Effect of urocortin on ACTH secretion from rat anterior pituitary in vitro and in vivo: comparison with corticotropin-releasing hormone. Brain Res. 1998;806:95–103. doi: 10.1016/s0006-8993(98)00747-1. [DOI] [PubMed] [Google Scholar]
- 7.Behan DP, De Souza EB, Lowry PJ, Potter E, Sawchenko PE, Vale WW. Corticotropin releasing factor (CRF) binding protein: a novel regulator of CRF and related peptides. Front Neuroendocrinol. 1995;l16:362–382. doi: 10.1006/frne.1995.1013. [DOI] [PubMed] [Google Scholar]
- 8.Bittencourt JC, Rissman RA, Sawchenko PE. Central CRF administration preferentially activates neurons expressing type I CRF receptors. Soc Neurosci Abstr. 1996;22:1554. [Google Scholar]
- 9.Brightman MW, Reese TS. Junctions between intimately apposed cell membranes in the vertebrate brain. J Cell Biol. 1969;40:648–677. doi: 10.1083/jcb.40.3.648. [DOI] [PMC free article] [PubMed] [Google Scholar]
- 10.Brown M. Corticotropin releasing factor: central nervous system sites of action. Brain Res. 1986;399:10–14. doi: 10.1016/0006-8993(86)90595-0. [DOI] [PubMed] [Google Scholar]
- 11.Brown MR, Fisher LA. Corticotropin-releasing factor: effects on the autonomic nervous system and visceral system. Fed Proc. 1985;44:243–248. [PubMed] [Google Scholar]
- 12.Brown MR, Fisher LA, Rivier J, Spiess J, Rivier C, Vale W. Corticotropin-releasing factor: effects on the sympathetic nervous system and oxygen consumption. Life Sci. 1982;30:207–210. doi: 10.1016/0024-3205(82)90654-3. [DOI] [PubMed] [Google Scholar]
- 13.Brown MR, Fisher LA, Webb V, Vale WW, Rivier JE. Corticotropin-releasing factor: a physiologic regulator of adrenal epinephrine secretion. Brain Res. 1985;328:355–357. doi: 10.1016/0006-8993(85)91048-0. [DOI] [PubMed] [Google Scholar]
- 14.Buwalda B, Van Kalkeren AA, de Boer SF, Koolhaas JM. Behavioral and physiological consequences of repeated daily intracerebroventricular injection of corticotropin-releasing factor in the rat. Psychoneuroendocrinology. 1998;23:205–218. doi: 10.1016/s0306-4530(97)00096-6. [DOI] [PubMed] [Google Scholar]
- 15.Chalmers DT, Lovenberg TW, De Souza EB. Localization of novel corticotropin-releasing factor receptor (CRF2) mRNA expression to specific sub-cortical nuclei in rat brain: comparison with CRF1 receptor mRNA expression. J Neurosci. 1995;15:6340–6350. doi: 10.1523/JNEUROSCI.15-10-06340.1995. [DOI] [PMC free article] [PubMed] [Google Scholar]
- 16.Chan RKW, Sawchenko PE. Spatially and temporally differentiated patterns of c-fos expression in brainstem catecholaminergic cell groups induced by cardiovascular challenges in the rat. J Comp Neurol. 1994;348:433–460. doi: 10.1002/cne.903480309. [DOI] [PubMed] [Google Scholar]
- 17.Chan RKW, Brown ER, Ericsson A, Kovács KJ, Sawchenko PE. A comparison of two immediate-early genes, c-fos and NGFI-B, as markers for functional activation in stress-related neuroendocrine circuitry. J Neurosci. 1993;13:5125–5138. doi: 10.1523/JNEUROSCI.13-12-05126.1993. [DOI] [PMC free article] [PubMed] [Google Scholar]
- 18.Chang CP, Pearse RV, II, O'Connell S, Rosenfeld MG. Identification of a seven transmembrane helix receptor for corticotropin-releasing factor and sauvagine in mammalian brain. Neuron. 1993;11:1187–1195. doi: 10.1016/0896-6273(93)90230-o. [DOI] [PubMed] [Google Scholar]
- 19.Chen R, Lewis KA, Perrin MH, Vale WW. Expression cloning of a human corticotropin-releasing-factor receptor. Proc Natl Acad Sci USA. 1993;90:8967–8971. doi: 10.1073/pnas.90.19.8967. [DOI] [PMC free article] [PubMed] [Google Scholar]
- 20.Cox KH, DeLeon DV, Angerer LM, Angerer RC. Detection of mRNAs in sea urchin embryos by in situ hybridization using asymmetric RNA probes. Dev Biol. 1984;101:485–502. doi: 10.1016/0012-1606(84)90162-3. [DOI] [PubMed] [Google Scholar]
- 21.Crawley JN, Fiske SM, Durieux C, Derrien M, Roques BP. Centrally administered cholecystokinin suppresses feeding through a peripheral-type receptor mechanism. J Pharmacol Exp Ther. 1991;257:1076–1080. [PubMed] [Google Scholar]
- 22.Cunningham ET, Jr, Sawchenko PE. A circumscribed projection from the nucleus of the solitary tract to the nucleus ambiguus in the rat: anatomical evidence for somatostatin-28-immunoreactive interneurons subserving reflex control of esophageal motility. J Neurosci. 1989;9:1668–1682. doi: 10.1523/JNEUROSCI.09-05-01668.1989. [DOI] [PMC free article] [PubMed] [Google Scholar]
- 23.de Lange ECM, Danhof M, de Boer AG, Breimer DD. Critical factors of intracerebral microdialysis as a technique to determine the pharmacokinetics of drugs in rat brain. Brain Res. 1994;666:1–8. doi: 10.1016/0006-8993(94)90276-3. [DOI] [PubMed] [Google Scholar]
- 24.Del Bigio MR. The ependyma: a protective barrier between brain and cerebrospinal fluid. Glia. 1995;14:1–13. doi: 10.1002/glia.440140102. [DOI] [PubMed] [Google Scholar]
- 25.De Souza EB, Insel TR, Perrin MH, Rivier J, Vale WW, Kuhar MJ. Corticotropin-releasing factor receptors are widely distributed in the rat central nervous system: an autoradiographic study. J Neurosci. 1985;5:3189–3203. doi: 10.1523/JNEUROSCI.05-12-03189.1985. [DOI] [PMC free article] [PubMed] [Google Scholar]
- 26.Fenstermacher J, Kaye T. Drug “diffusion” within the brain. Ann NY Acad Sci. 1988;531:29–39. doi: 10.1111/j.1749-6632.1988.tb31809.x. [DOI] [PubMed] [Google Scholar]
- 27.Fisher LA. Central actions of corticotropin-releasing factor on autonomic nervous activity and cardiovascular functioning. In: Chadwick DJ, Marsh J, Ackrill K, editors. Corticotropin-releasing factor, Ciba Foundation Symposium 172. Wiley; London: 1993. pp. 243–257. [DOI] [PubMed] [Google Scholar]
- 28.Foote SL, Bloom FE, Aston-Jones G. Nucleus locus ceruleus: new evidence of anatomical and physiological specificity. Physiol Rev. 1983;63:844–914. doi: 10.1152/physrev.1983.63.3.844. [DOI] [PubMed] [Google Scholar]
- 29.Friedman EM, Irwin MR. A role for CRH and the sympathetic nervous system in stress-induced immunosuppression. Ann NY Acad Sci. 1995;771:396–418. doi: 10.1111/j.1749-6632.1995.tb44698.x. [DOI] [PubMed] [Google Scholar]
- 30.Fulwiler CE, Saper CB. Subnuclear organization of the efferent connections of the parabrachial nucleus in the rat. Brain Res. 1984;7:229–259. doi: 10.1016/0165-0173(84)90012-2. [DOI] [PubMed] [Google Scholar]
- 31.Gray TS. Amygdaloid CRF pathways. Role in autonomic, neuroendocrine, and behavioral responses to stress. Ann NY Acad Sci. 1993;697:53–60. doi: 10.1111/j.1749-6632.1993.tb49922.x. [DOI] [PubMed] [Google Scholar]
- 32.Gosnell BA, Morley JE, Levine AS. A comparison of the effects of corticotropin releasing factor and sauvagine on food intake. Pharmacol Biochem Behav. 1983;19:771–775. doi: 10.1016/0091-3057(83)90078-3. [DOI] [PubMed] [Google Scholar]
- 33.Herdegen T, Kovary K, Buhl A, Bravo R, Zimmermann M, Gass P. Basal expression of the inducible transcription factors c-Jun, JunB, JunD, c-Fos, FosB, and Krox-24 in the adult rat brain. J Comp Neurol. 1995;354:39–56. doi: 10.1002/cne.903540105. [DOI] [PubMed] [Google Scholar]
- 34.Herkenham M. Mismatches between neurotransmitter and receptor localizations in brain: observations and implications. Neuroscience. 1987;23:1–38. doi: 10.1016/0306-4522(87)90268-5. [DOI] [PubMed] [Google Scholar]
- 35.Imaki T, Shibasaki T, Hotta M, Demura H. Intracerebroventricular administration of corticotropin-releasing factor induces c-fos mRNA expression in brain regions related to stress responses: comparison with pattern of c-fos mRNA induction after stress. Brain Res. 1993;616:114–125. doi: 10.1016/0006-8993(93)90199-w. [DOI] [PubMed] [Google Scholar]
- 36.Imaki T, Shibasaki T, Wang XQ, Demura H. Intracerebroventricular administration of corticotropin-releasing factor antagonist attenuates c-fos mRNA expression in the paraventricular nucleus after stress. Neuroendocrinology. 1995;61:445–452. doi: 10.1159/000126867. [DOI] [PubMed] [Google Scholar]
- 37.Irwin M, Hauger RL, Brown M, Britton KT. CRF activates autonomic nervous system and reduces natural killer cytotoxicity. Am J Physiol. 1988;255:R744–R747. doi: 10.1152/ajpregu.1988.255.5.R744. [DOI] [PubMed] [Google Scholar]
- 38.Ju G, Swanson LW. Studies on the cellular architecture of the bed nuclei of the stria terminalis in the rat: I. Cytoarchitecture. J Comp Neurol. 1989;280:587–602. doi: 10.1002/cne.902800409. [DOI] [PubMed] [Google Scholar]
- 39.Koob GF, Heinrichs SC, Pich EM, Menzaghi F, Baldwin H, Miczek K, Britton KT. The role of corticotropin-releasing factor in behavioral responses to stress. In: Chadwick DJ, Marsh J, Ackrill K, editors. Corticotropin-releasing factor, Ciba Foundation Symposium 172. Wiley; London: 1993. pp. 277–295. [DOI] [PubMed] [Google Scholar]
- 40.Krahn DD, Gosnell BA, Grace M, Levine AS. CRF antagonist partially reverses CRF- and stress-induced effects on feeding. Brain Res Bull. 1986;17:285–289. doi: 10.1016/0361-9230(86)90233-9. [DOI] [PubMed] [Google Scholar]
- 41.Lee S, Rivier C. Alcohol increases the expression of type 1, but not type 2 alpha corticotropin-releasing factor (CRF) receptor messenger ribonucleic acid in the rat hypothalamus. Mol Brain Res. 1997;52:78–79. doi: 10.1016/s0169-328x(97)00226-x. [DOI] [PubMed] [Google Scholar]
- 42.Li H-Y, Sawchenko PE. Hypothalamic effector neurons and extended circuitries activated in “neurogenic” stress: a comparison of footshock effects exerted acutely, chronically, and in animals with controlled glucocorticoid levels. J Comp Neurol. 1998;393:244–266. [PubMed] [Google Scholar]
- 43.Li Y-W, Dampney RAL. Expression of fos-like protein in brain following sustained hypertension and hypotension in conscious rabbits. Neuroscience. 1994;61:613–634. doi: 10.1016/0306-4522(94)90439-1. [DOI] [PubMed] [Google Scholar]
- 44.Linthorst AC, Flachskamm C, Hopkins SJ, Hoadley ME, Labeur MS, Holsboer F, Reul JM. Long-term intracerebroventricular infusion of corticotropin-releasing hormone alters neuroendocrine, neurochemical, autonomic, behavioral, and cytokine responses to a systemic inflammatory challenge. J Neurosci. 1997;17:4448–4460. doi: 10.1523/JNEUROSCI.17-11-04448.1997. [DOI] [PMC free article] [PubMed] [Google Scholar]
- 45.Liposits Z, Paull WK, Setalo G, Vigh S. Evidence for local corticotropin releasing factor (CRF)-immunoreactive neuronal circuits in the paraventricular nucleus of the rat hypothalamus. Histochemistry. 1985;83:5–16. doi: 10.1007/BF00495294. [DOI] [PubMed] [Google Scholar]
- 46.Lovenberg TW, Chalmers DT, Liu C, De Souza EB. CRF2α and CRF2β receptor mRNAs are differentially distributed between the rat central nervous system and peripheral tissues. Endocrinology. 1995a;136:4139–4142. doi: 10.1210/endo.136.9.7544278. [DOI] [PubMed] [Google Scholar]
- 47.Lovenberg TW, Liaw CW, Grigoriadis DE, Clevenger W, Chalmers DT, De Souza EB, Oltersdorf T. Cloning and characterization of a functionally distinct corticotropin-releasing factor receptor subtype from rat brain. Proc Natl Acad Sci USA. 1995b;92:836–840. doi: 10.1073/pnas.92.3.836. [DOI] [PMC free article] [PubMed] [Google Scholar]
- 48.Luo X, Kiss A, Makara G, Lolait SJ, Aguilera G. Stress-specific regulation of corticotropin releasing hormone receptor expression in the paraventricular and supraoptic nuclei of the hypothalamus in the rat. J Neuroendocrinol. 1994;6:689–696. doi: 10.1111/j.1365-2826.1994.tb00636.x. [DOI] [PubMed] [Google Scholar]
- 49.Makino S, Takemura T, Asaba K, Nishiyama M, Takao T, Hashimoto K. Differential regulation of type-1 and type-2α corticotropin-releasing hormone receptor mRNA in the hypothalamic paraventricular nucleus of the rat. Mol Brain Res. 1997;47:170–176. doi: 10.1016/s0169-328x(97)00046-6. [DOI] [PubMed] [Google Scholar]
- 50.Mansi JA, Rivest S, Drolet G. Regulation of corticotropin-releasing factor type 1 (CRF1) receptor messenger ribonucleic acid in the paraventricular nucleus of rat hypothalamus by exogenous CRF. Endocrinology. 1996;137:4619–4629. doi: 10.1210/endo.137.11.8895325. [DOI] [PubMed] [Google Scholar]
- 51.Marrosu F, Pinna A, Fadda P, Fratta W, Morelli M. C-Fos expression as a molecular marker in corticotropin-releasing factor-induced seizures. Synapse. 1996;24:297–304. doi: 10.1002/(SICI)1098-2396(199611)24:3<297::AID-SYN12>3.0.CO;2-U. [DOI] [PubMed] [Google Scholar]
- 52.Martins JM, Kastin AJ, Banks WA. Unidirectional specific and modulated brain to blood transport of corticotropin-releasing hormone. Neuroendocrinology. 1996;63:338–348. doi: 10.1159/000126974. [DOI] [PubMed] [Google Scholar]
- 53.Martins JM, Banks WA, Kastin AJ. Acute modulation of active carrier-mediated brain-to-blood transport of corticotropin-releasing hormone. Am J Physiol. 1997;272:E312–E319. doi: 10.1152/ajpendo.1997.272.2.E312. [DOI] [PubMed] [Google Scholar]
- 54.Milner TA, Reis DJ, Pickel VM, Aicher SA, Giuliano R. Ultrastructural localization and afferent sources of corticotropin-releasing factor in the rat rostral ventrolateral medulla: implications for central cardiovascular regulation. J Comp Neurol. 1993;333:151–167. doi: 10.1002/cne.903330203. [DOI] [PubMed] [Google Scholar]
- 55.Oldfield EH, Schulte HM, Chrousos GP, Rock JP, Kornblith PL, O'Neill DL, Poplack DG, Gold PW, Cutler GB, Jr, Loriaux L. Active clearance of corticotropin-releasing factor from the cerebrospinal fluid. Neuroendocrinology. 1985;40:84–87. doi: 10.1159/000124056. [DOI] [PubMed] [Google Scholar]
- 56.Pardridge WM. Recent developments in peptide drug delivery to the brain. Pharmacol Toxicol. 1992;71:3–10. doi: 10.1111/j.1600-0773.1992.tb00512.x. [DOI] [PubMed] [Google Scholar]
- 57.Pardridge WM. Drug delivery to the brain. J Cereb Blood Flow Metab. 1997;17:713–731. doi: 10.1097/00004647-199707000-00001. [DOI] [PubMed] [Google Scholar]
- 58.Parkes D, Rivest S, Lee S, Rivier C, Vale W. Corticotropin-releasing factor activates c-fos, NGFI-B, and corticotropin-releasing factor gene expression within the paraventricular nucleus of the rat hypothalamus. Mol Endocrinol. 1993;7:1357–1367. doi: 10.1210/mend.7.10.8264665. [DOI] [PubMed] [Google Scholar]
- 59.Perrin M, Donaldson C, Chen R, Blount A, Berggren T, Bilezikjian L, Sawchenko P, Vale W. Identification of a second corticotropin-releasing factor receptor gene and characterization of a cDNA expressed in heart. Proc Natl Acad Sci USA. 1995;92:2969–2973. doi: 10.1073/pnas.92.7.2969. [DOI] [PMC free article] [PubMed] [Google Scholar]
- 60.Potter E, Behan DP, Fischer WH, Linton EA, Lowry PJ, Vale WW. Cloning and characterization of the cDNAs for human and rat corticotropin releasing factor-binding protein. Nature. 1991;6308:423–426. doi: 10.1038/349423a0. [DOI] [PubMed] [Google Scholar]
- 61.Potter E, Behan DP, Linton EA, Lowry PJ, Sawchenko PE, Vale WW. The central distribution of a corticotropin-releasing factor (CRF)-binding protein predicts multiple sites and modes of interaction with CRF. Proc Natl Acad Sci USA. 1992;89:4192–4196. doi: 10.1073/pnas.89.9.4192. [DOI] [PMC free article] [PubMed] [Google Scholar]
- 62.Potter E, Sutton S, Donaldson C, Chen R, Perrin M, Lewis K, Sawchenko PE, Vale W. Distribution of corticotropin-releasing factor receptor mRNA expression in the rat brain and pituitary. Proc Natl Acad Sci USA. 1994;91:8777–8781. doi: 10.1073/pnas.91.19.8777. [DOI] [PMC free article] [PubMed] [Google Scholar]
- 63.Prokai L. Peptide drug delivery into the central nervous system. Prog Drug Res. 1998;51:95–131. doi: 10.1007/978-3-0348-8845-5_3. [DOI] [PubMed] [Google Scholar]
- 64.Rennels ML, Gregory TF, Blaumanis OR, Fujimoto K, Grady PA. Evidence for a “paravascular” fluid circulation in the mammalian central nervous system, provided by the rapid distribution of tracer protein throughout the brain from the subarachnoid space. Brain Res. 1985;326:47–63. doi: 10.1016/0006-8993(85)91383-6. [DOI] [PubMed] [Google Scholar]
- 65.Rivest S, Laflamme N, Nappi RE. Immune challenge and immobilization stress induce transcription of the gene encoding the CRF receptor in selective nuclei of the rat hypothalamus. J Neurosci. 1995;15:2680–2695. doi: 10.1523/JNEUROSCI.15-04-02680.1995. [DOI] [PMC free article] [PubMed] [Google Scholar]
- 66.Rivier C, Rivier J, Vale W. Inhibition of adrenocorticotropic hormone secretion in rat by immunoneutralization of corticotropin-releasing factor (CRF). Science. 1982;218:377–379. doi: 10.1126/science.6289439. [DOI] [PubMed] [Google Scholar]
- 67.Rivier J, Rivier C, Galyean R, Miranda A, Miller C, Craig AG, Yamamoto G, Brown M, Vale W. Single point D-substituted corticotropin releasing factor analogues: effects on potency and physicochemical characteristics. J Med Chem. 1993;36:2851–2859. doi: 10.1021/jm00072a003. [DOI] [PubMed] [Google Scholar]
- 68.Saper CB. Central autonomic system. In: Paxinos G, editor. The rat nervous system, Ed 2. Academic; San Diego: 1995. pp. 107–128. [Google Scholar]
- 69.Sawchenko PE. Central connections of the sensory and motor nuclei of the vagus nerve. J Auton Nerv Syst. 1983;9:13–26. doi: 10.1016/0165-1838(83)90129-7. [DOI] [PubMed] [Google Scholar]
- 70.Simmons DM, Arriza JL, Swanson LW. A complete protocol for in situ hybridization of messenger RNAs in brain and other tissues with radiolabeled single-stranded RNA probes. J Histotechnol. 1989;12:169–181. [Google Scholar]
- 71.Spina M, Merlo-Pich E, Chan RKW, Basso AM, Rivier J, Vale W, Koob GF. Appetite-suppressing effects of urocortin, a CRF-related neuropeptide. Science. 1996;273:1561–1564. doi: 10.1126/science.273.5281.1561. [DOI] [PubMed] [Google Scholar]
- 72.Suda T, Tomori N, Tozawa F, Mouri T, Demura H, Shizume K. Effects of bilateral adrenalectomy on immunoreactive corticotropin-releasing factor in the rat median eminence and intermediate-posterior pituitary. Endocrinology. 1983;113:1182–1184. doi: 10.1210/endo-113-3-1182. [DOI] [PubMed] [Google Scholar]
- 73.Sutton RE, Koob GF, LeMoal M, Rivier J, Vale W. Corticotropin-releasing factor (CRF) produces behavioral activation in rats. Nature. 1982;297:331–333. doi: 10.1038/297331a0. [DOI] [PubMed] [Google Scholar]
- 74.Sutton SW, Behan DP, Lahrichi SL, Kaiser R, Corrigan A, Lowry P, Potter E, Perrin MH, Rivier J, Vale WW. Ligand requirements of the human corticotropin-releasing factor-binding protein. Endocrinology. 1995;136:1097–1102. doi: 10.1210/endo.136.3.7867564. [DOI] [PubMed] [Google Scholar]
- 75.Vale W, Speiss J, Rivier C, Rivier J. Characterization of a 41-residue ovine hypothalamic peptide that stimulates secretion of corticotropin and β-endorphin. Science. 1981;213:1394–1397. doi: 10.1126/science.6267699. [DOI] [PubMed] [Google Scholar]
- 76.Valentino RJ. Effects of CRF on spontaneous and sensory-evoked activity of locus coeruleus neurons. In: De Souza EB, Nemeroff CB, editors. Corticotropin releasing factor: basic and clinical studies of a neuropeptide. CRC; Boca Raton, FL: 1990. pp. 217–231. [Google Scholar]
- 77.Vaughan J, Donaldson C, Bittencourt J, Perrin MH, Lewis K, Sutton S, Chan R, Turnbull AV, Lovejoy D, Rivier C, Rivier J, Sawchenko PE, Vale W. Urocortin, a mammalian neuropeptide related to fish urotensin I and to corticotropin-releasing factor. Nature. 1995;378:287–292. doi: 10.1038/378287a0. [DOI] [PubMed] [Google Scholar]
- 78.Vellucci SV, Parrott RF. Expression of c-fos in the ovine brain following different types of stress, or central administration of corticotrophin-releasing hormone. Exp Physiol. 1994;79:241–248. doi: 10.1113/expphysiol.1994.sp003757. [DOI] [PubMed] [Google Scholar]
- 79.Vita N, Laurent P, Lefort S, Chalon P, Lelias JM, Kaghad M, Le Fur G, Caput D, Ferrara P. Primary structure and functional expression of mouse pituitary and human brain CRF receptors. FEBS Lett. 1993;335:1–5. doi: 10.1016/0014-5793(93)80427-v. [DOI] [PubMed] [Google Scholar]
- 80.Wagner H-J, Pilgrim C, Brandl J. Penetration and removal of horseradish peroxidase injected into the cerebrospinal fluid: role of cerebral perivascular spaces, endothelium and microglia. Acta Neuropathol. 1974;27:299–315. doi: 10.1007/BF00690695. [DOI] [PubMed] [Google Scholar]
- 81.Watts AG, Swanson LW. The combination of in situ hybridization with immunohistochemistry and retrograde tract-tracing. In: Conn PM, editor. Methods in neurosciences, Vol 1, Genetic probes. Academic; New York: 1989. pp. 127–136. [Google Scholar]