

Abstract
It is generally assumed that gradients of chemotropic molecules are instrumental to the wiring of the nervous system. Recently, two members of the secreted class III semaphorin protein family have been implicated as repulsive (Sema3A) and attractive (Sema3C) guidance molecules for cortical axons (Bagnard et al., 1998). Here, we show that stabilized gradients of increasing semaphorin concentrations elicit stereotyped responses from cortical growth cones, independent of the absolute concentration and the slope of these gradients. In contrast, neither repulsive effects of Sema3A nor attractive effects of Sema3C were observed when axons were growing toward decreasing semaphorin concentrations. Thus, growth cone guidance by gradients of chemotropic molecules is robust and reproducible, because it is primarily independent of the exact dimensions of the gradients.
Keywords: wiring molecules, axonal guidance, gradients, chemotropic attraction, chemotropic repulsion, semaphorins, cortical development, in vitro assays, time-lapse imaging
A fundamental issue in developmental neurobiology is how neurons establish precise connections to distant target cells. Ramón y Cajal first suggested that the motile tips of growing axons, which he called growth cones, are guided by chemotaxis. It took almost 100 years, however, until the existence of such “chemotropic” molecules was demonstrated experimentally in the nervous system. In these studies, neurons were cultured next to target tissue in a gel that stabilized gradients of diffusible molecules and at the same time enabled axons to grow in vitro. Such coculture experiments revealed that specific populations of growing axons are attracted at a distance by their target cells or by intermediate targets that they encounter on their way toward their final destinations (Lumsden and Davies, 1983; Tessier-Lavigne et al., 1988). Moreover, it was also found that cells from regions not innervated by a given axonal population can in some cases release substances that cause these fibers to grow away from this source of “chemorepulsive” factors (Pini, 1993). Based on such in vitro assays, it was possible to isolate and clone two families of chemotropic molecules, the netrins (Tessier-Lavigne and Goodman, 1996) and the semaphorins (Püschel, 1996), which are expressed in the developing nervous system. It is now generally accepted that gradients of long-range guidance cues constitute an important mechanism for the specification of neuronal connections. In theoretical studies, different mathematical models have been proposed to describe how growth cones might be possibly guided by gradients of chemotropic molecules (Gierer, 1981; Goodhill, 1997). However, despite some notable exceptions (Baier and Bonhoeffer, 1992; Rosentreter et al., 1998), there is little experimental work about the mechanisms by which changing concentrations of chemoattractant and chemorepellent factors actually influence growing axons. For example, if axons are attracted by chemotropic factors released from intermediate targets, what does prevent the fibers from stopping in the regions in which the concentrations of chemoattractive substances are highest, and what allows them to continue to grow toward their final targets? Similarly, if chemorepellent substances secreted from nontarget regions define inaccessible territories along specific pathways, do these repulsive factors then also impede axonal growth in the appropriate direction? Axonal pathways are formed in a highly stereotyped manner, and they appear tightly regulated in space and time. If gradients of chemotropic molecules are instrumental for the patterning of fiber trajectories, how finely tuned must the absolute concentration and shape of gradients be to produce highly reproducible axonal connections?
To address these issues, we examined the reaction of developing cortical axons to defined gradients of two members of the semaphorin gene family, Sema3A (previously called SemD) and Sema3C (previously called SemE). Earlier work indicated that Sema3A acts as a repellent or inhibitory signal for a variety of axonal populations, including cortical fibers (Messersmith et al., 1995; Püschel et al., 1995;Püschel, 1996; Bagnard et al., 1998, Polleux et al., 1998), whereas Sema3C is an attractant signal for cortical axons (Bagnard et al., 1998). The present study indicates that the exact dimensions of gradients, such as the magnitude of the concentration or the slope, are not the essential parameters of axon attraction or repulsion by semaphorins. However, growth cones are very sensitive to the direction or “sign” of semaphorin gradients, and they strongly respond to increasing or uniform concentrations of Sema3A and Sema3C, but they are not affected by these guidance molecules when the concentration decreases by <1% over the width of a growth cone.
MATERIALS AND METHODS
Membrane preparations. Stable human embryonic kidney 293 (HEK 293) cells expressing functional recombinant Sema3A or Sema3C (pBKFlagSema3AP1b, pBKFlagSema3CP1b) (Adams et al., 1997;Bagnard et al., 1998), or untransfected (control) cells were used to prepare cell membranes. Because cortical axons do not grow well on HEK 293 cell membranes, we added membranes from postnatal cortex that contain (unknown) growth-promoting molecules for cortical axons. Postnatal day 3 cortical tissues served to prepare postnatal membranes. Membranes were prepared as described by Götz et al. (1992). Membranes concentrations were determined by measuring optical densities of solutions after 15-fold dilution in 2% SDS. To quantify semaphorin concentrations, membrane preparations were transferred on nitrocellulose membrane (D3354; Schleider & Schuell, Dassel, Germany). Dot blot (protein detection with anti-Flag M2; Sigma) were scanned and digitalized for fluorimaging analysis (FluorImager SI, Image Quant; Molecular Dynamics, Sunnyvale, CA). Concentrations of semaphorin were determined as a function of a standard Flag protein (N-terminal flag-BAP protein; Sigma) using Excel software analysis. We found that membrane solutions with optical density 0.1 contain 1 μg/ml semaphorin.
Production of gradients. Membranes gradients were prepared on capillary pore filters as described by Baier and Bonhoeffer (1992). Briefly, a drop of membrane solution was pipetted onto a capillary pore filter placed on a nylon matrix that was connected to a vacuum pump. An inclined glass coverslip was positioned over the membrane suspension, so that only the lower edge of the coverslip touched the filter. The drop adhered to the coverslip and, after application of a vacuum, contracted toward the lower edge of the coverslip. This resulted in a graded distribution of membrane particles, with the highest concentration at the side on which the coverslip was placed on the filter. Membrane gradients of different slopes were produced by varying the inclination angle of the coverslip. A detailed description of this technique is provided by Baier and Klostermann (1994).
The membrane gradients on the capillary pore filters were transferred to laminin–poly-l-lysine (1 mg/ml; Sigma) -coated glass coverslips (Hübener et al., 1995). It was therefore possible to obtain a clear phase-contrast image of the axons and the membrane particles. In addition, membrane gradients were also visualized by supplementing fluorescent beads [3 μl of Covaspheres (Duke Scientific, Palo Alto, CA) per 100 μl of membrane solution] and examined with the appropriate fluorescent filter set. The density of membrane particles and the density of the fluorescent beads were quantified with a digital image analysis system (Metamorph; Universal Imaging, West Chester, PA); there was a linear relationship between these two measurements. To determine the slope of the gradients, for each cortical explant the membrane densities were measured in a narrow stripe (50 × 400 μm) at the beginning (“downhill,” lowest membrane concentration) and the end (“uphill,” highest membrane concentration) of a 600-μm-wide segment centered around the explant. The slope of the gradient was defined as the change (in percent) of the mean concentration from the uphill to the downhill side per 25 μm, the average width of the growth cone.
Tissue culture. Embryonic day 16 embryos were obtained by cesarean section of pregnant Lewis rats. Brains were removed and dissected in 4°C Gey's balanced salt solution. Blocks of neocortical tissue were cut as 200 μm3 using a MacIlwain Tissue Chopper. Explants were grown on laminin–poly-l-lysine (1 mg/ml; Sigma) -coated coverslips covered with homogeneous carpet of membranes (uniform substrate) or membranes gradients. Culture medium was composed of 50% Eagle's basal medium, 25% horse serum, 25% HBSS supplemented with 0.1 mm glutamin, and 6.5 mg/ml glucose (all from Life Technologies, Gaithersburg, MD). Explants were grown for 24 hr before fixation and analysis. Explants located in the linear part of the gradients were selected for analysis, and fiber length was determined with an ocular grid of an inverted microscope equipped with 20× phase-contrast objective. Fiber outgrowth from cortical explants usually occurs in all directions. We analyzed axons growing in the quadrant toward increasing and in the quadrant toward decreasing membrane concentrations. Axons running oblique to the membrane gradients (deviation angle of 45–90°) were excluded, because the change in membrane concentrations encountered by these fibers is different from fibers growing directly uphill or downhill the membrane gradients.
Time-lapse recordings was similar to the method described previously (Hübener et al., 1995). In brief, Petri dishes containing a coverslip with cortical explants were transferred to a chamber on the stage of an inverted microscope (Axiovert 135; Zeiss, Oberkochen, Germany) in which the temperature (37°) and CO2concentration (5%) were kept constant. Images were taken every 5 min during 4 hr periods. To minimize photodynamic damage, a computer-controlled electronic shutter closed the light path after an image had been taken.
RESULTS
Sema3A and Sema3C belong to the class III semaphorins and are secreted proteins that bind to cell membranes and/or extracellular matrix components. Indeed, Sema3A–collapsin was originally purified from brain membrane extracts (Luo et al., 1995). Therefore, we prepared membranes from Sema3A- and Sema3C-expressing HEK 293 cells and untransfected HEK 293 cells as a control to examine the response of cortical axons to stabilized gradients of semaphorins. As illustrated in Figure 1, gradients of sigmoid shapes were formed over a distance of 6–10 mm. The analysis was restricted to 0.6-mm-wide segments centered around the cortical explants (Fig.1A). The gradients prepared by this method were generally linear within the analyzed segments, but they differed in slope and concentration (Fig. 1B).
Fig. 1.
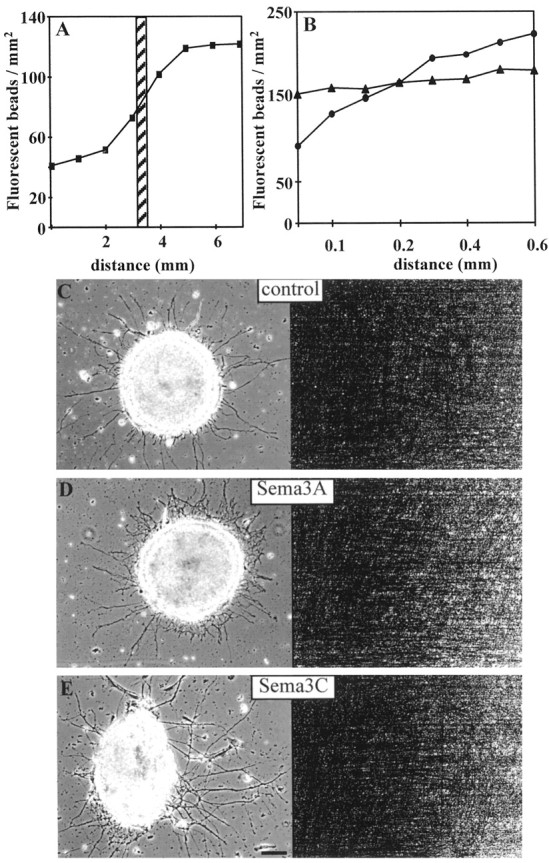
Production of semaphorin gradients.A, Example of a gradient with sigmoid shape over a distance of >6 mm. The dashed box corresponds to the linear part of the gradient that was used for the analysis.B, The linear segments of the analyzed gradients had various slopes [shallow gradient of 0.8% (filled triangles) compared with steep gradient of 6.8% (filled circles)]. C–E, Axons extending from cortical explants placed on membrane gradients prepared from untransfected control cells (C), Sema3A-expressing cells (D), and Sema3C-expressing cells (E). Phase-contrast photomicrographs are shown on the left, and the corresponding fluorescent micrographs visualizing the graded distribution of membrane particles labeled with fluorescent beads are on the right. Scale bar, 150 μm.
Figure 1C–E depicts representative examples of cortical explants placed on gradients prepared with native cortical membranes mixed 1:1 with untransfected HEK 293 cell membranes (Fig.1C, control condition) and with membranes from Sema3A- and Sema3C-producing HEK 293 cells (Fig.1D,E, respectively). Axonal outgrowth from explants placed on untransfected cell membranes is radial, and fibers are equally distributed around the explant and they reach similar length. In contrast, axonal outgrowth on membrane gradients from transfected HEK 293 cells is not uniform. As illustrated in Figure 1D, on Sema3A gradients, less axons are growing toward the side of higher membrane concentration (uphill the gradient), and they are shorter than axons growing toward the side of lower membrane concentration (downhill the gradient). In contrast, more fibers are growing uphill Sema3C gradients, and they are longer than fibers growing downhill Sema3C gradients (Fig. 1E). To quantify these effects, we measured the length of all axons in the quadrant facing the uphill side of the gradients and in the quadrant facing the downhill side of the gradients. Fibers growing oblique to the direction of the gradients were excluded from the analysis, because these fibers encounter different slopes of the gradients than fibers growing parallel to the direction of the gradients. As illustrated in Figure 2A, axons extending uphill Sema3A gradients were 27% shorter than fibers extending downhill Sema3A gradients (p < 0.001; Student's unpaired t test). When membranes from Sema3C-expressing cells were used, however, cortical fibers extending on increasing concentration gradients were 49% longer than fibers extending on decreasing concentration gradients (p < 0.001; Student's unpaired ttest) (Fig. 2A). On gradients with membranes prepared from untransfected cells, there was no difference in the length of fibers extending uphill or downhill gradients (p> 0.1). Thus, increasing concentrations of membrane-bound semaphorins (haptotactic effects) and diffusible semaphorin gradients in a plasma gel (chemotactic effects) (Bagnard et al., 1998) evoke similar responses from cortical axons. On the other hand, cortical axons growing toward decreasing concentrations of the chemorepellent Sema3A appeared not to be affected in their growth, and they reached the same length as fibers extending on control membranes (p > 0.1). Fibers growing on decreasing chemoattractive Sema3C gradients were 19% shorter than on control substrates (p < 0.05) (Fig.2A).
Fig. 2.

The response of cortical axons toward semaphorins depends on their spatial distribution. a, Growth on gradients. The length of cortical axons growing on gradients of control membranes or membranes containing Sema3A or Sema3C was determined separately for those growing uphill (filled bars) or downhill (open bars) gradients (n is number of explants; Student's unpaired t test; **p < 0.001; ns, not significant).b, Growth on homogeneous substrates. Eachdot corresponds to the mean axonal length measured for different explants on uniform substrates of control membranes (open squares), Sema3C-containing membranes (filled triangles), or Sema3A-containing membranes (filled circles). The reduction of axonal length was strongly correlated with the concentration of Sema3A, whereas decrease of fiber length induced by Sema3C was independent of its concentration.
The observation that fibers extending on downhill Sema3A gradients were not affected by the presence of this molecule might be simply because Sema3A concentrations on the downhill side are not sufficient to evoke an axonal response. We therefore also examined axonal growth on homogeneous membrane carpets, using similar membrane densities as axons encounter on the downhill side of the prepared gradients. Under these conditions, the length of cortical axons on uniform Sema3A membranes was markedly reduced (34% reduction; p < 0.001). A reduction in fiber length was also observed on homogeneous substrates containing Sema3C (17% reduction; p < 0.05). Strikingly, the reduction of axonal length induced by Sema3A was proportional to the concentration of the molecule (r2= 0.614; p< 0.005), whereas Sema3C elicited a constant decrease in length that was independent of the membrane density (r2= 0.04; p > 0.1). These results indicate that the function of axonal guidance cues depends critically on the spatial context in which they are presented. Increasing and uniform concentrations of Sema3A evoke a strong repulsive response in cortical axons, whereas decreasing amounts of Sema3A do not influence the elongation of these fibers. Likewise, chemoattractive effects by Sema3C are only elicited when cortical axons encounter increasing concentrations of the molecule, but not if they are exposed to uniform or decreasing amounts of Sema3C (Fig.2B).
Given that cortical axons are attracted by increasing concentrations of Sema3C (Bagnard et al., 1998; present results), it was surprising that, compared with control membranes, cortical axons were shorter when exposed to uniform or decreasing concentrations of Sema3C. Previous work indicated that the repulsive effects of Sema3A are caused by the growth cone collapse activity of this molecule (Luo et al., 1993). Does Sema3C, depending on its spatial distribution, also induce growth cone collapse of cortical axons? To address this issue, we used time-lapse imaging to examine axonal growth on Sema3A, Sema3C, and control substrates. The average growth speed of cortical axons on the control substrates was 18.6 μm/hr, and growth cones collapsed only rarely (0.34 collapses/hr). Consistent with previous work, on Sema3A membranes, there was a fourfold increase in the rate of growth cone collapses, and the average growth speed decreased to 8.6 μm/hr (p < 0.001; Student's t test) (Table 1). Strikingly, the net growth speed, i.e., the mean growth speed excluding the periods of growth cone collapse, was not different on control (19.5 μm/hr) and on Sema3A substrates (17.2 μm/hr). In contrast, as depicted in Table 1, on substrates with uniform or decreasing Sema3C concentrations the rate of growth cone collapse was low (0.22 and 0.24 collapses/hr, respectively), but the growth speed was reduced to almost half of the speed observed on control substrates. Thus, the reduction of axonal length on Sema3A substrates is caused by the collapse of growth cones, whereas on uniform Sema3C substrates and downhill Sema3C gradients by a decrease of the growth speed of the fibers. For uphill Sema3C gradients, when this molecule acts as a chemoattractant signal for cortical axons, growth speed was significantly increased compared with control conditions (Table 1).
Table 1.
Axonal growth on Sema3A, Sema3C, and control substrates
| Substrate | Average growth speed μm/hr (including collapses) | Rate of collapse (collapses/hr) | Average growth speed μm/hr (excluding collapses) |
|---|---|---|---|
| Control (n = 6) | 18.6 ± 3.7 | 0.34 ± 0.2 | 19.5 ± 3.3 |
| Sema3A (n = 21) | 8.6 ± 1.2* | 1.35 ± 0.2* | 17.2 ± 3.1ns |
| Sema3C (n = 11) | 10.1 ± 2.8* | 0.22 ± 0.1ns | 11.6 ± 1.9* |
| Downhill Sema3C (n = 9) | 11.3 ± 1.2* | 0.24 ± 0.1ns | 13.6 ± 2.2* |
| Uphill Sema3C (n = 15) | 23.5 ± 2.3* | nd | nd |
Growth speed and rate of growth cone collapse of cortical axons growing on a uniform membrane substrate prepared from untransfected, Sema3A-transfected, and Sema3C-transfected HEK 293 cells and on towards decreasing concentrations (downhill) of Sema3C membrane gradients. Students t test; *p < 0.05; ns, not significant; n, number of axons examined; nd, not determined.
The response of cortical axons to Sema3A and Sema3C gradients was not dependent on the semaphorin concentrations used in the present experiments. The membrane particle density reached by axons on the uphill side in the different experiments varied 8.8-fold, and it ranged from 1.1–9.7 relative units. On the downhill side of the gradients, axons encountered a membrane concentration between 0.8–4.4 units (almost sixfold variation). As illustrated in Figure3, there was no correlation between fiber length and the density of membranes containing Sema3A and Sema3C, on neither the downhill side nor the uphill side of the gradients (downhill: r2 = 0.26,p > 0.1 for Sema3C;r2 = 0.01, p > 0.1 for Sema3A; uphill: r2 = 0.06, p > 0.1 for Sema3C;r2 = 0.25, p > 0.1 for Sema3A). Thus, although for some gradients the relative semaphorin concentration on the uphill side was lower than the concentration on the downhill side of other gradients, in each case effects of semaphorins were only observed for fibers growing uphill but not downhill. For example, in four explants with Sema3A gradients, the relative concentration encountered by axons on the uphill side was <2.9 units, but their length was reduced by >30%. On uniform substrate, such concentrations induced only a reduction by <10%. In contrast, the highest concentration on the downhill side of Sema3A was 3.9, but there was no effect on axonal length. When presented as a uniform substrate, at this concentration Sem3A produced a greater than 30% reduction in axonal length.
Fig. 3.

Influence of semaphorin concentration on axonal length. a, Axonal length at the uphill side of the gradient. On the uphill side of gradients, the average length of cortical axons was higher compared with control gradients when they were exposed to increasing concentrations of Sema3C, whereas it was lower in the case of Sema3A. Under all conditions, the fiber length was independent of the relative semaphorin concentration on the uphill side. b, Axonal length at the downhill side of the gradient. On the downhill side, the average length of cortical axons was shorter in the presence of decreasing concentrations of Sema3C. The magnitude of this effect was identical for all concentrations tested. Strikingly, the inhibition observed on uniform substrate and on the uphill side of Sema3A gradients was not detected when axons were growing toward decreasing Sema3A concentration. Concentrations are indicated as membrane particle × 103/mm2. Open squares, Control membranes; filled circles, Sema3A; filled triangles, Sema3C-containing membranes.
The different membrane concentrations used here also lead to different slopes of the gradients, ranging from 0.3 to 4.1% (14-fold variation), when expressed as percent difference of membrane concentration over 25 μm. As was observed for the variation of the relative concentrations of semaphorins, there was no correlation between slopes of the gradients and the effects on axonal length (downhill:r2 = 0.02 for Sema3C;r2 = 0.01 for Sema3A,p > 0.05; uphill:r2 = 0.36 for Sema3C;r2 = 0.14 for Sema3A,p > 0.05). As already mentioned, we initially restricted our analysis of fiber length to axons that were growing approximately parallel to the directions of the gradients (deviation angle of <45°), because axons emerging from the explants at angles >45° encounter different slopes of the gradients. The results presented here, however, indicate that the slopes of Sema3A and Sema3C gradients does not affect the behavior of cortical growth cones. We therefore reanalyzed several explants and measured the length of axons extending at angles >45° toward the gradient direction. We found that there was no significant difference in axonal length of axons extending parallel or oblique to the gradient direction (length uphill Sema3A gradients: 104.8 ± 6.1 μm for n = 8 “oblique” axons; 97.1 ± 6.3 μm for n = 10 “parallel” axons, p > 0.04; length uphill Sema3C gradients: 309.3 ± 9.1 for n = 12 oblique axons; 296.5 ± 5.2 for n = 10 parallel axons,p > 0.2). Thus, cortical axons are able to read the direction or “sign” of the slope of semaphorin gradients, but their response is over a wide range, independent of the shape and the absolute concentration of these gradients (Fig.4).
Fig. 4.

Influence of the slope of concentration gradients on axonal length. The slope of gradients prepared from control membranes (open squares), or membranes containing Sema3A (filled circles) or Sema3C (filled triangles) did not influence the average axonal length both when axons that grow uphill (a) or downhill (b) the gradients were analyzed. The slope of the concentration gradients are shown as percent difference of membrane density over 25 μm, the average size of a cortical growth cone.
DISCUSSION
We demonstrated in a previous study that Sema3A can act as a chemorepellent and Sema3C as a chemoattractant guidance molecule for cortical axons. Fibers extending toward Sema3A-secreting cell aggregates are short, and they are deflected away from these aggregates. When confronted with alternating stripes of membranes containing Sema3A and control membranes, cortical axons avoid the Sema3A substrate. Sema3C elicits opposite responses; in the stripe assay, fibers grow preferentially in membrane lanes containing Sema3C, and in a gradient of Sema3C produced by aggregates of transfected HEK 293 cells, fibers are long and they turn toward the source of Sema3C (Bagnard et al., 1998). The present findings with membrane gradients indicate that repellent effects of Sema3A and the attractant effects of Sema3C are not observed when axons encounter decreasing concentrations of these molecules. Cortical axons are very sensitive to the direction of concentration gradients, but their response is highly stereotypic and primarily independent of how much and the range over which these concentration vary. As reported here, cortical axons growing down a very shallow decreasing concentration gradient (slope of 0.3%) are not affected by Sema3A, whereas on a uniform substrate (slope of 0%) their growth is strongly reduced. Using our estimates of the relative concentrations on the uphill and downhill side on Sema3A gradients, we demonstrate that a concentration change from 1.15 to 1.22 units over the width of the growth cone exerts a strong effect on fiber growth. However, axons growing down a gradient with more than five times higher Sema3A concentrations, changing from 6.2 to 5.8 units, are not influenced by this repulsive molecule. This property would facilitate process outgrowth by enabling axons to grow without being inhibited by the presence of repulsive guidance cues released from inappropriate territories, as long as they grow away from these regions.
The finding that the length of cortical axons is reduced when they grow downhill Sema3C gradients appears paradoxical, because this molecule exerts a strong attractive effect when axons grow in the opposite direction, uphill the gradient. We noted previously that, on uniform Sema3C substrates, axonal outgrowth and axonal length is reduced compared with control substrates (Bagnard et al., 1998). Based on this assay alone, Sema3C could be classified as a repulsive or repellent cue for cortical axons. The present data with time-lapse imaging of growing axons indicated that the reduction of axonal length on Sema3A and Sema3C substrates is caused by different cellular mechanisms. Sema3A increases the rate of growth cone collapses but has no effect on the net growth speed. Thus, Sema3A is a potent collapse inducer, whereas Sema3C has no significant effect on growth cone retractions. Instead, on substrates with uniform and decreasing concentrations of Sema3C, there is a reduction of the average growth speed compared with neutral substrates. Because the known families of repulsive guidance receptors show almost no sequence similarity in their cytoplasmatic domain, it has been proposed that different classes of repulsive receptors mediate different types of repellent responses (Bashaw and Goodman, 1999). Moreover, in vitro studies withXenopus spinal axons have demonstrated that attractive actions of guidance molecules can in some cases be converted to repulsion by changing the levels of cAMP or cGMP (Ming et al., 1997;Song et al., 1998). It will therefore be interesting to monitor and manipulate the activity of cyclic nucleotide signaling pathways when axons grow uphill and downhill semaphorin gradients.
Recently, there has been much discussion of how axons attracted by long-range guidance to intermediate targets do not stall, but rather continue to grow to their ultimate target. For example, netrin-1 released by cells in the floor plate in the ventral midline of the spinal cord and hindbrain attracts commissural axons, which then grow past the midline and extend contralaterally (Kennedy et al., 1994;Colamarino and Tessier-Lavigne, 1995). Given that netrin-1 concentration is highest in the floor plate, how then can axons grow away from the midline? Several mechanisms have been suggested to explain how axons can “ignore” attractive signals once they crossed the midline (Klambt et al., 1991; Goodman, 1996; Kidd et al., 1998, 1999; Brose et al., 1999). The capacity of growth cones to ignore decreasing concentration of chemoattractants may represent one of the strategies allowing axons to grow past intermediate targets. An alternative explanation would be that Sema3C exhibits a repulsive activity when axons encounter decreasing concentration of the factor. Nevertheless, monitoring of axons growing downhill show that, rather than being inhibited, these fibers behave as they would do in vivo in decision regions, slowing down and enlarging growth cones (Stirling and Dunlop, 1995). Thus, decreasing concentration of the attractant signal might represent the loss of the driving force of the signal.
The findings presented here provide new insights into the basic mechanisms of chemotropic guidance. In many studies using functional assays to investigate target-derived chemotropic activities, it was often assumed that the effects would depend on the distance from the growth cone to the target. The closer a growth cone is to a source of a diffusible guidance signal, the higher its response should be to this signal. In a trivial sense, this is always the case; if the concentration of a factor is below a certain threshold, then it has no influence on growth cone behavior. However, as shown here for gradients with semaphorins, there might be a wide range of distances from the target at which growth cones exhibit similar physiological responses. Within certain limits, the only critical parameter of gradients that determine how fibers grow is whether there is an increase or a decrease in the concentration of these guidance molecules. Growth cone guidance by gradients is therefore robust and stereotyped, because it is primarily independent of the exact dimensions of the gradients. It is now an intriguing question to examine how this mechanism is implemented at the level of the growth cone (or perhaps along the axon). Evolution might have selected such a mechanism because, in nervous tissue in which complex patterns of connections are being formed, it may be difficult to produce highly reproducible gradients of wiring signals with well defined slopes and with well adjusted absolute concentrations. The results presented here suggest that, even if gradients of wiring molecules vary to some extent from one brain to another, brains are still wired the same way.
Footnotes
This work was supported by the Human Frontiers Science Program and Deutsche Forschungsgemeinschaft Grant Pu102/4–2. We thank Susan Amara for helpful comments on this manuscript.
Correspondence should be addressed to Jürgen Bolz, Universität Jena, Institut für Allgemeine Zoologie, Erberstrasse 1, 07743 Jena, Germany. E-mail:bolz@pan.zoo.uni-jena.de.
REFERENCES
- 1.Adams RH, Lohrum M, Klostermann A, Betz H, Püschel AW. The chemorepulsive activity of secreted semaphorins is regulated by furin-dependent proteolytic processing. EMBO J. 1997;16:6077–6086. doi: 10.1093/emboj/16.20.6077. [DOI] [PMC free article] [PubMed] [Google Scholar]
- 2.Bagnard D, Lohrum M, Uziel D, Püschel AW, Bolz J. Semaphorins act as attractive and repulsive guidance signals during the development of cortical projections. Development. 1998;125:5043–5053. doi: 10.1242/dev.125.24.5043. [DOI] [PubMed] [Google Scholar]
- 3.Baier H, Bonhoeffer F. Axon guidance by gradients of a target-derived component. Science. 1992;255:472–475. doi: 10.1126/science.1734526. [DOI] [PubMed] [Google Scholar]
- 4.Baier H, Klostermann S. Axon guidance and growth cone collapse in vitro. Neuroprotocols: Companion Methods. Neurosci. 1994;4:96–105. [Google Scholar]
- 5.Bashaw GJ, Goodman CS. Chimeric axon guidance receptors: the cytoplasmic domains of slit and netrin receptors specify attraction versus repulsion. Cell. 1999;97:917–926. doi: 10.1016/s0092-8674(00)80803-x. [DOI] [PubMed] [Google Scholar]
- 6.Brose K, Bland KS, Wang KH, Arnott D, Henzel W, Goodman CS, Tessier-Lavigne M, Kidd T. Slit proteins bind Robo receptors and have an evolutionarily conserved role in repulsive axon guidance. Cell. 1999;96:795–806. doi: 10.1016/s0092-8674(00)80590-5. [DOI] [PubMed] [Google Scholar]
- 7.Colamarino SA, Tessier-Lavigne M. The role of the floor plate in axon guidance. Annu Rev Neurosci. 1995;18:497–529. doi: 10.1146/annurev.ne.18.030195.002433. [DOI] [PubMed] [Google Scholar]
- 8.Gierer A. Development of projections between areas of the nervous system. Biol Cybern. 1981;42:69–78. doi: 10.1007/BF00335161. [DOI] [PubMed] [Google Scholar]
- 9.Goodhill G. Diffusion in axon guidance. Eur J Neurosci. 1997;9:1414–1421. doi: 10.1111/j.1460-9568.1997.tb01496.x. [DOI] [PubMed] [Google Scholar]
- 10.Goodman CS. Mechanisms and molecules that control growth cone guidance. Annu Rev Neurosci. 1996;19:341–377. doi: 10.1146/annurev.ne.19.030196.002013. [DOI] [PubMed] [Google Scholar]
- 11.Götz M, Novak N, Bastmeyer M, Bolz J. Membrane bound molecules in rat cerebral cortex regulate thalamic innervation. Development. 1992;116:507–519. [Google Scholar]
- 12.Hübener M, Götz M, Klostermann S, Bolz J. Guidance of thalamocortical axons by growth-promoting molecules in the developing rat cerebral cortex. Eur J Neurosci. 1995;7:1963–1972. doi: 10.1111/j.1460-9568.1995.tb00719.x. [DOI] [PubMed] [Google Scholar]
- 13.Kennedy TE, Serafini T, De la Torre JR, Tessier-Lavigne M. Netrins are diffusible chemotropic factors for commissural axons in the embryonic spinal cord. Cell. 1994;78:425–435. doi: 10.1016/0092-8674(94)90421-9. [DOI] [PubMed] [Google Scholar]
- 14.Kidd T, Russell C, Goodman CS, Tear G. Dosage-sensitive and complementary functions of roundabout and commissureless control axon crossing of the CNS midline. Neuron. 1998;20:25–33. doi: 10.1016/s0896-6273(00)80431-6. [DOI] [PubMed] [Google Scholar]
- 15.Kidd T, Bland KS, Goodman CS. Slit is the midline repellent for the robo receptor in Drosophila. Cell. 1999;96:785–794. doi: 10.1016/s0092-8674(00)80589-9. [DOI] [PubMed] [Google Scholar]
- 16.Klambt C, Jacobs JR, Goodman CS. The midline of the Drosophila central nervous system: a model for the genetic analysis of cell fate, cell migration, and growth cone guidance. Cell. 1991;64:801–815. doi: 10.1016/0092-8674(91)90509-w. [DOI] [PubMed] [Google Scholar]
- 17.Lumsden AGS, Davies AM. Earliest sensory nerve fibres are guided to peripheral targets by attractants other than nerve growth factor. Nature. 1983;306:786–788. doi: 10.1038/306786a0. [DOI] [PubMed] [Google Scholar]
- 18.Luo Y, Raible D, Raper JA. Collapsin: a protein in brain that induces the collapse and paralysis of neuronal growth cones. Cell. 1993;75:217–227. doi: 10.1016/0092-8674(93)80064-l. [DOI] [PubMed] [Google Scholar]
- 19.Luo Y, Shepherd I, Li J, Renzi MJ, Chang S, Raper JA. A family of molecules related to collapsin in the embryonic chick nervous system. Neuron. 1995;14:1131–1140. doi: 10.1016/0896-6273(95)90261-9. [DOI] [PubMed] [Google Scholar]
- 20.Messersmith EK, Leonardo ED, Shatz CJ, Tessier-Lavigne M, Goodman CS, Kolodkin AL. Semaphorin III can function as a selective chemorepellent to pattern sensory projections in the spinal cord. Neuron. 1995;14:949–959. doi: 10.1016/0896-6273(95)90333-x. [DOI] [PubMed] [Google Scholar]
- 21.Ming G-L, Song H-J, Berninger B, Holt CE, Tessier-Lavigne M, Poo MM. cAMP-dependent growth cone guidance by netrin-1. Neuron. 1997;19:1225–1235. doi: 10.1016/s0896-6273(00)80414-6. [DOI] [PubMed] [Google Scholar]
- 22.Pini A. Chemorepulsion of axons in the developing mammalian central nervous system. Science. 1993;261:95–98. doi: 10.1126/science.8316861. [DOI] [PubMed] [Google Scholar]
- 23.Polleux F, Giger RJ, Ginty D, Kolodkin A, Ghosh A. Patterning of cortical efferent projections by Semaphorin–Neuropilin interactions. Science. 1998;282:1904–1906. doi: 10.1126/science.282.5395.1904. [DOI] [PubMed] [Google Scholar]
- 24.Püschel AW. The semaphorins: a family of axonal guidance molecules? Eur J Neurosci. 1996;8:1317–1321. doi: 10.1111/j.1460-9568.1996.tb01593.x. [DOI] [PubMed] [Google Scholar]
- 25.Püschel AW, Adams RH, Betz H. Murine semaphorins D/collapsin is a member of a divers gene family and creates domains inhibitory for axonal extension. Neuron. 1995;14:941–948. doi: 10.1016/0896-6273(95)90332-1. [DOI] [PubMed] [Google Scholar]
- 26.Rosentreter SM, Davenport RW, Löschinger J, Huf J, Jung J, Bonhoeffer F. Response of retinal ganglion cell axons to striped linear gradients of repellent guidance molecules. J Neurobiol. 1998;37:541–562. [PubMed] [Google Scholar]
- 27.Song HJ, Ming GL, He Z, Lehmann M, Mckerracher L, Tessier-Lavigne M, Poo MM. Conversion of neuronal growth cone responses from repulsion to attraction by cyclic nucleotides. Science. 1998;281:1515–1518. doi: 10.1126/science.281.5382.1515. [DOI] [PubMed] [Google Scholar]
- 28.Stirling RV, Dunlop SA. The dance of the growth cones: where to next? Trends Neurosci. 1995;18:111–115. [PubMed] [Google Scholar]
- 29.Tessier-Lavigne M, Goodman CS. The molecular biology of axon guidance. Science. 1996;274:1123–1133. doi: 10.1126/science.274.5290.1123. [DOI] [PubMed] [Google Scholar]
- 30.Tessier-Lavigne M, Placzek M, Lumsden AGS, Dodd J, Jessell TM. Chemotropic guidance of developing axons in the mammalian central nervous system. Nature. 1988;336:775–778. doi: 10.1038/336775a0. [DOI] [PubMed] [Google Scholar]