

Abstract
The embryonic forebrain germinal zone contains two separate and additive populations of epidermal growth factor (EGF)- and fibroblast growth factor (FGF)-responsive stem cells that both exhibit self-renewal and multipotentiality. Although cumulative S phase labeling studies have investigated the proliferation kinetics of the overall population of precursor cells within the forebrain germinal zone through brain development, little is known about when and how (symmetrically or asymmetrically) the small subpopulations of stem cells are proliferating in vivo. This has been determined by injecting timed-pregnant mice with high doses of tritiated thymidine (3H-thy) to kill any stem cells proliferating within the striatal germinal zone in vivoand then by assaying for neurosphere formation in vitro. Injections of 0.8 mCi of 3H-thy given every 2 hr for 12 hr to timed-pregnant mice at E11, E14, and E17 resulted in significant depletions in the number of neurospheres generated by FGF-responsive stem cells at E11 and by EGF-responsive and FGF-responsive stem cells at E14 and E17. With increasing embryonic age, the depletions observed in the number of neurospheres generated in vitro in response to FGF2 after exposure to 3H-thy in vivo decreased, suggesting there is an increase in the length of the cell cycle of FGF-responsive neural stem cells through embryonic development. The results suggest that the FGF-responsive stem cell population expands between E11 and E14 by dividing symmetrically, but switches to primarily asymmetric division between E14 and E17. The EGF-responsive stem cells arise after E11, and their population expands through symmetric divisions and through asymmetric divisions of FGF-responsive stem cells.
Keywords: stem cells, cell cycle, symmetric divisions, asymmetric divisions, 3H-thymidine, embryonic forebrain
In vitro studies have shown that the forebrain germinal zone and its adult remnant, the subependyma, contain a small population of epidermal growth factor (EGF)-responsive and fibroblast growth factor (FGF)-responsive neural stem cells (Reynolds et al., 1992; Reynolds and Weiss, 1992;Morshead et al., 1994; Gritti et al., 1996), which display the definitive characteristics of stem cells, self-renewal and multipotentiality (Hall and Watt, 1989; Potten and Loeffler, 1990;Reynolds and Weiss, 1996). Although the proliferation kinetics of neural stem cells have been investigated in the adult mouse brain (Morshead et al., 1994, 1998), the fundamental questions concerning how these separate populations of neural stem cells are established and how they proliferate during forebrain development in vivoremains mostly unknown.
FGF-responsive neural stem cells can be isolated in vitrofrom the developing forebrain as early as embryonic day 8.5 (E8.5) (Tropepe et al., 1999). The numbers of isolated stem cells that proliferate in response to FGF2 increase with increasing embryonic age (Tropepe et al., 1999). This suggests that the stem cell is proliferating symmetrically to expand its population in vivo. A separate and additive population of EGF-responsive stem cells, thought to arise from the earlier born FGF-responsive stem cells, appears between E11 and E13 (Tropepe et al., 1999). In the present study we sought to determine when these two populations of stem cells are proliferating symmetrically (to expand their populations) and asymmetrically (to produce separate progenitor cells).
Using either the cumulative S phase labeling method or percent labeled mitoses method with either 3H-thy or bromodeoxyuridine (BrdU), the average proliferation kinetics have been estimated for the populations of cells that make up the germinal zone of the embryonic striatum (Bhide, 1996) and cortex (Waechter and Jaensch, 1972; Takahashi et al., 1993; Reznikov et al., 1995; Takahashi et al., 1995; Cai et al., 1997). The neural stem cell populations within these primordial zones are very small, <1% of all germinal zone cells (Tropepe et al., 1999). Conventional labeling techniques, which study population averages, would not be able to detect the presence of such a small subpopulation of stem cells within the larger precursor population, even if the kinetics of the stem cells differed from their progeny (Cai et al., 1997). To reveal the proliferation kinetics of stem cells, we used high doses of3H-thy to kill off proliferating cellsin vivo and then isolated cells from the striatal germinal zone to see if there were any stem cells left to form neurospheresin vitro. Exposure of cells to high doses of3H-thy of high specific activity is known to kill proliferating cells by intranuclear radiation (Painter et al., 1958; Drew and Painter, 1959; Becker et al., 1965; Lajtha et al., 1969;Morshead et al., 1994, 1998). Accordingly, if the stem cells were proliferating at the time of exposure to3H-thy, then they would incorporate the nucleotide into their DNA, die, and fail to form neurospheres in vitro. Our data show that the length of the cell cycle of FGF-responsive stem cells increases between E11 and E17. Between E11 and E14 the FGF-responsive stem cells proliferate rapidly and symmetrically to increase the size of their population, but then these FGF-responsive stem cells switch to primarily asymmetric division between E14 and E17. Between E11 and E14, an EGF-responsive stem cell emerges and possesses a relatively long cell cycle time. This population then expands during embryogenesis by symmetric division and by asymmetric division of the FGF-responsive stem cell.
MATERIALS AND METHODS
3H-thy kill paradigms.Timed-pregnant CD1 mice (Charles River, St. Constant, Quebec, Canada) were used, and the presence of a vaginal plug was designated as E1. At either 11, 14, or 17 d of gestation the dams were divided into two groups, one that was injected with saline and one that was injected with 3H-thy (specific activity, 50 Ci/mmol, 1.0 mCi/ml; ICN Biochemicals, Costa Mesa, CA). The animals were injected intraperitoneally with either 0.8 mCi3H-thy or an equivalent volume (0.8 ml) of the saline vehicle every 2 hr for 12 hr. In two additional experiments, timed pregnant mice at 14 d of gestation were injected with 0.8 ml saline vehicle or 0.8 mCi of 3H-thy every 2 hr for either 6 or 20 hr.
Dissection and in vitro neurosphere assay. Two hours after the last injection, the mice were killed by cervical dislocation. In contrast with analyses using conventional cumulative labeling in vivo (during which a group of animals is killed after each injection), animals that were injected with high doses of3H-thy at each age were killed only after receiving several injections because of the high cost of using such high doses of 3H-thy. For the neurosphere assay, four embryos were removed from each dam, two from each uterine horn. At E11, E14, and E17 the striatal primordia were dissected from each embryo in Dulbecco's PBS (Life Technologies, Gaithersburg, MD). At E11 these dissections included the striatal and pallidal ventricular zones, whereas at later ages the dissections included the striatal and pallidal ventricular and subventricular zones. Throughout the rest of the paper the dissected tissue will be referred to as the striatal germinal zone. The tissue from each embryo was transferred to serum-free media and triturated into single cells. Cells were cultured in duplicate at a density of 50 cells/μl in 24 well plates containing chemically defined SFM (DMEM–F12, 1:1; Life Technologies; 5 mm HEPES buffer, 0.6% glucose, 3 mm NaHCO3, 2 mm glutamine, 25 μg/ml insulin, 100 μg/ml transferrin, 20 nm progesterone, 60 μm putrescine, and 30 nmsodium selenite) in the presence of either EGF (20 ng/ml; purified from mouse submaxillary gland; Upstate Biotechnology, Lake Placid, NY) or FGF2 (10 ng/ml; human recombinant; Upstate Biotechnology) and heparin (2 μg/ml; Sigma, St. Louis, MO). To determine if any of the decrease observed in the number of neurospheres that were generated in vitro was the result of stem cells incorporating the3H-thy in vitro from dying cells, cells from each embryo were cultured in duplicate in defined growth factor supplemented media containing cold thymidine (Sigma) and 2′-deoxycytidine (Sigma) at concentrations of 100 and 20 μg/ml, respectively. The total number of neurospheres that formed in each well was counted after 6 d in vitro (DIV). The data are reported as the mean number of neurospheres (± SEM) formed from one dam, which is the average of the results from four embryos per dam. To determine that the neurospheres generated from striatal germinal zone tissue in all of the groups were derived from stem cells, we assayed for self-renewal and multipotentiality as previously described (Tropepe et al., 1999).
Incorporation of BrdU in vitro. After 12 hr of injections of3H-thy at E11, striata were dissected from four embryos per dam and dissociated into single cells in SFM. Before culture, Trypan Blue exclusion was used to determine the absolute number of cells (viable and dead) from each dissection. Single cells were cultured at 50 cells/μl in wells of a 24 well culture plate that were previously coated with polyornithine and that contained serum-free media supplemented with FGF2 (10 ng/ml) and heparin (2 μg/ml). After 6 hr, 5 μl of BrdU (0.2 mg/ml) were added to each well. The cells were incubated with BrdU for 20 hr, at which time half the wells for each group were fixed with 4% paraformaldehyde for 20 min, while the other half were stained with Trypan Blue to determine the percentage of viable cells in each group after 1 DIV. This was done by counting the total number of cells (viable and dead) in two 1 mm2 grid areas at 100× magnification. The cells were processed for BrdU immunohistochemistry as previously described (Craig et al., 1996). Cells were exposed to 1 mHCl for 30 min at 65°C to denature cellular DNA. Rat anti-BrdU (1:100; Seralab, London, UK), followed by fluorescein isothiocyanate-conjugated donkey anti-rat (Jackson ImmunoResearch, West Grove, PA) were used for BrdU staining. The percentage of cells that were BrdU-positive were determined for each group by counting the number of labeled and unlabeled cells in four 1 mm2 grid areas per well at 100× magnification.
Incorporation of 3H-thy into DNA. Immediately after the 12 hr of injections at either E11, E14, or E17 striata were dissected from four embryos per dam and frozen at −70°C. For the determination of the amount of 3H-thy incorporated into the DNA of proliferating cells, striata were incubated in an extraction buffer (50 mm Tris-HCl, pH 8.0; 100 mm EDTA; 100 mm NaCl; 1% SDS; 0.5 mg/ml Proteinase K, 14 mg/ml, Boehringer Mannheim, Indianapolis, IN) overnight at 55°C. Protein and lipids were removed by the addition of saturated NaCl (∼6 m). DNA was precipitated with an equal volume of isopropanol, and the resultant pellet was washed with 70% ethanol. The pellet was air-dried and resuspended in Tris-EDTA (TE) buffer, pH 8.0. The DNA concentration was determined measuring the absorption of UV light at 260 nm on a Beckman DU-8B spectrophotometer. For scintillation counting duplicate samples were prepared by pipetting 100 μl samples of the DNA suspension onto 2.4 cm glass fiber filter circles (Fisher Scientific, Pittsburgh, PA). After drying, the DNA was precipitated onto the filter circles by running them through the following solutions, 10 min in each solution: 10% TCA, 5% TCA (both dissolved in 0.1 m PBS), 95% ethanol, and 95% ethanol. The filter circles were allowed to air dry completely before putting them in glass vials containing 10 ml of scintillation fluid (Cytoscint). After sitting for 1 hr, the number of scintillations per minute (cpm) for each sample was determined using a Beckman LS 1800 scintillation counter. Background radiation counts were determined using the same protocol, except 100 μl of TE were pipetted onto the glass fiber filter circles. The specific radioactivity was reported as the mean ± SEM cpm/μg DNA per dam, which was the average from the dissections of four embryos per dam.
Estimates of stem cell numbers. The number of stem cells residing within the striatal germinal zone was estimated from the results of the neurosphere assay of embryos from saline-injected dams at E11, E14, and E17. The total number of viable cells per striatal germinal zone dissection was determined by counting a sample of the cell suspension from each embryo using the Trypan Blue exclusion method. Other cells from the suspension were cultured at a density of 50 cells/μl, giving a total of 25,000 viable cells per well. Estimates of the total number of stem cells residing in the striatal germinal zone at E11, E14, and E17 were determined by first dividing the average number of neurospheres generated per well by the number of viable cells plated per well. This number was then multiplied by the total number of viable cells per striatal germinal zone dissection, which was the average number of viable cells from the dissections of four embryos per dam.
RESULTS
Incorporation of 3H-thy in vivo decreases the number of neurospheres that form in vitro
At E11 stem cells isolated from the striatal germinal zone generate clonal aggregates (neurospheres) only in the presence of FGF2. Later in embryogenesis striatal germinal zone stem cells generate neurospheres in response to EGF. There is evidence that separate, additive populations of neural stem cells form neurospheres in response to EGF and FGF2 at E13 and that the EGF-responsive stem cells are the progeny of FGF-responsive stem cells (Tropepe et al., 1999). Stem cells cultured in the presence of both EGF and FGF2 generated numbers of neurospheres that did not differ from what would be expected from adding the number of neurospheres generated in response to either growth factor alone (Tropepe et al., 1999). Chimeric mice with null mutations of the FGF receptor 1 in some of the striatal germinal zone cells fail to develop either FGF-responsive neural stem cells at E11 or separate EGF-responsive neural stem cells at E14 from the mutant cells, although both types of neural stem cells develop from the wild-type striatal germinal zone cells from the same mice (Tropepe et al., 1999). Therefore, given the evidence that there are two separate, lineage-related populations of neural stem cells in the developing forebrain germinal zone (Tropepe et al., 1999), at E14 and E17 the effect of 3H-thy on the number of neurospheres that form in vitro was determined separately for EGF-responsive and FGF-responsive stem cells.
At all three ages dams were injected with 0.8 mCi of3H-thy every 2 hr for 12 hr. From E11 to E17 the baseline numbers of neurospheres generated from saline-treated controls increased with increasing embryonic age. Therefore, the numbers of neurospheres generated after3H-thy treatment were expressed as a percentage of saline-treated controls at each age. Greater depletions of FGF-responsive stem cells were seen at earlier embryonic ages (Fig.1). For FGF-responsive stem cells, an ANOVA comparing the relative number of neurospheres generated across all three ages from saline-treated or3H-thy-treated dams showed a significant effect of drug treatment (F(1,117) = 47.53; p < 0.05), a significant effect of age (F(2,117) = 4.36; p < 0.05), and a significant drug × age interaction (F(2,117) = 4.36; p < 0.05). Incorporation of the 3H-thy into proliferating striatal germinal zone cells at E11, E14, and E17 resulted, respectively, in ∼88, 60, and 27% depletions of FGF-responsive stem cells compared to saline-treated controls (Fig. 1). Injections of 3H-thy depleted the number of neurospheres generated in FGF2 at E11 significantly more than at either E14 (t40 = 2.86;p < 0.05) or E17 (t30= 4.79; p < 0.05). With increasing embryonic age, there was a significant decrease in the percentage of stem cells depleted after exposure to 3H-thy, suggesting there was a change in the kinetics of the FGF-responsive stem cells over time.
Fig. 1.

Comparison of the numbers of neurospheres formed in either EGF or FGF2 after incorporation of 3H-thy at E11, E14, and E17 expressed as a percentage of saline-treated controls. The 100% saline control value for each age group is not shown. At E11, neurospheres do not form when cells are cultured in EGF. Data represent means ± SEM. [E11, n = 12 dams (average counts from four embryos per dam); E14, n = 30 dams; E17, n = 20 dams].
Incorporation of 3H-thy into the proliferating striatal germinal zone cells at both E14 and E17 resulted in a depletion of ∼35–40% of EGF-responsive stem cells compared to saline-treated controls (Fig. 1). An ANOVA comparing the relative numbers of EGF-derived neurospheres generated at E14 and E17 from saline-treated or 3H-thy-treated dams showed a significant overall effect of3H-thy treatment (F(1,98) = 6.362; p < 0.05), but no effect of age (p > 0.05) and no interaction between the two (p > 0.05). There was no difference observed in the percent depletion of EGF-responsive stem cells between E14 and E17, suggesting the kinetics of this separate population of neural stem cells do not change over this time.
Proportions of the stem cells at both E14 and E17 (40–73%) remain, after exposure to 3H-thy for 12 hr. Assuming single population kinetics for FGF-responsive stem cells, it can be hypothesized that the length of the cell cycle of FGF-responsive stem cells increased between E11 and E14 and again between E14 and E17. This hypothesis predicts that injecting3H-thy for >12 hr at either E14 or E17 might deplete further the number of neurospheres generated in vitro in response to EGF or FGF2. Alternatively, if there are two separate cycling populations within each of the EGF- and FGF-responsive stem cell populations at E14 or E17, then the stem cells labeled within 12 hr represent a population with a shorter cell cycle time, whereas those that don't incorporate 3H-thy during the 12 hr may represent a population of cells with a longer cell cycle time (Waechter and Jaensch, 1972; Nowakowski et al., 1989). The two population assumption would again predict that injecting3H-thy for >12 hr at either age would further deplete the number of neurospheres generated in vitro in response to EGF or FGF2, by depleting more of the stem cells that have longer cell cycle times.
3H-thy release in vitro does not account for the depletion of neurospheres
The decrease in the relative numbers of neurospheres depleted compared to saline controls suggests that the stem cells were proliferating at the time of exposure to the nucleotide in vivo. This conclusion is based on the lack of neurosphere formation in vitro. It is also possible that some of the effects of 3H-thy could have been the result of in vitro nucleotide release from dying cells into the wells of the culture dish, the subsequent incorporation of3H-thy into proliferating stem cellsin vitro, and then stem cell death as the cells attempt to undergo mitosis and form neurospheres in vitro. This latter result would decrease the numbers of neurospheres that form after culturing the cells for 6 d in vitro, but the decrease would be misinterpreted as being representative of how many stem cells were proliferating in vivo.
Before we could rule out this in vitro kill explanation, we determined the state of the cells within the first 24 hr of culture. The viability of the cells isolated from saline and3H-thy-treated dams at E11 were determined immediately after the 12 hr of exposure to3H-thy and after the first 24 hr of culture. The ability of the cells to continue to proliferate in vitro after exposure to 3H-thyin vivo was examined by incubating the cells in the presence of BrdU for 20 hr. After dissection of the striatal germinal zone, Trypan Blue exclusion revealed that the absolute number of cells per dissection did not differ between saline-treated embryos (706,667 ± 62,198 cells) and 3H-thy-treated embryos (742,500 ± 72 253 cells). The percentage of the absolute number of cells that were viable also did not differ between saline-treated embryos (89.4 ± 1.56%) and3H-thy-treated embryos (89 ± 0.53%). However, after ∼24 hr in vitro, the total number of cells was significantly less in wells of3H-thy-treated embryos (55.6 ± 5.73 cells/mm2) than that observed in wells of saline-treated animals (104.2 ± 9.41 cells/mm2) (t17 = 4.66; p < 0.05). Furthermore, the percentage of viability was significantly higher in wells of saline-treated embryos (77.7 ± 0.06%) than that observed in wells of 3H-thy-treated embryos (64.8 ± 4.38%) (t17 = 2.96; p < 0.05). Thus, more than half of the cells that took up 3H-thy in vivo had died during the first 24 hr in vitro. Incubation of the cells in each well with BrdU for 20 hr resulted in 31.0 ± 7.14% of cells staining positive for BrdU in wells of saline-treated embryos compared to only 9.1 ± 0.70% of cells staining positive for BrdU in wells of 3H-thy-treated embryos (t18 = 9.87; p < 0.05). Altogether, the data suggest that the cells from3H-thy-treated animals are more likely to die, and those that have survived are less likely to proliferate, within the first 24 hr of culture. Considering the fact that up to 100% of the germinal zone cells are proliferating at this time (Cai et al., 1997), the data indicate that after3H-thy exposure a majority of the proliferating cells have been lost, either killed or permanently arrested in Go. It is important to note that although high doses of 3H-thy are known to kill proliferating cells we are not assaying for cell death, only the lack the neurosphere formation. Therefore, it is important to determine what prevents the neurospheres from formingin vitro after exposure to3H-thy in vivo. Given that some of the germinal zone cells are still capable of proliferating after3H-thy exposure, it is critical to show that if the cells are dying in vitro it is the result of germinal zone cells incorporating the nucleotide into their DNAin vivo and not after exposure to the nucleotide in vitro.
To rule out this in vitro kill explanation, dissociated striatal cells from embryos treated in vivo with3H-thy or saline vehicle were cultured in the presence of high doses of nonradioactive (cold) thymidine and 2′-deoxycytidine (Hasthorpe and Harris, 1979). High doses of cold thymidine will compete with the 3H-thy for incorporation into the DNA of cells in S phase. The high dose of cold thymidine needed to prevent incorporation of3H-thy into the DNA is cytotoxic in and of itself unless 2′-deoxycytidine is also added to the culture medium (Bjursell and Reichard, 1973). After3H-thy treatment at E11 the depletions in the absolute number of neurospheres generated in the presence of cold thymidine were the same as those observed in the numbers of neurospheres generated in its absence (Fig.2). An ANOVA comparing the absolute numbers of neurospheres generated from dams injected with saline or3H-thy at E11 and cultured in the presence or absence of cold thymidine and 2′-deoxycytidine showed a significant effect of in vivo drug treatment on the formation of neurospheres (F(1,38) = 14.46;p < 0.05), but no effect of the absence or presence of cold thymidine, nor any interaction. Depletions in neurospheres by3H-thy in vivo also were similar in the presence or absence of cold thymidine and 2′-deoxycytidine when dams were injected with3H-thy at E14 and E17. Therefore, we conclude that the decrease in the number of neurospheres generatedin vitro from striata at E11, E14, and E17 was a result of neural stem cells dying or becoming permanently arrested inGo only after incorporating3H-thy in vivo. Either explanation supports our initial hypothesis that if the stem cells were proliferating at the time of exposure to the high doses of3H-thy in vivo they would incorporate the nucleotide and fail to form neurospheres in vitro.
Fig. 2.

The numbers of neurospheres cultured at E11 in the absence or presence of cold thymidine and 2′-deoxycytidine. Culturing striatal germinal zone cells in the presence of unlabeled nucleotides does not affect the depletion observed in the number of neurospheres that form in vitro after in vivoincorporation of high doses of 3H-thy. Data represent the means ± SEM of the numbers of neurospheres generated per well (25,000 viable cells per well) from saline (n = 9 dams) and 3H-thy (n = 12 dams)-treated dams (mean of four embryos per dam).
It is also possible that the nucleotide in vitro may have produced more subtle effects on the growth of neurospheres, their passaging, and their differentiation potential. High doses of thymidine have been observed to inhibit the completion of S phase and hence of mitosis (Bjursell and Reichard, 1973). This hypothesis might imply that the depletion in the number of neurospheres in vitro may be a result of a delay in neurosphere formation. To test this possibility, neurospheres were counted after 9 d in vitro (rather than the 6 d initially used), after which we might see the full complement of neurospheres from3H-thy-injected animals compared to those injected with saline. At E11, after exposure to3H-thy, the numbers of neurospheres were counted at 6 d in vitro and again after 9 din vitro. There was no difference observed between the number of neurospheres counted after 6 d compared to after 9 d from saline-treated ( 6 d = 63.8 ± 16.41; 9 d = 63.8 ± 17.17; t4 = 0;p > 0.05) or3H-thy-treated ( 6 d = 7.5 ± 3.76; 9 d = 7.2 ± 3.93;t6 = 0.06; p > 0.05) dams. Therefore, regardless of how 3H-thy is affecting the cells, whether it is killing them or not, after3H-thy treatment the stem cell is unable to form a sphere. Given that the effect of3H-thy on neurosphere formation cannot be rescued either with cold thymidine or by culturing the cells for longer periods of time, we conclude that the stem cells were proliferating at the time of exposure to 3H-thy in vivo and were killed or prevented from proliferating as a result.
To determine if the stem cells remaining after exposure to3H-thy at E11, E14 and E17 still retained their characteristics of self-renewal and multipotentiality, neurospheres generated at each age from both saline-injected and3H-thy-injected animals were passaged and processed for immunohistochemistry with cell-specific antibodies (anti-MAP2 for neurons, anti-GFAP for astrocytes, and anti-O4 for oligodendrocytes). Single neurospheres from saline or3H-thy treated animals, generated from each of the E11, E14, and E17 striatal germinal zones, were successfully passaged for three generations in EGF or FGF2. Also, single neurospheres, generated from E11, E14, and E17 striatal germinal zones after saline or 3H-thy treatmentin vivo and then differentiated in vitro, contained neurons, astrocytes, and oligodendrocytes. Therefore, injecting pregnant mice with high doses of3H-thy does not block the ability of the individual remaining neurospheres generated in vitro to be passaged or for their cells to differentiate into neurons, astrocytes and oligodendrocytes in vitro.
The incorporation of 3H-thy into DNA of striatal germinal zone cells is less at E17 than at E11
For FGF-responsive stem cells the relative numbers of neurospheres depleted at E11, E14, or E17 (compared to controls at the same ages) decreased with increasing embryonic age. There are two possibilities that could explain these results: (1) the dose of3H-thy used was insufficient to kill the cells that had incorporated the nucleotide throughout its administration at the older ages and (2) the kinetics of the stem cells have changed (see below). The first possibility was tested by determining the amount of 3H-thy incorporated into the DNA of striatal germinal zone cells at E11, E14, and E17. Less 3H-thy was incorporated per microgram of DNA at E17 than at the earlier embryonic ages (Fig.3). An ANOVA comparing the amounts of3H-thy incorporated per microgram of DNA extracted from striatal germinal zone cells after saline or3H-thy treatment at E11, E14, and E17 showed a significant effect of drug (F(1,70) = 77.60; p < 0.05), age (F(2,70) = 6.98;p < 0.05), and a significant drug × age interaction (F(2,70) = 6.76;p < 0.05). There was no significant difference in the radioactivity incorporated into the DNA at E14 compared to E11 (t22 = 1.05; p > 0.05) . However, the amount of 3H-thy incorporated into the DNA of cells within the striatal germinal zone was significantly less at E17 than at E11 (t22 = 4.93; p < 0.05) or at E14 (t30 = 3.01;p < 0.05). Based on these results, it remains unclear whether the decrease in the depletion of neurospheres at E17 by3H-thy treatment was a function of increasing cell cycle length with embryonic age or whether at E17 the dose of 3H-thy was not sufficient to kill cells that incorporated the nucleotide.
Fig. 3.

The amount of 3H-thy incorporated per microgram of DNA in striatal germinal zone cells at E11, E14, and E17 after 12 hr of injections of 3H-thy. The specific radioactivity of DNA is significantly lower at E17 than at either E11 or E14. Data represent means ± SEM of the average counts per minute per microgram of DNA determined from bilateral striatal germinal zone dissections of four embryos per saline or3H-thy-treated dam at E11 (n = 8 dams), E14 (n = 16 dams), and E17 (n = 16 dams).
Increasing the dose of 3H-thy at E17 does not further deplete the number of neurospheres formed in vitro or increase the incorporation of 3H-thy in vivo
The first possibility for the decreased depletion of neural stem cells from the striatal germinal zone by3H-thy treatment with increasing embryonic age was further examined by injecting animals with a higher dose of3H-thy at E17. A dose of 0.8 mCi of3H-thy injected every 2 hr for 12 hr was sufficient to kill off the entire constitutively proliferating population of cells, 50% of the stem cells lining the lateral ventricle of the adult mouse brain (Morshead et al., 1994), and clearly can kill stem cells proliferating at earlier embryonic ages (the present results). At E11 this dose, injected every 2 hr for 12 hr, killed up to 90% of stem cells residing in the striatal germinal zone. If the length of the cell cycle of the stem cell does not change over embryonic time (the second explanation), then our alternative (first) explanation for the decreased depletion of stem cells at E17 compared to E11 suggests that the dose of 3H-thy injected over 12 hr is not sufficient to kill off the proliferating cells. Therefore, animals at E17 were injected once every 2 hr for 12 hr with either 0.8 mCi of 3H-thy per injection (low-dose) or 1.6 mCi of 3H-thy per injection (high-dose) to test whether increasing the dose of each injection over a 12 hr period would result in a greater depletion in neurosphere formation. No greater depletion of neurospheres was seen with the higher 3H-thy dose compared to the lower 3H-thy dose (Fig.4A). An ANOVA comparing the absolute numbers of neurospheres generated in EGF or FGF2 after saline treatment or injections of low or high doses of3H-thy at E17 showed no effect of growth factor conditions (F(1,18) = 1.80;p > 0.05), a significant main effect of3H-thy treatment (F(2,18) = 8.26; p > 0.05), but no significant interaction (F(2,18) = 0.10; p > 0.05). Although there was an effect of3H-thy compared to its saline vehicle on the absolute numbers of neurospheres generated, the neural stem cells were equally depleted in the low dose and high dose of3H-thy groups (EGF,t6 = 0.51, p > 0.05; FGF, t6 = 0.67, p > 0.05).
Fig. 4.
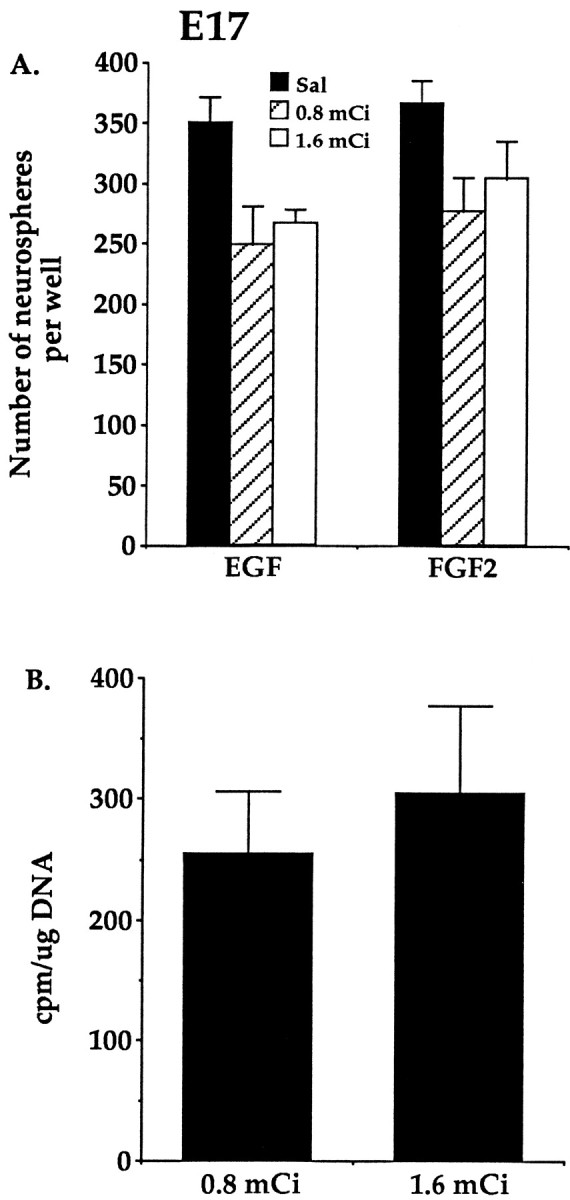
A, The numbers of neurospheres generated in EGF or FGF2 after injections of saline, 0.8 mCi/injection of 3H-thy, or 1.6 mCi/injection of 3H-thy at E17. Injections of a higher dose of 3H-thy do not further decrease the number of neurospheres that form compared to the lower dose of 3H-thy. Data represent means ± SEM of the numbers of neurospheres generated per well (25,000 viable cells per well) from saline (n = 4 dams), low-dose3H-thy (n = 4 dams), and high-dose3H-thy (n = 4 dams)-treated dams (mean of four embryos per dam). B, The specific radioactivity of the DNA extracted from striatal germinal zone cells at E17 after injections of 0.8 mCi/injection of 3H-thy and 1.6 mCi/injection of 3H-thy. Injections of the higher dose of3H-thy do not further increase the incorporation of the nucleotide into the DNA of dividing germinal zone cells compared to the incorporation at the lower 3H-thy dose. Data represent means ± SEM of the average counts per minute per microgram of DNA determined from bilateral striatal germinal zone dissections of four embryos from each of the low-dose 3H-thy (n = 4 dams) and high-dose 3H-thy (n = 4 dams)-treated dams.
Furthermore, no difference was observed between the low-dose group and the high-dose group in the amount of3H-thy incorporated into the DNA of cells dissected from the striatal germinal zone at E17 (t6 = 0.55; p > 0.05) (Fig. 4B). Given that no further decrease in the numbers of neurospheres was seen after injecting animals with a higher dose of 3H-thy and no further increase was seen in 3H-thy incorporation per cell within the germinal zone at E17, we suggest that the3H-thy uptake into the DNA of all cells in S phase over the entire injection period was saturated. Thus, we conclude that the decrease in neural stem cells killed by3H-thy at E17 compared to E11 reflects the longer cell cycle time of stem cells at E17. The lower3H-thy incorporation at E17 than at E11 does not reflect the lack of saturation of the labeling of the DNA at E17, but rather the fact that either fewer cells at E17 were in S phase at the time of exposure to 3H-thy or the E17 dissections included more of the postmitotic striatum than the earlier embryonic dissections.
High doses of 3H-thy do not alter the kinetics of the remaining stem cells proliferating in vivo
Given that the dose of 3H-thy per injection was sufficient to kill all the cells proliferating within 12 hr at each age, the decrease in the relative numbers of FGF-responsive stem cells depleted compared to saline controls with increasing embryonic age was most likely the result of a change in the kinetics of the cells. Two types of changes are possible: (1) the stem cells at the later embryonic ages changed their kinetics to replenish their populations before the cells were cultured to generate neurospheresin vitro, and (2) the length of the cell cycle of the stem cells increased with increasing embryonic age (see below). The first possibility seems unlikely given the 88% depletion in the numbers of neurospheres generated after 3H-thy treatment at E11 compared to saline-treated controls. Moreover, even with long post-kill survival times in vivo, the stem cell populations did not recover to saline vehicle baseline levels when animals were injected at E14 and their striata were dissected out at postmitotic day 56 (P56). The numbers of neurospheres generated from adult mice in either EGF or FGF2 after3H-thy treatment at E14 were significantly less than that of adult mice that had been treated with saline at E14 (EGF, t6 = 3.45, p < 0.05; FGF, t8 = 2.88,p < 0.05). At P56, the E143H-thy-treated mice were smaller than their saline-treated controls, in both body and brain weights, and the percentage of depletion observed in the numbers of neurospheres generated in EGF and FGF2 from P56 mice exposed to3H-thy at E14 was not significantly different from that observed after killing at E14 (p > 0.05). It is likely then that the remaining stem cells after 3H-thy treatment at E14 were not capable of replenishing their populationin vivo through symmetric division. Similar results have been observed after two series of high-dose injections of3H-thy in the subependyma of the adult mouse forebrain (Morshead et al., 1994). When a series of3H-thy treatment was given to adult animals to deplete the constitutively proliferating population (Tc = 12.7 hr) , stem cells were recruited to divide to repopulate the lost progeny. During the recruitment phase, a second series of injections was then given to the same mice, which depleted the proliferating stem cells by 50% (Morshead et al., 1994). Neither the neural stem cell population nor its progeny (the constitutively proliferating population) were replenished to control values after 50% of the stem cells were killed with the second series of 3H-thy injections (Morshead et al., 1994).
Injections of 3H-thy for 6, 12, and 20 hr at E14 results in a linear decrease in the number of neurospheres generatedin vitro
Given that the stem cells were unable to change their kinetics to replenish their population after 3H-thy treatment at E14, we hypothesized that the decreased depletion in neurospheres with increasing embryonic age was a result of the length of the cell cycle increasing with age. According to the method of cumulative S phase labeling, in a population of cells cycling asynchronously with one common cell cycle time each injection of3H-thy would result in a proportional decrease in the number of neurospheres formed in vitro, which (when plotted over time) would be linear. If the injections are given over a long enough period of time, then the stem cell population would eventually be depleted to zero, as more and more of the asynchronously proliferating neural stem cells incorporate the nucleotide and are killed [at least until the injections have covered the length of the entire cell cycle (Tc) minus the length of S phase (Ts)]. At E14, injections of3H-thy every 2 hr for 12 hr resulted in a 60% depletion in the number of neurospheres that formed in vitro in response to FGF2. We predicted that injecting dams for periods shorter or longer than 12 hr would result in depletions in the number of neurospheres consistent with what would be expected under the assumption that the 60% depletion of neurospheres accounted for 60% ofTc-Ts. Therefore, we hypothesized that injecting3H-thy every 2 hr for 6 hr would result in half the depletion observed after 12 hr of injections, given that the animals would receive half the number of injections they received in 12 hr. As well, we also hypothesized that an additional 8 hr of injections would be sufficient to deplete the FGF-responsive stem cell population to zero [if 0.6(Tc −Ts) = 12 hr, thenTc −Ts = 20 hr]. Therefore, dams were injected at E14 with 0.8 mCi 3H-thy every 2 hr for periods of 6, 12, or 20 hr. At the end of each injection period the dams were killed, and the striatal germinal zone was dissected from four embryos from each dam. The cells were cultured in FGF2, and the number of neurospheres were counted after 6 din vitro. Giving more 3H-thy injections over a longer period of time results in a greater depletion in the number of neurospheres formed in vitro (Fig.5). An ANOVA comparing the number of neurospheres formed from saline-treated or3H-thy-treated dams injected for periods of 6, 12, and 20 hr showed a significant effect of drug treatment (F(1,25) = 74.20; p < 0.05), a significant effect of time of exposure to3H-thy (F(2,25) = 13.63; p < 0.05), and a significant drug × time interaction (F(2,25) = 3.73; p < 0.05). The number of FGF-responsive neurospheres generated after 6 hr of 3H-thy injections was significantly greater (a 32% depletion) than that generated after 12 hr of3H-thy injections (a 61% depletion) (t9 = 2.85; p < 0.05) and that generated after 20 hr of 3H-thy injections (a 89% depletion) (t6 = 6.30; p < 0.05). As well, the number of FGF-responsive neurospheres generated after 12 hr of3H-thy injections was significantly greater than that generated after 20 hr of3H-thy injections (t9 = 2.62; p < 0.05). Although it appears that the FGF-responsive population proliferates as a single population with a common cell cycle time, a small population of stem cells remains after 20 hr of3H-thy treatment, which was the predicted amount of time the dams needed to be exposed to3H-thy to deplete the population of FGF-responsive stem cells to zero.
Fig. 5.

The numbers of neurospheres generated in FGF2 after injections of saline or 3H-thy for 6, 12, or 20 hr. The numbers of neurospheres formed after 6 hr of 3H-thy were significantly different from those observed after 12 hr of3H-thy, which were significantly different from those observed after 20 hr of 3H-thy. Data represent means ± SEM of the numbers of neurospheres generated per well (25,000 viable cells per well) from saline- and 3H-thy-treated dams at 6 (saline, n = 4; 3H-thy, n = 4), 12 (saline, n = 8; 3H-thy,n = 7), and 20 hr (saline, n = 4; 3H-thy, n = 4). One dam represents the mean of four embryos.
The greater depletions with 12 and 20 hr of3H-thy injections compared to 6 hr of injections within this experiment is unlikely to be a byproduct of the higher total dose of 3H-thy received in the 12 and 20 hr groups, given that injecting dams at E14 with 2 mCi/injection of 3H-thy (2.5 × each dose) every 2 hr for 12 hr did not significantly increase the relative depletions of neurospheres. Furthermore, from 6 hr of injections to 12 hr of injections there was a significant 3.5-fold increase in the incorporation of 3H-thy into the DNA of germinal zone cells (t6 = 4.14;p < 0.05), and from 12 hr of injections to 20 hr of injections there was a significant 2.5-fold increase in the incorporation of 3H-thy (t5 = 5.30; p < 0.05). Thus, more proliferating cells in vivo were incorporating 3H-thy after 12 and 20 hr than after 6 hr, suggesting more of the cells passed through S phase within 12 and 20 hr than within 6 hr. These data, in combination with greater neurosphere depletions after 12 and 20 hr of3H-thy compared to 6 hr, suggest that more of the FGF-responsive stem cells were passing through S phase and incorporating 3H-thy after being exposed to the nucleotide for longer periods of time. Assuming there is a single population of FGF-responsive stem cells having one common cell cycle time, we conclude that at E14 the cell cycle time is relatively long compared to that predicted for the FGF-responsive stem cells at E11. Given that only 89% of the stem cells were depleted after 20 hr of 3H-thy treatment, we conclude that there must be a relatively small second population of proliferating FGF-responsive stem cells with a very long cell cycle time. In the adult mouse forebrain, stem cells residing in the subependyma have a relatively long cell cycle time, estimated to be at least 15 d in length (Morshead et al., 1998). Perhaps a very small fraction of the forebrain FGF-responsive stem cells at E14 (∼10%) already have changed their cell cycle time to that estimated for stem cells in the adult forebrain.
The numbers of stem cells within the striatal germinal zone increase through the embryonic period
The symmetric versus asymmetric division patterns of neural stem cells through embryogenesis were estimated, given the absolute numbers of neurospheres generated in vitro from the populations of striatal germinal zone cells dissected from embryos at E11, E14, and E17. These absolute estimates depend on the assumptions that (1) after initial dissection, cell viability is equally high, (2) the neurosphere assay is optimal to select for the survival and proliferation of all neural stem cells residing in the striatal germinal zone, and (3) there is no cell death in the stem cell populations over time. Between E11 and E14 the number of FGF-responsive stem cells increases 12-fold (Fig.6). This suggests that the stem cell is undergoing symmetric divisions to increase the size of its population over this 3 d period. However, over the 3 d period between E14 and E17 the size of the FGF-responsive stem cell population increases by only twofold. There are two possible explanations for the smaller expansion observed in the number of FGF-responsive stem cells between E14 and E17 than between E11 and E14. (1) These data suggest that symmetric divisions within the FGF-responsive stem cell population occur more frequently between E11 and E14 than between E14 and E17 and that between E14 and E17 the mode of division has switched to more asymmetric divisions because the stem cell population expands only twofold over the later 3 d period compared to the 12-fold increase over the earlier 3 d embryonic period. (2) The FGF-responsive stem cell divides symmetrically throughout the embryonic period, and the change in the expansion rate is a function of an increase in the cell cycle time of FGF-responsive stem cells with increasing embryonic age. These explanations may not be mutually exclusive. The length of the cell cycle may increase concurrently with a change in the mode of the division of the FGF-responsive stem cell from symmetric to asymmetric division. However, comparing the E11–E14 and E14–E17 periods, the increase in the cell cycle time would appear to be much less than that needed to account for the changes from a 12-fold to a twofold expansion in stem cells, suggesting that the stem cells dividing over the later 3 d period must be going through more asymmetrical than symmetrical divisions.
Fig. 6.

Estimates of the total numbers of EGF-responsive and FGF-responsive neural stem cells that reside in the striatal germinal zone at E11, E14, and E17. Data represent means ± SEM of the estimated number of stem cells residing in the striatal germinal zone at E11 (n = 9 dams), E14 (n = 32 dams), and E17 (n = 20 dams). One dam represents the mean of four embryos.
An EGF-responsive stem cell population arises between E11 and E14 and increases in absolute numbers between E14 and E17 (Fig. 6). Between E14 and E17 the EGF-responsive stem cell population increases by fivefold. This suggests that this population of EGF-responsive stem cells is also undergoing symmetric divisions. There is evidence that the EGF-responsive stem cell is the progeny of the FGF-responsive stem cell (Tropepe et al., 1999). Therefore, the switch in mode of division from symmetric to asymmetric in the FGF-responsive stem cell population may be (in addition to generating striatal neuronal or glial progenitors) giving rise to EGF-responsive stem cells.
Although at E14 there is some evidence to suggest that there are two populations of cells (with different cell cycle times) within the FGF-responsive stem cell population, the simplest estimates of cell cycle times for the FGF- and EGF-responsive populations of neural stem cells were made assuming that each growth factor responsive stem cell population consisted of single proliferating populations. Between E11 and E14 the FGF-responsive stem cell population expands by 12-fold in total number, suggesting that the stem cell is undergoing symmetric divisions. At E11, 12 hr of 3H-thy treatment depleted the FGF-responsive stem cell population by 88%. To obtain the same depletion at E14, the dams were injected with3H-thy for 20 hr. The time it takes to label the entire population of FGF-responsive stem cells (that is to deplete the population to zero) equals the total cell cycle time (Tc) minus the time it takes to complete S phase (Ts). Estimates ofTc −Ts were made assuming single population kinetics for FGF-responsive stem cells at each of E11 and E14 (ignoring for the moment the evidence mentioned above suggesting a small minority population of FGF-responsive stem cells at E14 with longer cell cycle times). Given that the 88 and 89% depletions in neurospheres at E11 and E14, respectively represented 0.88 and 0.89(Tc −Ts), the estimate of how long it would take to deplete the entire population to zero could be determined by solving for Tc −Ts at each age. If 0.88(Tc −Ts) = 12 hr at E11, then Tc −Ts = 13.6 hr, and if 0.89(Tc −Ts) = 20 hr at E14, then Tc −Ts = 22.5 hr. The total length of the cell cycle can be estimated knowingTs. This cell cycle parameter cannot be determined from the results of the present experiments. However, estimates of Ts for cortical and striatal germinal zone cells range between 4 and 6 hr and remain relatively constant through the embryonic period (Reznikov and van der Kooy, 1995; Takahashi et al., 1995; Bhide, 1996). AssumingTs of stem cells does not differ significantly from the majority of proliferating cells within the germinal zone, the minimum estimate forTc = 17.6 hr at E11 and 26.5 hr at E14. These assumptions also were used to estimate the cell cycle times of EGF-responsive stem cells at E14 and E17 and FGF-responsive stem cells at E17 (see below). The values predicted forTc at each age may be overestimates of the actual cell cycle time. Indeed, with in vivo cumulative labeling techniques it is necessary to take into account the length of S phase when determining cell cycle parameters, because a single injection of the nucleotide will mark all cells regardless of whether they are at the beginning or end of S phase. By using high doses of3H-thy, however, the cells exposed to the nucleotide may need a certain amount of time to incorporate enough of the nucleotide to be killed by intranuclear radiation. Therefore, the time it takes to deplete the population to zero may actually be longer than Tc −Ts and thus this time would be closer to the actual (slightly shorter than estimated) cell cycle time of the stem cell population.
Given the size of the FGF-responsive stem cell population at E11, all the stem cells would have to divide symmetrically four times within 3 d to increase the population to the number observed at E14 (a 12-fold increase). With an estimated cell cycle time for FGF-responsive stem cells of 17.6–26.5 hr between E11 and E14, the stem cells would have time for a maximum of four divisions each. This suggests that all the divisions of the FGF-responsive stem cell between E11 and E14 are symmetric. However, given that striatal neurons and EGF-responsive stem cells are also generated between E11 and E14, at least some of the FGF-responsive stem cells also must undergo asymmetric divisions. We presented evidence for some variability in the cell cycle times of the FGF-responsive stem cell population, with the majority of stem cells at E14 having a short cell cycle time whereas the rest have a relatively long cell cycle time. Therefore, our estimates of the average cell cycle time for FGF-responsive stem cells may hide the variability in cell cycle times that exist (Acklin and van der Kooy, 1993; Reznikov et al., 1997).
At E14, there are two populations of stem cells, an FGF-responsive stem cell and a EGF-responsive stem cell. Approximately 40–80% of all stem cells are proliferating at E14 with estimated cell cycle times of 26.5 hr for FGF-responsive stem cells and 34 hr for EGF-responsive stem cells (0.4(Tc −Ts) = 12 hr,Tc −Ts = 30 hr, andTs = 4 hr). Between E14 and E17 the increase in the FGF-responsive stem cell population is twofold. The entire population of FGF-responsive stem cells would have to undergo only one symmetric division to yield the number of FGF-responsive stem cells observed at E17. Given our estimate of cell cycle times at E14 and assuming the stem cells divide throughout the 3 d period, it can be concluded that between E14 and E17 the majority of divisions of FGF-responsive stem cells would be asymmetric. The EGF-responsive stem cell population increases fivefold between E14 and E17, but its cell cycle time remains relatively constant over this time (34–38 hr). The population would have to undergo between two and three symmetric divisions in 72 hr to generate the numbers of EGF-responsive stem cells observed at E17. Given a 34 hr cell cycle time for EGF-responsive stem cells at E14, most of the EGF-responsive stem cell divisions would need to be symmetrical to generate the fivefold increase in stem cells between E14 and E17. Alternatively, if some EGF-responsive stem cells go through asymmetric divisions between E14 and E17 (generally only one EGF-sensitive stem cell and one differentiating progenitor per division), then the EGF-responsive stem cell population also could be expanded by way of the FGF-responsive stem cells generating EGF-responsive stem cells through asymmetric divisions.
At E17, the FGF-responsive stem cell population has a cell cycle time of ∼48.4 hr (0.27(Tc −Ts) = 12 hr,Tc −Ts = 44.4 hr, andTs = 4 hr), whereas the EGF-responsive stem cell population has a cell cycle time of ∼38.3 hr (0.35(Tc − Ts) = 12 hr, Tc − Ts = 34.3 hr , and Ts = 4 hr). It is not known if either of these stem cell populations continues to increase in absolute numbers after E17, but it is apparent that they are lengthening the time of their cell cycles and possibly becoming relatively quiescent, as they are in the subependyma of the adult mouse forebrain (Morshead et al., 1994). Indeed, even when forced to divide by depleting their constitutively proliferating progeny, the adult stem cells still divide only asymmetrically in vivo to renew themselves and to replenish the constitutively proliferating population (Morshead et al., 1998). However, adult stem cells retain the ability to divide symmetrically in the adult forebrain in vivo, as evidenced by the increase in adult lateral ventricle subependymal stem cells after direct infusion of EGF or FGF2 in the lateral ventricle (Craig et al., 1996; Martens and van der Kooy, 1998).
DISCUSSION
In the present paper we determined the kinetics of neural stem cells by injecting animals with high doses of3H-thy to kill off proliferating cells and then culturing the cells in the clonal neurosphere assay (where one sphere represents the progeny of a single neural stem cell). According to our hypothesis, if stem cells were proliferating at the time of exposure to 3H-thy, then they would die and fail to form neurospheres in vitro. Such an approach may be the only way to study the proliferation kinetics of small subpopulations of neural stem cells [<1% of germinal zone cells (Tropepe et al., 1999)] within the larger population of embryonic germinal zone precursors. The results showed that during embryonic forebrain development the length of the cell cycle and mode of division of two separate populations of neural stem cells (EGF- and FGF-responsive) change over time (Fig.7). The length of the cell cycle of FGF-responsive stem cells increases with increasing embryonic age, and their mode of division switches from being primarily symmetric at E11 to being primarily asymmetric by E14. EGF-responsive stem cells arise between E11 and E14, have a similar relatively long cell cycle time at E14 and E17, and this EGF-responsive stem cell population increases in size by asymmetric divisions of FGF-responsive stem cells and by symmetric divisions of EGF-responsive stem cells themselves.
Fig. 7.
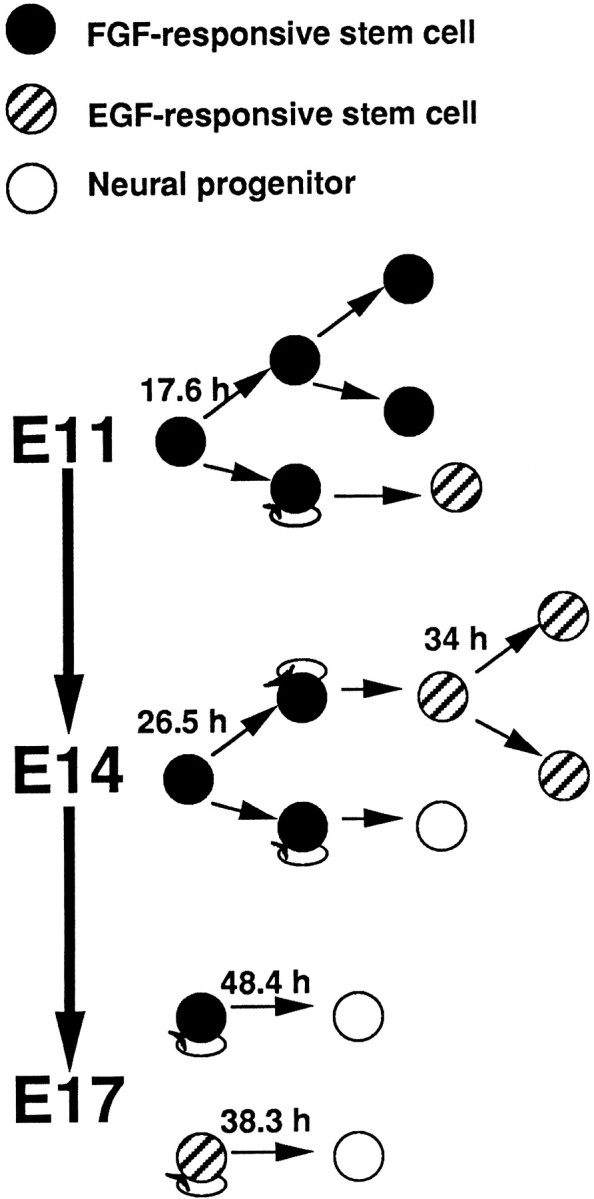
Between E11 and E17, FGF-responsive and EGF-responsive neural stem cells, residing within the striatal germinal zone of the embryonic mouse forebrain, have distinct cell cycle times (the cell cycle length in hours is indicated above the dividing cell) and modes of division. At E11 only FGF-responsive neural stem cells reside in the germinal zone. They have a short cell cycle time, and the majority of their divisions are symmetric, thereby expanding the size of their population. EGF-responsive stem cells arise between E11 and E14 from asymmetric divisions (the self-renewing progeny are denoted bycircular arrows) of the FGF-responsive stem cells. By E14 the cell cycle time of FGF-responsive stem cells has increased and between E14 and E17 their mode of division switches from primarily symmetric divisions to primarily asymmetric divisions. Asymmetric divisions result in either more EGF-responsive stem cells or neural progenitors. The EGF-responsive stem cells at E14 have a relatively long cell cycle time compared to FGF-responsive stem cells. Between E14 and E17 EGF-responsive stem cells expand their population by undergoing symmetric divisions and by asymmetric divisions of FGF-responsive stem cells. At E17 there is a further increase in the cell cycle time of FGF-responsive stem cells, whereas the cell cycle time of EGF-responsive stem cells has remained relatively the same as that observed for EGF-responsive stem cells at E14. Both populations at E17 proliferate asymmetrically to give rise to neural progenitors.
The cell cycle time of EGF-responsive stem cells seems to be relatively long (estimated at >30 hr) soon after they appear at E14, and this longer cell cycle time appears to be maintained by the EGF-responsive stem cells at E17. This contrasts with the dramatic increase in cell cycle time of the FGF-responsive stem cells (based on the in vivo kill experiments). The very different cell cycle time behaviors of EGF- and FGF-responsive stem cells further support the data showing that the embryonic EGF- and FGF-responsive stem cell populations are additive and separate populations of neural stem cells (Tropepe et al., 1999). A recent report suggests that in the adult there is a single stem cell population that can form neurospheresin vitro in response to either EGF or FGF2 (Gritti et al., 1999). Perhaps each population develops separately in the embryo, but in the adult the entire stem cell population expresses both growth factor receptors.
Based on the depletions in the numbers of neurospheres that are generated in vitro, up to 88, 60, and 27% of all of the FGF-responsive stem cells are proliferating within a 12 hr period at E11, E14, and E17, respectively. These data suggest that the length of the FGF-responsive neural stem cell cycle is increasing with increasing embryonic age. This conclusion is supported by two further findings. First, the dose of 3H-thy used to inject mice at each embryonic age was sufficient to kill off stem cells proliferating in vivo. The depletions we observed in the number of neurospheres after 3H-thy treatment at each embryonic age indicate the number of stem cells that were in S phase during the period of exposure to3H-thy. Second, injections of3H-thy for periods of 6, 12, and 20 hr resulted in further depletions in the number of neurospheres generatedin vitro in response to FGF2 with longer injection periods. Assuming single population kinetics, we suggest that the length of the cell cycle of FGF-responsive stem cells increases from ∼17.6 hr at E11 to ∼26.5 hr at E14. However, these results also suggested that there are actually two populations of proliferating FGF-responsive stem cells, one majority population with a shorter cell cycle time of 26.5 hr and a second minority population (10%) with a longer cell cycle time that cannot be predicted from the present results. It is possible that the second population of FGF-responsive stem cells represents a small fraction of the stem cells that have become relatively quiescent, as stem cells exist in the adult forebrain subependyma (Morshead et al., 1998). Whether or not there are two proliferating populations of FGF-responsive stem cells, our results suggest that the average cell cycle time of the small subpopulation of neural stem cells increases over embryonic time in a manner similar to the increase in the estimates of the average cell cycle times of the overall population of germinal zone cells giving rise to the striatum (10–12 hr from E11 to E12) (Bhide, 1996) and cortex (8–18 hr from E11 to E16) (Takahashi et al., 1995). Although this may imply that some general embryonic factor may be increasing cell cycle time throughout the germinal zone over embryonic development, it is important to point out that the average estimates of cell cycle parameters for the entire germinal zone population hide some large differences in cell cycle times among different proliferating progenitor clones at both E14 (Reznikov et al., 1997) and E17 (Acklin and van der Kooy, 1993). Indeed, our estimates of the absolute cell cycle times for both populations of neural stem cells at each embryonic age were generally longer than the average estimates made for the overall populations of forebrain germinal zone cells at similar ages. Lengthening of the cell cycle time is thought to be a function of an increase in the duration of G1 as the rest of the cell cycle parameters remain relatively constant over time (Waechter and Jaensch, 1972; Caviness et al., 1995). An increase in the length of G1 provides an opportunity for stem cells to respond to changes in their environment by, for instance, regulating the number symmetric to asymmetric divisions they go through.
At E14 there is a switch in the mode of division of the FGF-responsive stem cells from primarily symmetric division to primarily asymmetric division. What signal or signals are responsible for such a switch in the mode of division remains unclear. Several factors have been shown to be involved in determining if cells will undergo symmetric or asymmetric divisions (Rakic, 1988; Jan and Jan, 1998). The asymmetric division of the FGF-responsive stem cell may be regulated by m-Numb and its interactions with the Notch 1 receptor (Guo et al., 1996; Zhong et al., 1996) or even the growth factor itself (Vaccarino et al., 1999). Notch 1 has been found to be asymmetrically localized in cortical progenitors. Cells undergoing asymmetric (cleavage furrow is horizontal to wall of lateral ventricle) division were found to have the Notch 1 receptor segregated to the basilar daughter cell (Chen and McConnell, 1995), whereas m-Numb is segregated to the apical daughter cell (Zhong et al., 1996). Exogenous FGF2 injected into rat embryos has been shown to increase the number of cortical progenitors (Vaccarino et al., 1999). It is possible that m-Numb, Notch 1, and FGF2 may be regulating the modes of division of neural stem cells and the fates of their progeny, although the prevalence of their expression suggests they must have roles in the division of the more massive downstream population of germinal zone progenitors.
In the developing forebrain, there is evidence that EGF receptor immunostaining is greatest in the subventricular zone, whereas FGF receptor 1 mRNA levels are most intense in the ventricular zone (Wanaka et al., 1991; Eagleson et al., 1996). Early in embryogenesis only FGF-responsive stem cells reside in the ventricular zone. The generation of EGF-responsive stem cells coincides with the formation of the subventricular zone. Given the differences in receptor localization and given there are two separate populations of stem cells, we hypothesize that FGF-responsive stem cells seed the subventricular zone with EGF-responsive stem cells and therefore would reside in distinct proliferative zones. Indeed, preliminary evidence suggests that more neurospheres are generated in response to EGF than to FGF2 from dissections of E14 striatal subventricular zone tissue, whereas more neurospheres are generated in response to FGF2 than to EGF from dissections of E14 striatal ventricular zone tissue (V. Tropepe and D. van der Kooy, unpublished observations). This would suggest that FGF-responsive stem cells undergo asymmetric divisions in the ventricular zone, generating one FGF-responsive stem cell and one EGF-responsive stem cell, and then the EGF-responsive neural stem cell migrates through the ventricular zone to reside in the subventricular zone.
Our data suggest that the small populations of striatal stem cells may change from symmetric to asymmetric divisions during embryonic development. In the adult forebrain, neural stem cells divide asymmetrically, even after killing the constitutively proliferating population (Morshead et al., 1998). However, they are still capable of undergoing symmetric divisions in vitro (more than one new neurosphere is generated after passaging single neurospheres generated in either EGF or FGF2) and in vivo after the infusion of growth factors into the lateral and fourth ventricles of the adult mouse brain (Craig et al., 1996; Martens and van der Kooy, 1998). This suggests that cells undergo asymmetric division unless there is some positive factor within the environment to tell them to divide symmetrically (Morshead et al., 1998).
Footnotes
This work was supported by the Medical Research Council of Canada and the Multiple Sclerosis Society of Canada.
Correspondence should be addressed to David J. Martens, Department of Anatomy and Cell Biology, Medical Sciences Building, Room 1105, University of Toronto, 1 King's College Circle, Toronto, Ontario M5S 1A8, Canada. E-mail: david.martens@utoronto.ca.
REFERENCES
- 1.Acklin SE, van der Kooy D. Clonal heterogeneity in the germinal zone of the developing rat telencephalon. Development. 1993;118:175–192. doi: 10.1242/dev.118.1.175. [DOI] [PubMed] [Google Scholar]
- 2.Becker AJ, McCulloch EA, Siminovitch L, Till JE. The effect of differing demands for blood cell production on DNA synthesis by hemopoietic colony-forming cells of mice. Blood. 1965;26:296–312. [PubMed] [Google Scholar]
- 3.Bhide PG. Cell cycle kinetics in embryonic mouse corpus striatum. J Comp Neurol. 1996;374:506–522. doi: 10.1002/(SICI)1096-9861(19961028)374:4<506::AID-CNE3>3.0.CO;2-5. [DOI] [PubMed] [Google Scholar]
- 4.Bjursell G, Reichard P. Effects of thymidine on deoxyribonucleoside triphosphate pools and deoxyribonucleic acid synthesis in Chinese hamster ovary cells. J Biol Chem. 1973;248:3904–3909. [PubMed] [Google Scholar]
- 5.Cai L, Hayes NL, Nowakowski RS. Local homogeneity of cell cycle length in developing mouse cortex. J Neurosci. 1997;17:2079–2087. doi: 10.1523/JNEUROSCI.17-06-02079.1997. [DOI] [PMC free article] [PubMed] [Google Scholar]
- 6.Caviness VS, Jr, Takahashi T, Nowakowski RS. Numbers, time and neocortical neurogenesis: a general developmental and evolutionary model. Trends Neurosci. 1995;18:379–383. doi: 10.1016/0166-2236(95)93933-o. [DOI] [PubMed] [Google Scholar]
- 7.Chen A, McConnell SK. Cleavage orientation and the asymmetric inheritance of Notch1 immunoreactivity in mammalian neurogenesis. Cell. 1995;82:631–641. doi: 10.1016/0092-8674(95)90035-7. [DOI] [PubMed] [Google Scholar]
- 8.Craig CG, Tropepe V, Morshead CM, Reynolds BA, Weiss S, van der Kooy D. In vivo growth factor expansion of endogenous subependymal neural precursor cell populations in the adult mouse brain. J Neurosci. 1996;16:2649–2658. doi: 10.1523/JNEUROSCI.16-08-02649.1996. [DOI] [PMC free article] [PubMed] [Google Scholar]
- 9.Drew RM, Painter RB. Action of tritiated thymidine on the clonal growth of mammalian cells. Radiat Res. 1959;11:535–544. [PubMed] [Google Scholar]
- 10.Eagleson KL, Ferri RT, Levitt P. Complementary distribution of collagen type IV and the epidermal growth factor receptor in the rat embryonic telencephalon. Cereb Cortex. 1996;6:540–549. doi: 10.1093/cercor/6.3.540. [DOI] [PubMed] [Google Scholar]
- 11.Gritti A, Parati EA, Cova L, Frolichsthal P, Galli R, Wanke E, Faravelli L, Morassutti DJ, Roisen F, Nickel DD, Vescovi AL. Multipotential stem cells from the adult mouse brain proliferate and self-renew in response to basic fibroblast growth factor. J Neurosci. 1996;16:1091–1100. doi: 10.1523/JNEUROSCI.16-03-01091.1996. [DOI] [PMC free article] [PubMed] [Google Scholar]
- 12.Gritti A, Frαlichsthal-Schoeller P, Galli R, Parati EA, Cova L, Pagano SF, Bjornson CR, Vescovi AL. Epidermal and fibroblast growth factors behave as mitogenic regulators for a single multipotent stem cell-like population from the subventricular region of the adult mouse forebrain. J Neurosci. 1999;19:3287–3297. doi: 10.1523/JNEUROSCI.19-09-03287.1999. [DOI] [PMC free article] [PubMed] [Google Scholar]
- 13.Guo M, Jan LY, Jan YN. Control of daughter cell fates during asymmetric division; interaction of Numb and Notch. Neuron. 1996;17:27–41. doi: 10.1016/s0896-6273(00)80278-0. [DOI] [PubMed] [Google Scholar]
- 14.Hall PA, Watt FM. Stem cells: the generation and maintenance of cellular diversity. Development. 1989;106:619–633. doi: 10.1242/dev.106.4.619. [DOI] [PubMed] [Google Scholar]
- 15.Hasthorpe S, Harris AW. Growth control of hemopoietic colony-forming cells by thymidine and deoxycytidine. In: Baum SJ, Ledney GD, editors. Experimental hematology today. Springer; New York: 1979. pp. 11–18. [Google Scholar]
- 16.Jan YN, Jan LY. Asymmetric cell division. Nature. 1998;392:775–778. doi: 10.1038/33854. [DOI] [PubMed] [Google Scholar]
- 17.Lajtha LG, Pozzi LV, Schofield R, Fox M. Kinetic properties of haemopoietic stem cells. Cell Tissue Kinet. 1969;2:39–49. [Google Scholar]
- 18.Martens DJ, van der Kooy D. In vivo infusion of EGF, bFGF, and Heparin increases proliferation of cells lining the fourth ventricle and central canal of the adult mouse brain. Soc Neurosci Abstr. 1998;24:1528. [Google Scholar]
- 19.Morshead CM, Reynolds BA, Craig CG, McBurney MW, Staines WA, Morusatti D, Weiss S, van der Kooy D. Neural stem cells in the adult mammalian forebrain: a relatively quiescent subpopulation of subependymal cells. Neuron. 1994;13:1071–1082. doi: 10.1016/0896-6273(94)90046-9. [DOI] [PubMed] [Google Scholar]
- 20.Morshead CM, Craig CG, van der Kooy D. In vivo clonal analyses reveal the properties of endogenous neural stem cell proliferation in the adult mammalian forebrain. Development. 1998;125:2251–2261. doi: 10.1242/dev.125.12.2251. [DOI] [PubMed] [Google Scholar]
- 21.Nowakowski RS, Lewin SB, Miller MW. Bromodeoxyuridine immunohistochemical determination of the lengths of the cell cycle and the DNA-synthetic phase for an anatomically defined population. J Neurocytol. 1989;18:311–318. doi: 10.1007/BF01190834. [DOI] [PubMed] [Google Scholar]
- 22.Painter RB, Drew RM, Hughes WL. Inhibition of HeLa growth by intranuclear tritium. Science. 1958;127:1244–1245. doi: 10.1126/science.127.3308.1244. [DOI] [PubMed] [Google Scholar]
- 23.Potten CS, Loeffler M. Stem cells: attributes, cycles, spirals, pitfalls, and uncertainties. Lessons for and from the crypt. Development. 1990;110:1001–1020. doi: 10.1242/dev.110.4.1001. [DOI] [PubMed] [Google Scholar]
- 24.Rakic P. Specification of cerebral cortical areas. Science. 1988;241:170–176. doi: 10.1126/science.3291116. [DOI] [PubMed] [Google Scholar]
- 25.Reynolds BA, Weiss S. Generation of neurons and astrocytes from isolated cells of the adult mammalian central nervous system. Science. 1992;255:1707–1710. doi: 10.1126/science.1553558. [DOI] [PubMed] [Google Scholar]
- 26.Reynolds BA, Weiss S. Clonal and population analyses demonstrate that an EGF-responsive mammalian embryonic CNS precursor is a stem cell. Dev Biol. 1996;175:1–13. doi: 10.1006/dbio.1996.0090. [DOI] [PubMed] [Google Scholar]
- 27.Reynolds BA, Tetzlaff W, Weiss S. A multipotent EGF-responsive striatal embryonic progenitor cell produces neurons and astrocytes. J Neurosci. 1992;12:4565–4574. doi: 10.1523/JNEUROSCI.12-11-04565.1992. [DOI] [PMC free article] [PubMed] [Google Scholar]
- 28.Reznikov K, van der Kooy D. Variability and partial synchrony of the cell cycle in the germinal zone of the early embryonic cortex. J Comp Neurol. 1995;360:536–554. doi: 10.1002/cne.903600313. [DOI] [PubMed] [Google Scholar]
- 29.Reznikov K, Acklin SE, van der Kooy D. Clonal heterogeneity in the early embryonic rodent cortical germinal zone and the separation of subventricular from ventricular zone lineages. Dev Dyn. 1997;210:328–343. doi: 10.1002/(SICI)1097-0177(199711)210:3<328::AID-AJA12>3.0.CO;2-6. [DOI] [PubMed] [Google Scholar]
- 30.Takahashi T, Nowakowski RS, Caviness VS., Jr Cell cycle parameters and patterns of nuclear movement in the neocortical proliferative zone of the fetal mouse. J Neurosci. 1993;13:820–833. doi: 10.1523/JNEUROSCI.13-02-00820.1993. [DOI] [PMC free article] [PubMed] [Google Scholar]
- 31.Takahashi T, Nowakowski RS, Caviness VS., Jr The cell cycle of the pseudostratified ventricular epithelium of the embryonic murine cerebral wall. J Neurosci. 1995;15:6046–6057. doi: 10.1523/JNEUROSCI.15-09-06046.1995. [DOI] [PMC free article] [PubMed] [Google Scholar]
- 32.Tropepe V, Sibilia M, Ciruna BG, Rossant J, Wagner EF, van der Kooy D. Distinct neural stem cells proliferate in response to EGF and FGF in the developing mouse telencephalon. Dev Biol. 1999;208:166–188. doi: 10.1006/dbio.1998.9192. [DOI] [PubMed] [Google Scholar]
- 33.Vaccarino FM, Schwartz ML, Raballo R, Nilsen J, Rhee J, Zhou M, Doetschman T, Coffin JD, Wyland JJ, Hung YE. Changes in cerebral cortex size are governed by fibroblast growth factor during embryogenesis. Nat Neurosci. 1999;2:246–253. doi: 10.1038/6350. [DOI] [PubMed] [Google Scholar]
- 34.Waechter RV, Jaensch B. Generation times of the matrix cells during embryonic brain development: an autoradiographic study in rats. Brain Res. 1972;46:235–250. doi: 10.1016/0006-8993(72)90018-2. [DOI] [PubMed] [Google Scholar]
- 35.Wanaka A, Milbrandt J, Johnson Jr EM (1991) Expression of FGF receptor gene in rat development. Development 455–468. [DOI] [PubMed]
- 36.Zhong W, Feder JN, Ming-Ming J, Jan LY, Jan YN. Asymmetric localization of a mammalian numb homolog during mouse cortical neurogenesis. Neuron. 1996;17:43–53. doi: 10.1016/s0896-6273(00)80279-2. [DOI] [PubMed] [Google Scholar]