

Abstract
The middle temporal visual area (MT) of the owl monkey is anatomically organized with respect to both preferred direction of motion and different types of center–surround interaction. The latter organization consists of clusters of neurons whose receptive fields have antagonistic surrounds that render them unresponsive to wide-field motion (local motion columns) interdigitated with groups of neurons whose receptive fields have additive surrounds and thus respond best to wide-field motion (wide-field motion columns).
To learn whether the information in these regions remained segregated further along the visual pathways, we made injections of retrograde tracers into two visual areas to which MT projects [the medial superior temporal area (MST) and fundus of the superior temporal sulcus (FST)] and then labeled the wide-field and local organization using 2-deoxyglucose. In complementary experiments, we injected anterograde tracers into regions of MT that we had mapped using microelectrode recordings.
Injections into both dorsal FST and ventral MST labeled clusters of cell bodies in MT that were concentrated within wide-field motion columns, whereas injections into dorsal MST labeled neurons predominantly within local motion columns. Results from the anterograde tracer experiments corroborated these findings. The high degree of specificity in the connections reinforces a model of functional organization for wide-field versus local motion processing within MT. Our data support the previously reported division of FST into separate dorsal and ventral areas, and they also suggest that MST of the owl monkey is, like MST of the macaque, functionally organized with respect to local versus wide-field motion processing.
Keywords: functional neuroanatomy, functional organization, parallel processing, modularity, center–surround, figure ground
Neurons in the cerebral cortex are not distributed randomly but, rather, tend to be clustered together in groups sharing similar properties. This tendency, most clearly demonstrated in the columnar organization of primary sensory cortex (Mountcastle, 1957; Hubel and Wiesel, 1962, 1968), also appears to occur in many other cortical regions (for review, see Mountcastle, 1997).
One such region is the middle temporal visual area (MT or V5). Direction columns have been demonstrated in both macaques (Albright et al., 1984) and owl monkeys (Malonek et al., 1994), and it has recently been shown that macaque MT is also columnarly organized with respect to binocular disparity (DeAngelis and Newsome, 1999). In MT of the owl monkey, where tuning for binocular disparity is rare or absent (Zeki, 1980; Felleman and Kaas, 1984) there exists a coarser, columnar organization of neurons having different types of center–surround interactions (Born and Tootell, 1992). In one kind of region, the neurons respond best to wide-field motion stimuli, and in the other kind, neurons do not respond to wide-field motion because their receptive fields have antagonistic surrounds (Allman et al., 1985). This organization can be labeled using14C-labeled 2-deoxyglucose (2dg) in conjunction with wide-field motion stimuli (Born and Tootell, 1992) revealing band-like regions of high isotope uptake (Fig.1b, dark bands), in which neurons responded vigorously to the wide-field motion stimulus, interleaved with regions where isotope uptake was equal to that of unstimulated cortex (Fig. 1b, light regions), in which neurons failed to respond to the stimulus. [In our initial description of this functional organization (Born and Tootell, 1992), we referred to the dark regions on the 2dg autoradiographs as “bands” and the light regions as “interbands.” To avoid confusion and to emphasize the functional significance of the 2dg patterns, we will instead use the terms “wide-field” and “local” motion processing regions to refer to the bands and interbands, respectively.] These band-like patterns tend to run approximately parallel to the superior temporal sulcus (STS) and are similar in spatial scale to the banded patterns of intrinsic connections observed by Weller and colleagues (see Weller et al., 1984, their Fig. 3).
Fig. 1.
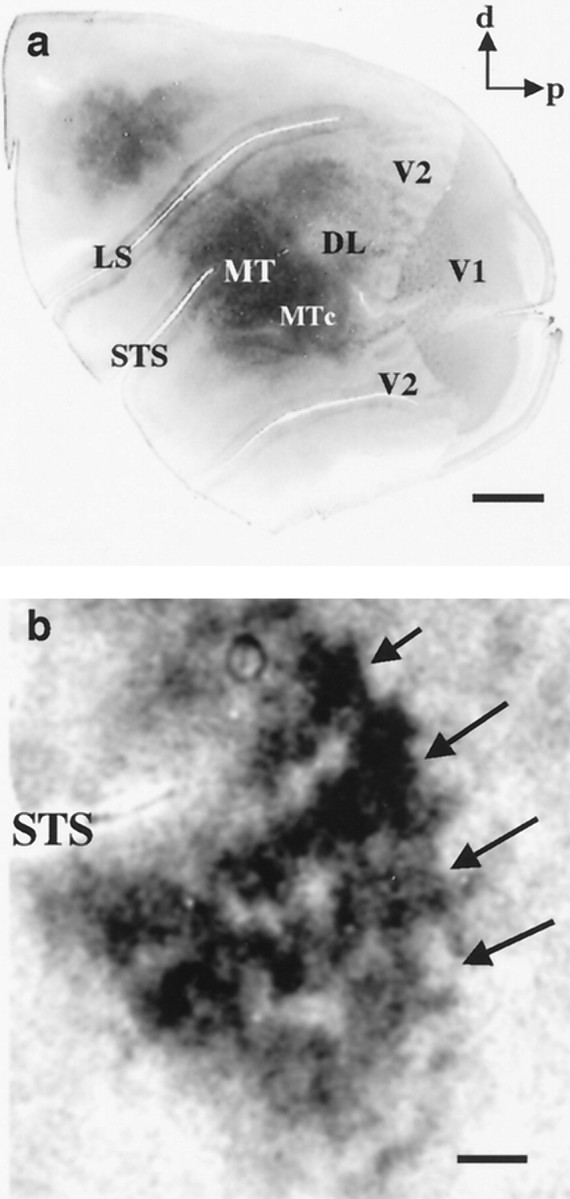
Topography of owl monkey visual cortex demonstrated with cytochrome oxidase and 2-deoxyglucose.a, The left hemisphere of an adult owl monkey has been unfolded and flattened and then sectioned parallel to the cortical surface and stained for cytochrome oxidase. A number of visual areas are delineated by this technique, including striate cortex (V1), the second visual area (V2), MT, and the MT crescent. d, Dorsal; p, posterior; LS, lateral sulcus; STS, superior temporal sulcus; MTc, middle temporal crescent;DL, dorsolateral complex of visual areas. Scale bar, 5 mm. b, Autoradiograph of a section through MT parallel to the cortical surface showing dark bands, indicated byarrows, which contain groups of neurons responsive to wide-field motion, and lighter regions in between, which contain groups of neurons with antagonistic surrounds responsive to local motion contrast. Scale bar, 1 mm.
This evidence for functional clustering within MT of the owl monkey motivated us to look for a correlate in its projections. We were especially interested in connections with the medial superior temporal area (MST), which, in the macaque, receives a direct projection from MT (Maunsell and Van Essen, 1983; Desimone and Ungerleider, 1986;Ungerleider and Desimone, 1986) and appears to be segregated into regions with functional properties similar to those observed in wide-field and local motion regions of the owl monkey (Tanaka et al., 1986; Komatsu and Wurtz, 1988; Eifuku and Wurtz, 1998). To study this, we injected anterograde tracers into regions of MT that we had mapped physiologically. We also made injections of retrograde tracers into known projection zones of MT and then labeled the functional organization using 2dg. Our findings support the idea of segregation of visual motion information in extrastriate cortex of the owl monkey.
MATERIALS AND METHODS
Anterograde tracer experiments. Before microelectrode mapping of MT, animals underwent a surgical procedure to implant a stainless steel cylinder to allow sterile access to the cortex for subsequent recording. All procedures were approved by the Harvard Medical Area Standing Committee on Animals and conformed to guidelines established by the National Institutes of Health for the care and use of laboratory animals.
Anesthesia was initiated with ketamine (15 mg/kg, i.m.) and valium (1 mg/kg, i.m.), an intravenous catheter was inserted, and the animals were intubated. Anesthesia was maintained with isoflurane (1–2% in oxygen). Using aseptic technique, a circular craniotomy was made over MT (dura left intact), and a stainless steel recording cylinder was attached to the skull using dental acrylic. The cylinder was closed with a threaded cap, and the scalp incision was closed using silk suture.
After a 10 d recovery period, microelectrode recordings were made from MT while the animal was under sufentanil anesthesia (2–8 μg · kg−1 · hr−1, i.v.) but not paralyzed. We first administered a loading dose of sufentanil (7.2 mg/kg, i.v. push) to rapidly obtain a stable, steady-state level of drug in the bloodstream. We then began a maintenance dose of 2 μg · kg−1 · hr−1sufentanil, i.v., and increased the infusion rate as dictated by changes in reflexes (for unparalyzed animals) or in vital signs (for paralyzed animals) that indicated stress or lightening of anesthesia. For more rapid control of anesthetic levels, we often supplemented the sufentanil with a small amount of isoflurane (0.25–0.5% in oxygen). We frequently ended up at a maintenance dose of 4 μg · kg−1 · hr−1and only rarely needed a higher dose. The dura was reflected, and a high-power image of the blood vessel pattern on the cortical surface (see Fig. 3a) was taken through an operating microscope (OPMI-1; Zeiss, Thornwood, NY) using a CCD camera (CCD 72; Dage, Michigan City, IN). The image was digitized using a Scion (Frederick, MD) LG3 frame grabber and stored on a Power Macintosh 7100/80 computer. Using the blood vessel pattern as a guide, a small region of MT was mapped with many perpendicular microelectrode penetrations. We used varnish-coated tungsten microelectrodes (Frederick Haer, Inc., Bowdoinham, ME) of relatively low impedance (<1 MΩ) and listened to the amplified multiunit activity over a loudspeaker. Receptive fields were mapped qualitatively using bars, spots, and circular windows of random dots generated by a Silicon Graphics (Mountain View, CA) Indigo2 R10,000 computer. We first confirmed that the neurons were strongly direction-selective and then tested whether the neurons in a given region responded better to local or to wide-field motion by comparing their responses to discrete stimuli, such as bars or single spots, with their responses to large fields of random dots.
Fig. 3.
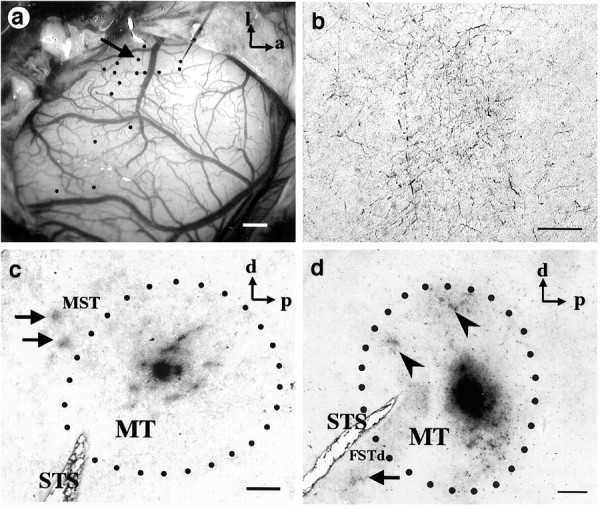
Injections of anterograde tracer into MT. a, Image of the exposed cortical surface of an owl monkey brain in the region of the superior temporal sulcus. The large blood vessel running vertically in the middle of the image lies on top of this sulcus. Black dots represent different sites at which a metal microelectrode was introduced to record multiunit responses to visual stimuli. Neurons recorded along one penetration (arrow) had receptive fields with strong antagonistic surrounds, and this site was chosen for injection of the anterograde tracer BDA. The results of this injection are illustrated in c. a, Anterior; l, lateral. b, High-magnification view of the patch in FSTd of d, showing the clusters of axon arbors.c, Results of the BDA injection at the site shown ina. The injection into MT produced a pattern of patchy local transport distributed in an elliptical fashion about the injection site together with two prominent patches of label outside MT, in the dorsal region of MST (arrows). The myelin-defined boundary of MT is designated by dots. d,Results of a second experiment in a different animal in which BDA was injected iontophoretically into a region of MT containing neurons that responded best to wide-field motion. The injection in MT produced a pattern of local transport (arrowheads) inside MT, along with a large patch of label (arrow) outside MT, in FSTd. This patch is shown at higher magnification in b. Scale bars: a, c, d, 1 mm; b, 100 μm.
Once a suitably uniform region of cortex had been identified, the electrode was removed, and a glass micropipette containing biotinylated dextran amine (BDA, 10% in sterile saline) was inserted into the center of the mapped region. Tracer was then injected iontophoretically: 5 μA for 10 min, 7 sec on/7 sec off. After the injection, the dura was reapproximated, the recording cylinder was irrigated with sterile saline and capped, and the animal was allowed to recover on a water-heated pad under constant observation. After a 9 d survival period, the animal was killed with a barbiturate overdose (>50 mg/kg, to effect) and perfused through the heart with normal saline followed by 4% formaldehyde in 0.1m phosphate buffer, pH 7.4. The brain was removed from the skull, and the cortex was unfolded and flattened between two glass slides. The block of tissue was post-fixed for 24 hr in the same fixative solution. After cryoprotection for 2–3 d in 10 and 30% sucrose solutions, the tissue was cut in 40 μm sections parallel to the cortical surface using a freezing microtome. We usually divided each tissue block into several sets of sections. One set was incubated with ABC solution for 1.5 hr and then nickel-enhanced diaminobenzidine (Dolleman-Van der Weel et al., 1994). Another set of sections was processed for cytochrome oxidase (Fig. 1a) (Wong-Riley, 1979) in the superficial layers and myelin (Gallyas, 1979) in the deep layers to define the boundary of MT.
Retrograde tracer experiments. Animals were prepared for surgery as described above. The scalp was reflected, and a large, circular craniotomy (∼10–15 mm in diameter) was made over the areas to be injected. We used a micromanipulator to position a 5.0 μl Hamilton syringe over the targeted region and then lowered it so that the tip of the syringe was 1.2 mm into the cortex. The precise depth was achieved by gluing a sleeve of polyethylene tubing (PE10) to the syringe at the desired location. This broad, blunt cuff then prevented the syringe from penetrating the cortex beyond its end. Once the needle was in place we made injections (50–100 nl) of different retrograde tracers into cortical area MST and the fundus of the superior temporal sulcus (FST) over ∼30 min. Once the injection was complete we waited an additional 10 min before withdrawing the syringe. The retrograde tracers used were wheat germ agglutinin conjugated to horseradish peroxidase (WGA-HRP, 2% solution in sterile 0.9% saline), and the fluorescent dyes fluororuby (FR, 10% solution in sterile saline) and bisbenzimide (BB, saturated solution in sterile water). The particular tracers used at each injection site are listed in Table 1 and shown in Figure 2. Injections were made unilaterally, except in two cases. The location of the area to be injected was determined on the basis of sulcal landmarks and confirmed by subsequent histology.
Table 1.
Summary of injection sites and results
| Site | Hemi | Tracer | Area | Location | Figure | Rank sump | MC μ p | MC ς p |
|---|---|---|---|---|---|---|---|---|
| 1 | R | BDA | MT | Iterband | 3c | NA | NA | NA |
| 2 | L | BDA | MT | Band | 3d | NA | NA | NA |
| 3 | L | BB | MST | 0.32 | 10 | <0.0001 | 0.024 | 0.038 |
| 4 | L | HRP | MST | 0.4 | <0.0001 | 0.383 | 0.049 | |
| 5 | L | FR | MST | 0.51 | 4 | 0.1011 | 0.35 | 0.335 |
| 6 | R | HRP | MST | 0.6 | 8 | 0.0007 | 0.273 | 0.0443 |
| 7 | L | HRP | MST | 0.59 | 0.4403 | 0.381 | 0.492 | |
| 8 | L | HRP | MST | 0.83 | 9 | <0.0001 | 0.0205 | 0.0019 |
| 9 | R | HRP | FST | 0.13 | 5,6 | <0.0001 | 0.034 | 0.458 |
| 10 | R | BB | FST | 0.44 | 7,8 | 0.1177 | 0.436 | 0.108 |
| 11 | L | HRP | FST | 0.25 | 0.0206 | 0.343 | 0.601 | |
| 12 | L | BB | FST | 0.41 | 0.0001 | 0.118 | 0.097 | |
| 13 | L | HRP | FST | 0.39 | 10 | <0.0001 | 0.002 | 0.022 |
In the first column (Site), each injection site is numbered according to the scheme in Figure 2; the following four columns provide information about the injection: the hemisphere injected (Hemi), the nature of the tracer (Tracer), the visual area (Area), and the normalized location within the visual area (Location; see Results for details). The sixth column (Figure) references the figure number in which the results of a particular injection are shown. The final three columns give p values from each of three different statistical tests for the relationship between the transport patterns and the 2dg patterns: the Wilcoxon rank sum test (Rank sump), the Monte Carlo test of the mean 2dg values (MC μp), and the Monte Carlo test of the SD of the 2dg values (MC ς p). See Results for a description of the statistical tests. NA, Not applicable.
Fig. 2.
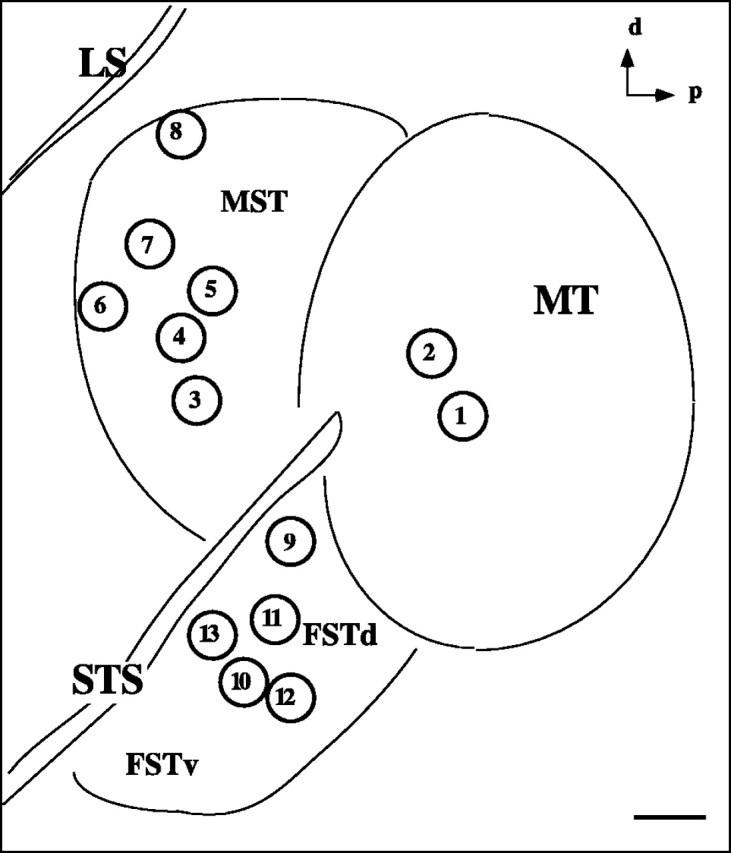
Summary of injection sites. Eachcircle represents the approximate location of an injection made in this study. Sites 1 and2, within MT, were injections of anterograde tracer; the others were injections of different retrograde tracers into MST and FST. See Table 1 for details on the nature of the injections and the results. d, Dorsal; p, posterior;LS, lateral sulcus; STS, superior temporal sulcus; MST, medial superior temporal area;FSTd,FSTv, dorsal and ventral subdivisions, respectively, of the fundus of the superior temporal sulcus. Scale bar, 1 mm.
2dg labeling. After a survival period of a 3–7 d the wide-field regions were labeled with 2dg using a modification of the technique developed by Sokoloff and colleagues (1977). The animal was anesthetized with sufentanil as for unit recording. The pupils were dilated with atropine, the corneal curvature was measured with a keratometer, and gas-permeable contact lenses of the appropriate size and power were placed over each eye to focus the eyes at a distance of 28.5 cm. A small craniotomy was made over the lateral part of striate cortex, into which was inserted a tungsten microelectrode. This was used to isolate a single unit with a binocular perifoveal receptive field so that the two eyes could be aligned using a Risley prism.
After we had found a single unit, the animal was paralyzed with a combination of curare (0.1 mg · kg−1 · hr−1, i.v.) and gallamine triethiodide (10 mg · kg−1 · hr−1, i.v.). The adequacy of anesthesia in paralyzed animals was ensured by continuous monitoring of heart rate and periodically testing for increases in rate associated with a brief pinch of the nail bed. An elevation of heart rate >10% above baseline, determined before administration of the paralytics, was our criterion for increasing the dose of anesthetic.
After alignment of the two eyes we injected14C 2dg (100 μCi/kg) intravenously while the animal viewed a large field of random dots moving coherently in systematically varied directions and speeds. The random dot stimulus consisted of a sparse field (0.3% density) of white random dots (each dot subtended 0.1° of visual angle and had a luminance of 4.56 cd/m2) on a dark background (6.58 × 10⁻² cd/m2) covering an area 120 × 120° of the visual field. This stimulus was generated by a personal computer containing a video board (SGT-Plus; Number Nine Corp., Cambridge, MA) and rear-projected using an ASK A4 LCD projector (Crimson Tech, Cambridge, MA) onto a custom-made acrylic hemisphere (Future Plastics, Inc., Woburn, MA) coated with Polacoat Video Vision (Da-Lite Screen Co., Warsaw, IN). During infusion of the isotope, the animal viewed this stimulus while it moved in systematically varied directions (15° increments) and speeds (5, 20, and 35°/sec) over the course of the experiment. The 2dg was infused slowly over the first 15 min to avoid bias in uptake caused by any single stimulus condition. After viewing the stimulus for 45 min, the animal was deeply anesthetized with sodium pentobarbital (50 mg/kg) and briefly perfused transcardially (0.9% saline, followed by 4% formaldehyde in 0.1 m phosphate buffer, pH 7.4, containing 13% sucrose). The entire duration of the perfusion was kept extremely short (30–60 sec) to prevent undue diffusion of the 2dg.
The cortex was then unfolded, flattened, and frozen on a glass slide on a Teflon block chilled with dry ice (Tootell and Silverman, 1985). Forty micrometer sections were cut parallel to the cortical surface using a cryostat, mounted on subbed coverslips, and dried. Sections were first apposed to x-ray film (MinR; Eastman Kodak, Rochester, NY) at −80°C. Regions of high 2dg uptake appear dark (wide-field), whereas regions of 2dg uptake equal to unstimulated cortex are lighter (local). After satisfactory autoradiographs had been obtained (which could take from 2 to 10 weeks), the same sections were processed for tracer histology as described below.
WGA-HRP injections and transport were rendered visible in dark-field by the tetramethylbenzidine (TMB) reaction following the procedure ofMesulam (1982). For fluorescent tracers one set of unprocessed sections was mounted directly for examination with a fluorescent microscope. High-resolution images of tracing were obtained by creating a montage from high-magnification fields scanned directly from the microscope.
Data analysis. To analyze our histological data we used a Neurolucida system (MicroBrightField, Inc., Colchester, VT) consisting of Neurolucida software running on a Pentium 2-333 workstation in combination with a Zeiss Axioskop, three-axis stage controller and video camera. Using this system, we produced an accurate tracing of each section and mapped all labeled neurons by systematically scanning MT under high magnification (250–500×). Switching between dark-field and epifluorescent illumination allowed us to mark both WGA-HRP and fluorescently labeled neurons. In the case of WGA-HRP injections, we also mapped the location of labeled axon terminals produced by anterograde transport. At the same time we mapped blood vessels and other landmarks, which were used to match the tracing to the corresponding 2dg image. Additionally, some TMB images were taken directly through the microscope at low magnification, using dark-field illumination and crossed polarizers. The 2dg autoradiographs were imaged using a macro lens on a CCD camera (Dage CCD 72), digitized using a Scion LG3 frame grabber, and stored on a Power Macintosh 7100/80 computer.
Once the images were in a digital format, blood vessels and tissue artifacts were used to align the 2dg and tracer images derived from the same section with one another using the public domain NIH Image program (written by Wayne Rasband at the US National Institutes of Health and available from the Internet by anonymous FTP fromzippy.nimh.nih.gov). Because the images being aligned were generated from a single tissue section (i.e., one 2dg autoradiograph and one tracer image), we were able to obtain extremely accurate alignment.
Image conventions. Groups of neurons that respond vigorously to a given visual stimulus (wide-field motion in all cases) took up greater amounts of the radiolabeled 2dg and thus appeared on the autoradiograph as a darker region. When we digitized the image, pixels were assigned a value from 0 to 1, with 0 corresponding to black and 1 corresponding to white. Thus, for all of the 2dg results presented here, wide-field motion processing columns appear as dark regions and correspond to numerical values nearer to 0. Conversely, local motion processing columns appear lighter and have numerical values nearer to 1.
RESULTS
We injected tracers into 13 different sites (summarized in Table1, Fig. 2) within areas MT, MST, and FST. At sites 1 and 2 the anterograde tracer BDA was injected into compartments within MT characterized by microelectrode recordings. In all other cases, various retrograde tracers, WGA-HRP, FR, and BB, were injected into different regions of MST and FST using anatomical landmarks. In each case of injection of a retrograde tracer, after a suitable survival period to allow transport, a terminal experiment was performed during which we labeled the wide-field or local pattern in MT using 2dg.
Injections of anterograde tracer into MT under functional control
Using cortical blood vessels as landmarks (Fig.3a), we mapped the visual response properties of neurons recorded along vertical penetrations at multiple sites across the surface of MT. From a cluster of penetrations, we chose one site for tracer injection because of the clear dominance of local motion responses recorded there. Direction-selective neurons in this penetration were much more responsive to a bar sweeping across the receptive field than to a patch of random dots, and they did not respond at all to a large field of random dots—behavior characteristic of neurons with antagonistic surrounds for moving stimuli (Allman et al., 1985; Born and Tootell, 1992). The BDA injection (Fig. 3c) produced patchy local transport around the injection site and, in addition, two prominent patches of label outside of MT in a dorsal part of MST. There was no transport either to ventral portions of MST or to regions on the ventral bank of the STS (FSTd or FSTv).
In another experiment we injected BDA into a wide-field region of MT. In this case the neurons responded optimally to a large field of random dots moving coherently in the preferred direction and responded poorly to bars and single spots. This injection produced two patches of label within MT and one large patch along the ventral bank of the STS in the dorsal subdivision of FST (Fig. 3d). No label was seen in areas on the dorsal bank of the STS.
These results suggested a segregation of projections; however, there were several drawbacks in using anterograde tracers to address this issue. First, it was difficult to make an injection that would be small enough to plausibly remain within a given compartment and yet would produce sufficient label at distant projection sites. Second, there was a problem interpreting a negative anterograde tracer result: if an injection into one compartment produced label in a given area and an injection into another compartment did not, it was difficult to interpret this as evidence for segregated projections, because the lack of transport for the second injection might be attributable to various technical factors. For a retrograde tracer experiment, however, a compartment-selective result is more convincing: if a large injection into an MT projection site labels MT cell bodies in multiple patches of one compartment type, skipping intervening regions of the other (as in, for example, Fig. 4d), the interpretation is much clearer. Given our ability to label these functional zones using 2dg (Born and Tootell, 1992), we chose to focus the bulk of our efforts on retrograde tracers in conjunction with 2dg labeling.
Fig. 4.
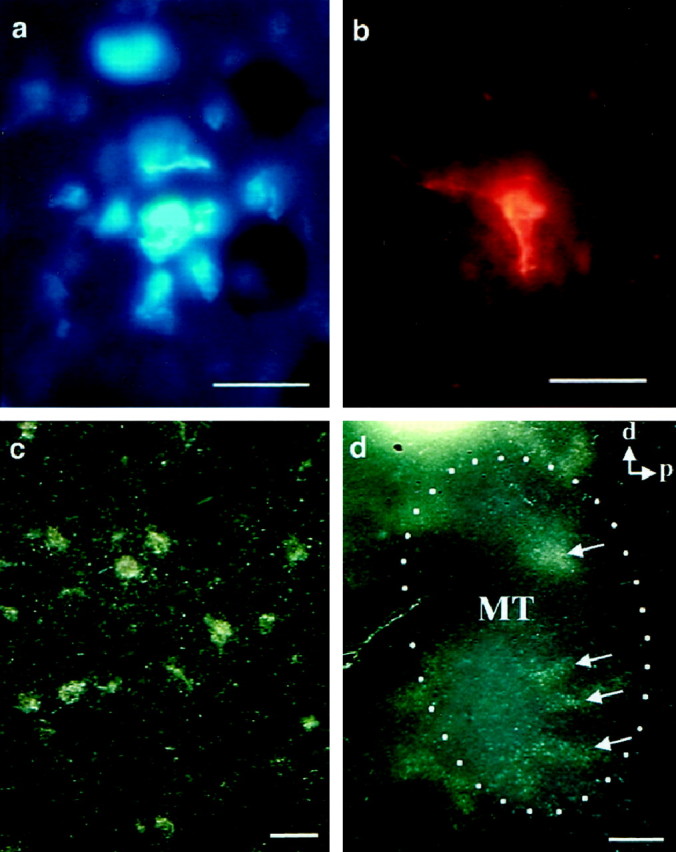
MT neurons labeled by different retrograde tracers. a, Bisbenzimide-labeled cells after an injection into MST. One neuron is shown at the center, surrounded by a dim halo of glial cells. A second labeled neuron can be seen at the top, out of the plane of focus.b, Neuron labeled with fluororuby after an injection into MST. c, Dark-field view of a cluster of WGA-HRP-labeled cells and fibers after an injection into MST.d, Low-power image of the same section shown inc. Patches of labeled cells in MT are shown byarrows. The dotted line indicates the myelin-defined boundaries of MT. Scale bars: a–c, 25 μm; d, 1 mm.
Retrograde labeling of neurons in MT after tracer injections into FST and MST
The relative positions of the injections of retrograde tracers (Fig. 2, Table 1, fifth column) were standardized to permit comparisons between animals. For FST injections (Fig. 2, sites 9–13), we measured the distance along an axis parallel to the STS from the anterior-most boundary of MT, determined by myelin staining, to the injection site and divided this by the total distance between the STS and the lateral sulcus (LS), to account for differences in brain size between animals. For MST injections, we measured the location of injections along an axis running approximately dorsal to ventral and the axis perpendicular to this one (Fig. 2, sites 3–8). The location along the dorsal-ventral axis was obtained by dividing the shortest distance between the injection site and the STS (i.e., a line perpendicular to the STS extending to the injection site) by the total distance between the STS and the LS. This calculation assigns a value of 0 to sites on the STS and a value of 1 to sites on the LS. Thus, for example, injection site 8 of Figure 2 was assigned a location value of 0.83, because it was located quite near the LS. The location along the orthogonal axis was measured from a perpendicular line extending from the end of the STS to the LS. Because this latter distance showed no meaningful correlation with any of our results, we have omitted it from Table 1. Thus, the fifth column of Table 1 lists only the location along the dorsal–ventral axis for our MST injection sites. These measurements were made independently by both authors with very good interobserver agreement (r2 = 0.96).
All 11 injections of retrograde tracers produced retrograde labeling of neurons within MT (Fig. 4), and the patterns were always patchy, consisting of clusters of labeled neurons interspersed with regions of no label (as in Fig. 4c,d). The periodicity of the patches was generally on the order of 1 mm (see Figs. 5, 7, 9, 10) in approximate correspondence with the periodicity of the 2dg patterns obtained from wide-field motion stimuli (Fig. 1b; Born and Tootell, 1992) and with reports of the periodicity of direction columns (Albright et al., 1984; Albright and Desimone, 1987) and binocular disparity columns (DeAngelis and Newsome, 1999) in macaque MT. Because there were relatively few patches produced by any single injection, we did not attempt a quantitative analysis of the periodicity such as has been done for ocular dominance and orientation columns in macaque striate cortex (Obermayer and Blasdel, 1993).
Fig. 5.
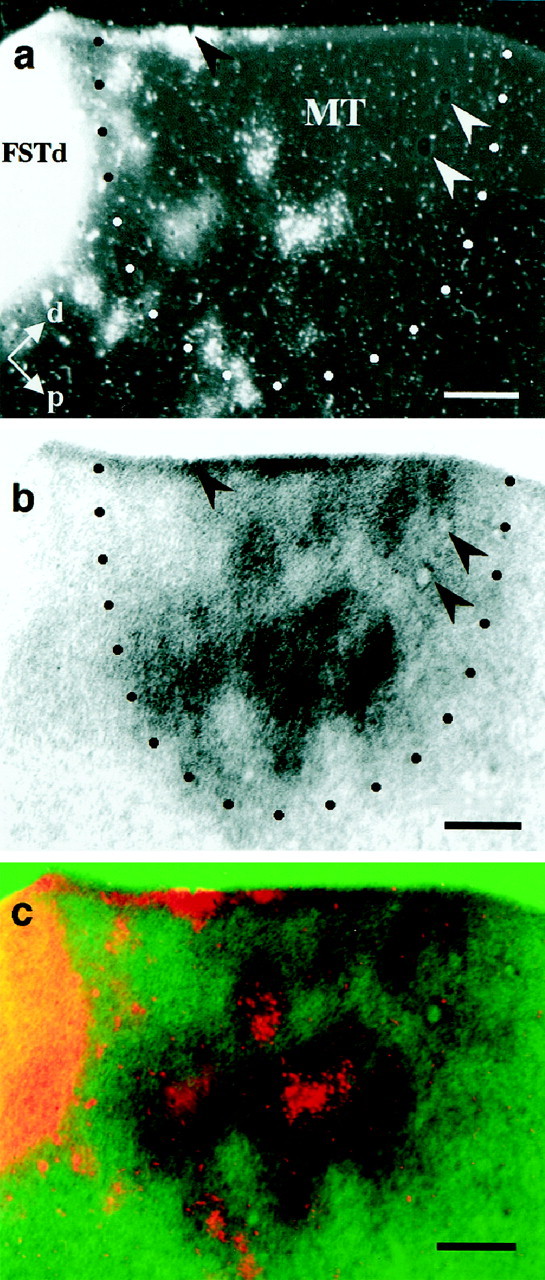
Correspondence between neurons projecting to FSTd and the wide-field–local 2dg pattern. WGA-HRP was injected into area FSTd and, 3 d later, the functional organization was labeled using 2dg. a, Dark-field photomicrograph of the transport pattern of WGA-HRP to MT. The dotted line indicates the myelin-defined border of MT. b, Wide-field–local pattern from the same section. The arrowheads ina and b indicate tissue artifacts used to align the images. c, Superposition of the images ina and b revealing that the labeled cell bodies lie predominantly over the dark regions of the 2dg image (wide-field regions). This degree of overlap was unlikely to have occurred by chance (p = 0.0344) as determined by a Monte Carlo analysis method (see Fig. 6). Scale bars, 1 mm.
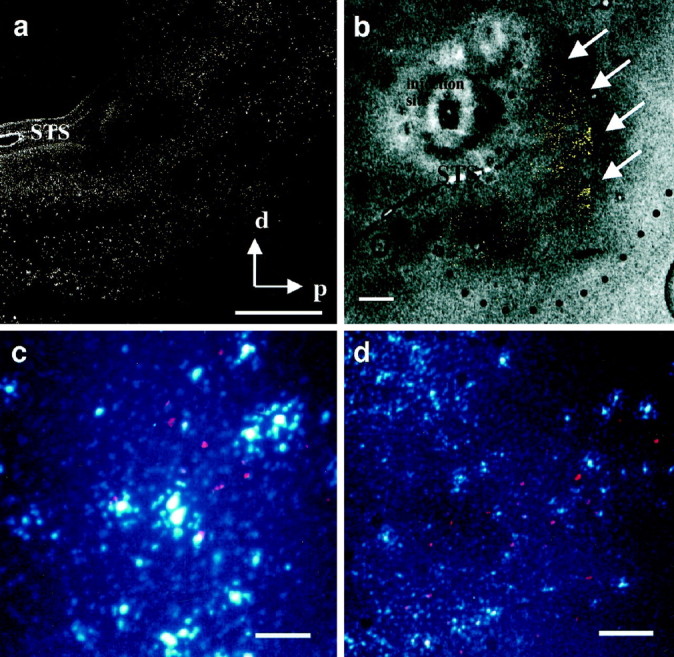
Fig. 7.

Transport to MT and MTc after an injection of the FSTd/v border. a, 2dg image showing the wide-field–local pattern from a single section. The very dark spots marked with stars are artifacts at the margin of the craniotomy made at the time of tracer injection. The defect indicated by a triangle is a tear in the section.b, Myelin stain of an adjacent section showing the boundary of MT. c, Superposition of the pattern of retrograde transport of bisbenzimide (black squares) after an injection into the presumptive border between FSTd and FSTv. The underlying 2dg image is the same as that pictured ina, and both patterns originated from the same tissue section. The border of MT is marked by white dots.d, Superposition of the retrograde transport pattern on the myelin-stained section shown in b. A large number of labeled neurons are clearly outside of MT in the region defined as the MT crescent. The injection site is marked with anasterisk. Scale bar, 1 mm.
Fig. 9.

Correspondence between connections with MST and the wide-field–local 2dg pattern. WGA-HRP and fluororuby were injected into different parts of MST. Seven days after the injections, the functional organization was labeled with 2dg. a,Autoradiograph from a single section showing the wide-field–local pattern. Three dark bands (wide-field regions) running parallel to the STS are marked with arrows.b, Superposition of the 2dg pattern on the retrograde transport of WGA-HRP to MT. Labeled neurons in MT, designated byred squares, lie predominantly within local motion processing regions. This degree of overlap was unlikely to have occurred by chance (p = 0.0205) as determined by a Monte Carlo analysis on the region of interest shown in the white frame. c, Superposition of the anterograde transport of WGA-HRP to MT. Labeled fibers are designated by green triangles, and the site of the injection is marked by an asterisk. Note the similarity in the patterns of anterograde and retrograde transport. Scale bar, 1 mm.
Fig. 10.
Correspondence between MT projections to the ventral part of MST and the wide-field–local 2dg pattern. Bisbenzimide was injected into ventral MST, and, 3 d later, the functional organization was labeled with 2dg. a, Photomontage of labeled neurons in MT. Note the band-like clustering of labeled neurons. b, Pattern of retrograde label shown ina (yellow here) superimposed on the 2dg autoradiograph obtained from the same tissue section.Arrows mark the location of four dark bands (wide-field regions) running approximately parallel to the STS. The dotted line indicates the myelin-defined boundary of MT. The label predominantly overlies the wide-field regions in MT (p = 0.024, Monte Carlo test).c, d, Higher-magnification views of one of the bands of transport showing neurons projecting to both ventral MST (blue) and to FSTd (red). Although both sets of projection neurons occupied similar compartments, no double-labeled neurons were seen. Scale bars: a, b, 1 mm; c, 50 μm; d, 100 μm.
Because the tissue was sectioned parallel to the cortical surface, the laminar location of the labeled cell bodies was not readily apparent in any single section. However, it was clear in all cases that the cell bodies were confined to only a few sections in the supragranular layers. Based on cresyl violet and cytochrome oxidase counterstains from several cases and on our previous correlations of 2dg, single-unit physiology, and histology (Born and Tootell, 1992), we are confident that the labeled neurons were confined to cortical layers 2 and 3.
Injections of FST
We made a total of five injections at various locations along the ventral bank of the STS just anterior and ventral to the border of MT. These ranged from very dorsal injections, immediately adjacent to the MT–FST border (Fig. 2, site 9), to injections 2–3 mm anterior and ventral (Fig. 2, site 12). Kaas and Morel (1993) had previously shown that only the most dorsal part of FST, FSTd, received projections from MT and that the more anterior and ventral portion was connected with the cytochrome oxidase crescent surrounding MT (MTc) (Tootell et al., 1985). Our anterograde tracer results agree with this and further suggest that the neurons within MT projecting to FSTd were those representing wide-field motion. That this is the case is shown in Figure 5. Here an injection of WGA-HRP in FSTd, near the MT–FST border (Fig. 2, site9) produced patchy retrograde transport to MT that was confined to the upper layers (Fig. 5a). The 2dg patterns of wide-field (dark areas) and local (light areas) motion regions from the same tissue section are shown in Figure5b. When these images were aligned and superimposed (Fig.5c), it was apparent that the patches of label were predominantly over dark regions of the 2dg image, corresponding to a subset of the wide-field columns.
Although direct visual comparison was a useful first step in determining whether a meaningful relationship existed between the functional architecture and the connections, we wished to have a quantitative, unbiased measure of the likelihood that a given correspondence occurred by chance. For all of our tests, we first outlined the corresponding rectangular region of each image that contained the majority of the labeled neurons and was completely within MT and confined subsequent analysis to this region of interest. Because both the 2dg patterns and those of the tracers tended to be patchy, parametric techniques, such as ANOVA, were not applicable. We first performed the Wilcoxon rank sum test, a nonparametric analog to thet test for two independent samples, to compare the 2dg values that corresponded to labeled neurons with those that did not. This test revealed a highly significant difference between the two populations for 8 of the 11 tracer injections, and p values approaching significance for 2 of the remaining 3 cases. These values are summarized in Table 1, seventh column.
We also developed a more intuitive, but more involved, procedure using a bootstrap technique (Efron and Tibshirani, 1993) for assigning a probability value to the degree of correspondence observed between any 2dg pattern and a superimposed pattern of anatomical tracers. Like all bootstrap methods, it involved creating multiple permutations of the original data set, a process sometimes referred to as “shuffling,” and then comparing some statistical measure of the original data with the distribution of measures obtained through the shuffling process. In this case we shuffled the 2dg images to produce a large number of 2dg patterns having first- and second-order statistics identical to those of the original. This was done by convolving the real pattern with a white noise pattern of the same size (each pixel was assigned a random value chosen from a uniform distribution on the interval; 0.0,1.0) followed by histogram equalization using the original histogram as a template (Fig. 6a). The resulting shuffled 2dg pattern had the same degree of patchiness (second-order statistics) as the original experimental 2dg pattern and the same distribution of pixel gray-level values (first-order statistics), but the locations and orientations of the patches were randomized. A binarized version of the transport pattern (1 for labeled cells, 0 elsewhere) was superimposed on the shuffled 2dg pattern (Fig.6b), and the population of pixel values in the 2dg image corresponding to the labeled neurons in the tracer image was extracted. This population of values was characterized by its mean and SD, thus producing a pair of “correspondence values” for any given 2dg–tracer image pair. The mean value gave a measure of the extent to which the projection neurons were confined to a given functional zone: if labeled neurons tended to lie over wide-field regions (darker on the 2dg autoradiograph, nearer to 0 in the digitized 2dg image), the mean value would be relatively low, and, if they tended to lie over local motion regions (lighter on the 2dg autoradiograph, nearer to 1 in the digitized 2dg image), the average value would be relatively high. The SD gave a measure of the tightness of clustering of the projection neurons relative to the 2dg pattern.
Fig. 6.

Monte Carlo statistical analysis of correspondence. a, Generation of null hypothesis or “shuffled” images. The two-dimensional fast Fourier transform (fft) of an experimental 2dg pattern was multiplied by the fft of an image of randomly chosen gray-level values. The resulting product was then returned to the spatial domain using the inverse two-dimensional fft, and the histogram of gray levels of this image is matched to that of the original image (data not shown) yielding a shuffled 2dg pattern with first- and second-order statistics identical to those of the original image. The dark lines at 3, 6, 9, and 12 o'clock in the fft image are notch filters used to remove artifacts introduced by discontinuities in pixel values from the left border to the right border and from the bottom border to the top border. The same effect could be produced by applying a two-dimensional Hamming window to the image before the fft. Note that only the power spectrum is displayed (after log transformation and shifting the origin to the center, for ease of viewing), whereas the entire complex transform was used for the shuffling computation. b, Generation of the statistic. A binarized version of the transport pattern (1 for labeled cells, 0 elsewhere) was superimposed on the shuffled 2dg pattern, and the average gray-level value beneath all labeled cells was recorded. This step was repeated 10,000 times to yield a distribution of values with which the experimentally determined value was compared.
This process—generating a different, shuffled 2dg image and extracting the correspondence values with respect to the tracer image—was repeated several thousand times to generate a pair of distributions of random correspondence values (one distribution for the means and one for the SDs). The correspondence values for the experimentally obtained 2dg pattern were then compared with these distributions, and, if the observed values were more extreme than 95% of the values in the random distribution, the correspondence was deemed significant. This final comparison was one-tailed: for the means, we first determined by visual inspection whether to test if the actual value was to the extreme left (for transport localized predominantly to wide-field regions) or right (for transport localized predominantly to local regions) of the random distribution. For the SDs, we tested for values to the extreme left of the random distribution (i.e., for SDs that were significantly smaller than would be obtained by chance).
This method, as applied to the average 2dg values, is illustrated in Figure 6. For the experimental result illustrated in Figure 5 the average 2dg pixel value underneath labeled neurons was 0.3470, and, for one example of a simulated 2dg pattern, this value was 0.4388. When 10,000 such random mean values were generated, each the result of superimposing the actual tracer pattern on a different, simulated 2dg pattern, only 344 of the simulated correspondence values were less than or equal to the actual value of 0.3470. Thus, for this experiment, we conclude that the probability of the labeled neurons lying over regions of the 2dg image that were this dark (i.e., this responsive to wide-field motion) by chance is 0.0344. The results of this test for each of the 11 injections of retrograde tracer are given in Table 1: the eighth column lists p values for the means, and the ninth column lists p values for the SDs.
Given the proximity of the injection site to the border of MT in this case (Figs. 5, 6), we were concerned about the possibility that an appreciable amount of tracer had leaked into MT and thus demonstrated the pattern of intrinsic connections, which have also been shown to be patchy and band-like (Weller et al., 1984). We believe that this did not occur for several reasons. First, the injection site was rendered visible using the extremely sensitive TMB reaction and is thus a generous estimate of the size of the injection. Even so, the resulting injection core boundary did not cross the myelin border of MT (Fig.5a). Second, the laminar pattern of label in MT was confined to only five or six sections (200–240 μm) above layer 4. Intrinsic connections from a large injection spanning all cortical layers would be expected to include supragranular and infragranular layers (Weller et al., 1984). Third, had we injected an appreciable amount of tracer into MT, we would have expected to see labeled neurons in, among other areas, striate cortex; however, no such label was found.
The other four injections along the ventral bank of the STS were more anterior and ventral and included the putative border between FSTd and FSTv (Kaas and Morel, 1993). These injections produced label both within MT and in the crescent area surrounding it (MTc; Fig.7). We matched the distribution of labeled neurons with the pattern of myelin staining (Fig.7b) in an adjacent section to demonstrate that several of the labeled clusters of cells lie clearly outside the limits of MT (Fig. 7d). When we superimposed the transport pattern on the 2dg image (Fig. 7a) of the same section (Fig.7c), it appeared that the label was still largely within the dark regions. Nevertheless, our Monte Carlo test did not reveal this to be a statistically significant correlation (p = 0.436).
To better determine the overall trend of the labeling pattern in this case, we also examined the density of labeled neurons with respect to the 2dg pattern. To do this, we placed a grid (250 μm grid spacing) over the region of interest shown in Figure 7. For the tracer data (Fig. 8a), we counted the number of labeled cell bodies within each grid subdivision, and, for the 2dg data we calculated the average gray-level of all of the pixels within the grid space. We then regressed the 2dg value for each grid space against the number of labeled neurons in that space and found a clear, and highly significant, correlation: regions of highest labeled cell density tended to have the lowest 2dg values (Fig. 8b;r2 = 0.1071, p< 0.00001). Thus even for the cases in which an appreciable amount of tracer was injected into both FSTd and FSTv, the label in MT was predominantly located within wide-field regions. In no case did we find a bias toward labeling of local motion processing regions as the result of an injection on the ventral bank of the STS.
Fig. 8.
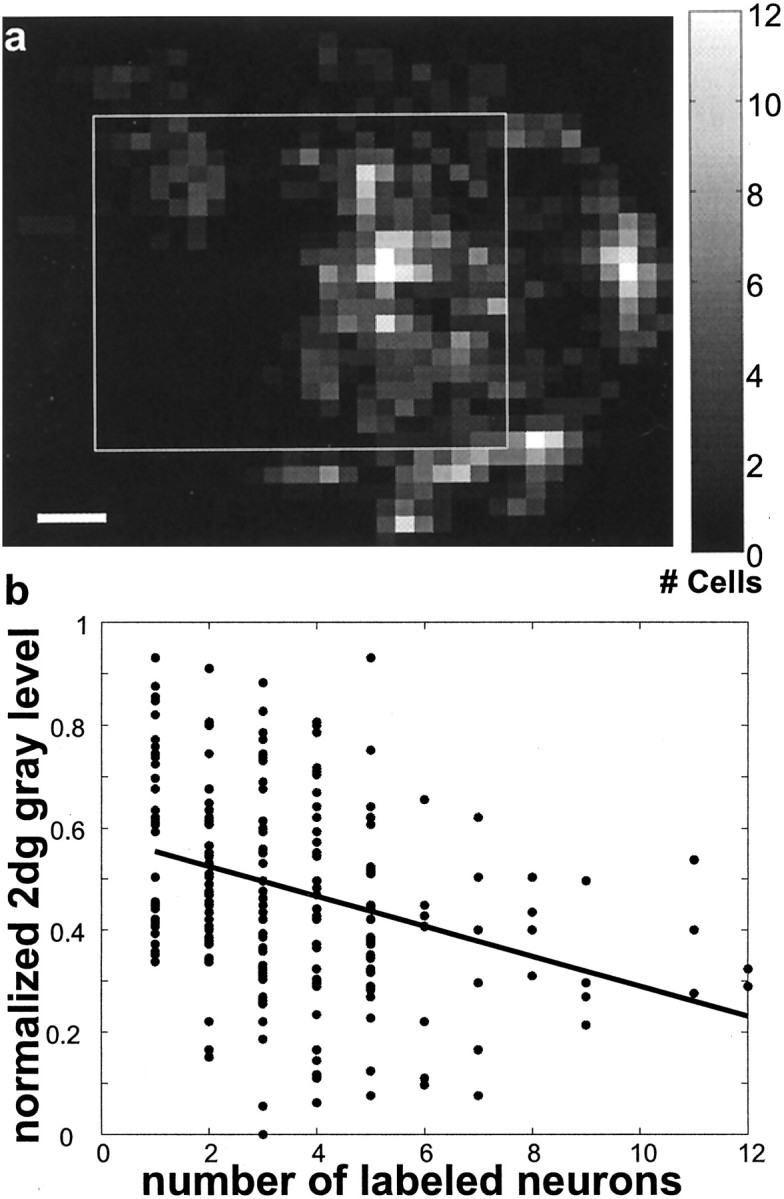
Regression analysis of labeled cell density with 2dg patterns after an injection near the FSTd/v border.a, The density of labeled neurons is shown for the data from Figure 7. Each small grid, 250 μm on a side, is color coded according to the number of labeled neurons present within it. Thewhite box marks the borders of the region of interest used for the regression analysis. Scale bar, 1 mm. b,The average, normalized 2dg gray level corresponding to each grid ina is regressed against the number of labeled neurons present within the same grid. There is a significant tendency for the most densely labeled regions to lie over the darker regions of the 2dg image (r2 = 0.1071;p < 0.00001).
Injections of MST
Injections into regions along the dorsal bank of the STS produced quite different results in that we could get label predominantly within one 2dg compartment within MT or the other depending on the dorsal–ventral location of the injection.
That the dorsal-most part of MST received input predominantly from the local motion processing regions of MT was suggested by the results of our anterograde tracer injection (Fig. 3c). This relationship was confirmed by the retrograde tracer injection at site 8 of Figure 2, the results of which are shown in Figure9. The labeled neurons were found predominantly in the light regions of the 2dg map (Fig. 9a) and systematically avoided the dark regions (Fig. 9b)—a result that was significant by both the rank sum test (p < 0.0001) and the Monte Carlo tests (mean 2dg value, p = 0.0205; SD of 2dg values,p = 0.0019).
Because we injected WGA-HRP at this site (Fig. 2, site 8), we were also able to reconstruct the pattern of anterograde transport found in axon terminals (i.e., projections from MST to MT) in the same sections. We found that they closely matched the patterns observed for retrograde transport (Fig. 9c). We did not perform statistical tests for correspondence in this case or in the other cases of WGA-HRP injections; however, it was perfectly clear that there was a high degree of similarity in all cases. The main differences were that the anterograde transport tended to be more broadly distributed within any given tangential section and to be present in both supragranular and infragranular layers of the cortex.
When we made injections into the ventral part of MST (Fig. 2, site3), we again obtained abundant patchy transport that fell along several bands running approximately parallel with the STS (Fig.10a). This pattern of transport corresponded well with a similar set of dark bands within MT in the 2dg autoradiographs (Fig. 10b), corresponding to regions processing wide-field motion. The level of correspondence was statistically significant using either the Wilcoxon rank sum test (p < 0.0001) or the Monte Carlo test (p = 0.024).
In this same experiment, we also made an injection of WGA-HRP into FSTd (Fig. 2, site 13), and, although the labeled neurons from this injection were also restricted to the wide-field regions of MT (p = 0.002, Monte Carlo test), we found no double-labeled neurons (Fig. 10c,d). This may indicate that separate subpopulations of wide-field motion processing neurons within MT project to FSTd and the ventral part of MST; however, it is difficult to calculate the significance of a lack of double labeling, given that we do not know the fraction of the projection neurons labeled in either case. Nevertheless, the fact that we found only three double-labeled neurons in the four cases for which we made two or more injections of different tracers in the same hemisphere argues for another level of specificity in the projections of MT.
Several MST injections fell at intermediate locations along the dorsal–ventral axis running from the STS to the LS. In these cases, we found that labeled neurons tended, on average, to lie within regions of the 2dg map of intermediate gray level. This result might occur for one of two very different reasons. First, it might indicate that some of the labeled cells were in very dark regions of the 2dg map and some in very light regions. Alternatively, it might mean that most of the neurons were clustered in gray regions of the 2dg map. The mean gray-level value for all labeled neurons cannot distinguish between these two possibilities, but the variance can. If the labeled neurons cluster tightly in gray regions, the SD of the labeled population 2dg values will be smaller than that of the overall population of 2dg values. If the population of labeled neurons is spread out over both compartments, the SD should be greater than or equal to that of the overall population. Because our Monte Carlo simulation generated a distribution of gray levels for each iteration, we could also compare the variance of the experimental distribution with the population of variances obtained using shuffled 2dg patterns. In a number of cases (within MST; Fig. 2, injection sites 3, 4, 6, 8) the SDs from the experimental distribution were significantly smaller than one would expect by chance, indicating a high degree of specificity in the connections even when the labeled neurons were not confined to one of our predefined compartments.
The above result suggested to us that the variations in connectivity between MT and MST might be more continuous than discrete, with position along the dorsal–ventral axis of MST mapping onto the transition from local to wide-field motion processing regions within MT. Although it may be conceptually more appealing to think of neurons as being concerned with either wide-field or local motion processing, as we have shown previously, neither the physiology nor the 2dg patterns have razor-sharp transitions (for example, see Born and Tootell, 1992, their Fig. 3). The physiological correlate of such an intermediate region would be a neuron whose receptive field possessed a relatively weak antagonistic surround—one that would render it less responsive to wide-field motion than to local motion yet not completely unresponsive.
To examine the possibility of a more continuous map of connections, we regressed the mean 2dg value of the MST-projecting neurons within MT against the location of the injection site along the dorsal-ventral axis for each of our six MST injections (Fig. 2, sites3–8). The 2dg values from the region of interest for each experiment were first normalized, and then those values corresponding to labeled neurons were divided by the mean, normalized 2dg value of the entire region of interest, so that values >1 would correspond to regions lighter than average (i.e., more local motion processing), and values <1 would indicate regions darker than average (i.e., more wide-field). This regression analysis (Fig.11) revealed a modest, but highly significant, correlation (r2 = 0.1123; p < 0.00001) between the two variables. Considering only the four sites at which the pattern of labeled neurons was significantly tightly clustered (i.e., the SD of the experimentally obtained distribution was smaller than would be predicted by chance atp < 0.05) slightly improved the correlation (r2 = 0.1374; p< 0.00001). Thus the overall trend in our data from MST injections was for a ventral-to-dorsal gradient of connections corresponding to the graded transition from wide-field to local motion processing regions in MT.
Fig. 11.

MST injections: correlation of injection site with location of transport to MT. The site of each of the six injections into MST (sites 3–8 of Fig. 2) was assigned a dorsal–ventral value as described in Results. The mean, normalized 2dg value of the pixels corresponding to labeled neurons from each case was regressed against the dorsal-ventral value of the site revealing a significant tendency for progressively more dorsal injections to label progressively more local motion processing regions within MT (r2 = 0.1123;p < 0.00001). Sites marked withasterisks had mean transport values that were statistically significant (p < 0.05, Monte Carlo test of means), and sites marked with trianglesshowed statistically significant clustering (p < 0.05, Monte Carlo test of SDs).
The above correlations are quite low, but we suspect that various experimental factors beyond our control combined to decrease their strength. When we performed the regression analysis, we used the entire population of labeled cells from each case. There was a fair amount of noise in the 2dg images, and a certain amount of scatter in the population of neurons labeled because of the local spread of tracer and to uptake from severed axons of passage. There was also undoubtedly some variation introduced by using an imperfect measure of the location of injection site (i.e., normalized distance between the LS and STS) and by comparing results between animals. Given that we did not use filtered or averaged 2dg images, and that we were unable to correct for tracer-related scatter, we think that the correlations obtained probably represent a lower limit.
DISCUSSION
Our results are summarized in Figure12. We found that different functional domains within MT, specialized for processing wide-field and local motion cues, make selective connections with subsequent visual areas. The wide-field regions of MT project preferentially to FSTd and to the ventral part of MST. The local motion processing regions project mainly to the most dorsal part of MST. This anatomical specificity was observed using two different approaches: microelectrode recording followed by injection of anterograde tracers and injection of retrograde tracers followed by 2dg labeling of the functional organization.
Fig. 12.

Summary of projections from MT to visual areas on the STS. A typical autoradiograph of the wide-field–local 2dg pattern on which are superimposed the principle corticocortical connections described in this study. Dotted and dashed lines designate the boundaries between visual areas. The projection sites of wide-field motion processing regions within MT are different from those of regions concerned with local motion contrast.d, Dorsal; p, posterior;LS, lateral sulcus; STS, superior temporal sulcus; MT, middle temporal area; MTc, crescent of the middle temporal area; MST, medial superior temporal area;FSTd,FSTv, dorsal and ventral subdivisions of the fundus of the superior temporal sulcus. Scale bar, 1 mm.
Previous studies
The historical trend in the study of cortical areas has been to subdivide them more finely as more detailed studies of function and connectivity are performed (Felleman and Van Essen, 1991). This certainly has been the case with the regions along the STS in both New and Old World monkeys. In the owl monkey, Weller and colleagues (1984)initially defined a single large MT projection zone, area ST, that included cortical regions rostral to MT on both the ventral and dorsal banks of the STS, although they suggested that this region probably contained two visual areas. Subsequently, Krubitzer and Kass (1990)divided ST into two distinct areas based on myeloarchitecture and connections with MT: one on the ventral bank of the STS, area FST, and one on the dorsal bank, area MST. They further suggested that these areas were homologous to FST and MST in the macaque (Maunsell and Van Essen, 1983; Desimone and Ungerleider, 1986; Ungerleider and Desimone, 1986). Most recently, Kass and Morel (1993) have provided evidence that owl monkey FST actually consists of two areas: a more dorsal area, FSTd, receiving input from MT and another more anterior and ventral area, FSTv, not connected to MT but, rather, receiving its predominant inputs from the MT crescent. Our results are consistent with this scheme, and they further indicate that the inputs to FSTd are predominantly from the wide-field motion processing regions of MT.
Owl monkey MST: one area or two?
Our data show that MST is heterogeneous with respect to its inputs from MT: the most dorsal part of MST receives input predominantly from local motion processing regions of MT, and the ventral part receives input predominantly from regions responding to wide-field motion. This could be taken as evidence that MST consists of two discrete areas (Fig. 13c,d); however, it could also indicate a more continuous type of representation along the dorsal–ventral axis in MST (Fig. 13a,b). Either model would make similar predictions regarding retrograde transport of tracer injected into the extreme dorsal or ventral parts of MST (Fig.13a,c). They would differ, however, in their predictions regarding injections into the intermediate region: in the discrete case, an injection near the border would result in “bimodal” transport to the centers of both wide-field and local motion processing regions (Fig. 13d), whereas in the continuous case, the transport would be “unimodal” and clustered in the intermediate regions between the two regions (Fig. 13b). The evidence from the intermediate injections (Fig. 2, sites 4–7) in this study favors the continuous model—transport to MT was predominantly to the regions between wide-field and local motion processing regions and, in two of the four cases, was more tightly clustered than would be expected by chance.
Fig. 13.

Two possible models of owl monkey MST. Area MST may be considered either as two distinct visual areas (c, d) or as a single area organized in a dorsal-to-ventral gradient (a, b). Both models can explain the localization of transport to wide-field and local motion processing regions with injections into the ventral and dorsal regions of MST, respectively (a, c). The models differ in their predictions concerning injections into the intermediate region of MST (b, d). W, Wide-field motion processing regions; L, local motion processing regions.
Homology with visual areas of the macaque
Whether MST is thought of as two distinct areas, our anatomical evidence for functional heterogeneity strengthens the argument that this region is homologous to MST of the macaque, where physiological evidence for subregions specialized for wide-field (dorsal MST, or MSTd) and local (lateral MST, or MSTl) motion processing has been found (Tanaka et al., 1986; Komatsu and Wurtz, 1988; Eifuku and Wurtz 1998). We think it most likely that the more ventral and anterior region of owl monkey MST is the homolog of macaque MSTd, because it is this region that receives dominant input from wide-field motion regions of MT. Conversely, the dorsal region of owl monkey MST would be the likely homolog of macaque MSTl, because it receives its input primarily from the local motion processing regions of MT. Although this assignment might seem backward from the point of view of cardinal anatomical axes (i.e., dorsal–ventral and lateral–medial), it is possible that more fundamental local relationships based on retinotopy are conserved between the two species. Thus the owl monkey wide-field recipient zones, FSTd and ventral MST, border the representation of the extreme visual periphery in MT, as does MSTd in the macaque. Conversely, the owl monkey's local motion processing recipient zone, dorsal MST, is wrapping around nearer to the representation of central vision, similar to the relationship between MSTl and foveal MT in the macaque.
The tentative assignments of homology above are based on the notion that cortical regions having similar types of response properties tend to be interconnected. Thus, for example, the local motion processing regions of owl monkey MT should confer surround antagonism on the neurons to which they project in the dorsal part of MST—properties that also have been reported in macaque MSTl (Eifuku and Wurtz, 1998). Nevertheless, it is conceivable that neurons with this sort of receptive field, i.e., those with antagonistic surrounds, could also be used to construct the sort of wide-field, complex motion receptive fields described in macaque MSTd (Tanaka et al., 1986; Komatsu and Wurtz, 1988; Duffy and Wurtz, 1991). This issue should be settled either by physiological recordings from MST in the owl monkey or by more detailed anatomical studies in the macaque.
Given the predominantly wide-field MT input to ventral MST and dorsal FST in the owl monkey, it is somewhat surprising that these regions were not labeled by 2dg in conjunction with wide-field motion stimuli. One reason for this might be a poor overall response to planar motion attributable, perhaps, to selectivity for complex motion, such as expansion, contraction, or rotation. Other possibilities include either decreased neuronal responses or decreased coupling of metabolism to neural activity, which is the basis for the 2dg signal, in an anesthetized preparation. Any or all of these might contribute to a lack of 2dg signal in areas beyond MT. Again, physiological recordings from these areas should clarify the matter.
Functional implications
Our data suggest that the segregation of wide-field and local motion processing begun in MT is continued at higher levels of the visual system. This would seem to make good sense, because the two different kinds of motion tend to indicate fundamentally different kinds of events in the world. Motion of large regions of the visual field almost always occur because of observer motion—instances in which the entire visual scene actually does move are usually misinterpreted as illusory motion either of oneself, referred to as “vection” (Fischer and Kornmüller, 1930), or of an attended stationary or moving object, known as “induced motion” (Duncker, 1929) (for review and discussion, also see Reinhardt-Rutland, 1988;Heckmann and Howard, 1991). Local motion contrast, that is, the movement of something with respect to the immediate surround, is stronger visual evidence for the existence of an object moving in the world. Direction-selective neurons with antagonistic surrounds, described in numerous species (Sterling and Wickelgren, 1969; Collett, 1971; Frost et al., 1981; Allman et al., 1985; Tanaka et al., 1986;Egelhaaf et al., 1988; Komatsu and Wurtz, 1988), seem well suited to participate in this sort of calculation. This existence of separate, parallel subsystems for the computation of object and background motion has been described in considerable detail for flies (for review, seeEgelhaaf et al., 1988), and it appears that primates may have independently evolved a similar strategy.
A somewhat different, although related, interpretive angle on parallel processing within the motion pathways relates to the problem of segmentation versus integration of low-level motion cues. Visual motion perception requires that the information from local motion detectors be combined in ways that are mutually exclusive: for veridical velocity estimates in a noisy world, integrative processes, which average and smooth local signals, are required; whereas, for accurate detection of motion-defined boundaries, differential processes, which maximize motion contrast, are needed (Braddick, 1993). One set of solutions to this dilemma involves parallel processing of motion cues at different spatial scales. In such a scheme, one subsystem integrates local motion cues over large regions of the visual field, whereas another, parallel subsystem performs something like a spatial derivative on local motion cues. This type of approach has been used successfully to model both a number of the properties of higher-order motion processing neurons in the primate (Nowlan and Sejnowski, 1995) and motion perception (Lidén and Pack, 1999). Interestingly, the two parallel networks used in Nowlan and Sejnowski's algorithm, one for the integration of local velocity cues and one for the “selection” of the appropriate regions of the visual scene to integrate, comprise units with properties similar to those of the receptive fields of wide-field and local motion processing regions, respectively.
Footnotes
This work was supported by National Institutes of Health Grants EY11379 and EY12196 and the Harvard-Mahoney Neuroscience Institute. We are grateful to Elin Kaufman and Ying Zhang for excellent technical assistance at various phases of this work and to Luis Tollinche, who assisted with computer reconstructions of some of the transport images. We also thank Michael Shadlen for advice on the Monte Carlo test. We received helpful comments on this manuscript from Marge Livingstone, Chris Pack, Elio Raviola, and Marty Usrey.
Correspondence should be addressed to Richard T. Born, Department of Neurobiology, Harvard Medical School, 220 Longwood Avenue, Boston, MA 02115-5701. E-mail: rborn@hms.harvard.edu.
REFERENCES
- 1.Albright TD, Desimone R. Local precision of visuotopic organization in the middle temporal area (MT) of the macaque. Exp Brain Res. 1987;65:582–592. doi: 10.1007/BF00235981. [DOI] [PubMed] [Google Scholar]
- 2.Albright TD, Desimone R, Gross CG. Columnar organization of directionally selective cells in visual area MT of the macaque. J Neurophysiol. 1984;51:16–31. doi: 10.1152/jn.1984.51.1.16. [DOI] [PubMed] [Google Scholar]
- 3.Allman JM, Miezin F, McGuinness E. Direction- and velocity-specific responses from beyond the classical receptive field in the middle temporal visual area (MT). Perception. 1985;14:105–126. doi: 10.1068/p140105. [DOI] [PubMed] [Google Scholar]
- 4.Born RT, Tootell RBH. Segregation of global and local motion processing in primate middle temporal visual area. Nature. 1992;357:497–499. doi: 10.1038/357497a0. [DOI] [PubMed] [Google Scholar]
- 5.Braddick O. Segmentation versus integration in visual motion processing. Trends Neurosci. 1993;16:263–268. doi: 10.1016/0166-2236(93)90179-p. [DOI] [PubMed] [Google Scholar]
- 6.Collett TS. Visual neurones for tracking moving targets. Nature. 1971;232:127–130. doi: 10.1038/232127a0. [DOI] [PubMed] [Google Scholar]
- 7.DeAngelis GC, Newsome WT. Organization of disparity-selective neurons in macaque area MT. J Neurosci. 1999;19:1398–1415. doi: 10.1523/JNEUROSCI.19-04-01398.1999. [DOI] [PMC free article] [PubMed] [Google Scholar]
- 8.Desimone R, Ungerleider LG. Multiple visual areas in the caudal superior temporal sulcus of the macaque. J Comp Neurol. 1986;248:164–189. doi: 10.1002/cne.902480203. [DOI] [PMC free article] [PubMed] [Google Scholar]
- 9.Dolleman-Van der Weel MJ, Wouterlood FG, Witter MP. Multiple anterograde tracing, combining phaseolus vulgaris leucoagglutinin with rhodamine- and biotin-conjugated dextran amine. J Neurosci Methods. 1994;51:9–21. doi: 10.1016/0165-0270(94)90021-3. [DOI] [PubMed] [Google Scholar]
- 10.Duffy CJ, Wurtz RH. Sensitivity of MST neurons to optic flow stimuli. I. A continuum of response selectivity to large-field stimuli. J Neurophysiol. 1991;65:1329–1345. doi: 10.1152/jn.1991.65.6.1329. [DOI] [PubMed] [Google Scholar]
- 11.Duncker K. Über induzierte Bewegung (Ein Beitrag zur Theorie optisch wahrgenommener Bewegung). Psychol Forsch. 1929;12:180–259. [Google Scholar]
- 12.Efron B, Tibshirani RJ. An introduction to the bootstrap. Chapman and Hall; New York: 1993. [Google Scholar]
- 13.Egelhaaf M, Hausen K, Reichardt W, Wehrhahn C. Visual course control in flies relies on neuronal computation of object and background motion. Trends Neurosci. 1988;11:351–358. doi: 10.1016/0166-2236(88)90057-4. [DOI] [PubMed] [Google Scholar]
- 14.Eifuku S, Wurtz RH. Response to motion in extrastriate area MSTl: center-surround interactions. J Neurophysiol. 1998;80:282–296. doi: 10.1152/jn.1998.80.1.282. [DOI] [PubMed] [Google Scholar]
- 15.Felleman DJ, Kaas JH. Receptive-field properties of neurons in middle temporal visual area (MT) of owl monkeys. J Neurophysiol. 1984;52:488–513. doi: 10.1152/jn.1984.52.3.488. [DOI] [PubMed] [Google Scholar]
- 16.Felleman DJ, Van Essen DC. Distributed hierarchical processing in the primate cerebral cortex. Cereb Cortex. 1991;1:1–47. doi: 10.1093/cercor/1.1.1-a. [DOI] [PubMed] [Google Scholar]
- 17.Fischer MH, Kornmüller AE. Optokinetisch ausgelöste Bewegungswahrnehmungen und optokinetischer Nystagmus. J Psychol Neurol. 1930;41:273–308. [Google Scholar]
- 18.Frost BJ, Scilley PL, Wong SCP. Moving background patterns reveal double-opponency of directionally specific pigeon tectal neurons. Exp Brain Res. 1981;43:173–185. doi: 10.1007/BF00237761. [DOI] [PubMed] [Google Scholar]
- 19.Gallyas F. Silver staining of myelin by means of physical development. Neurol Res. 1979;1:203–206. doi: 10.1080/01616412.1979.11739553. [DOI] [PubMed] [Google Scholar]
- 20.Heckmann T, Howard IP. Induced motion: isolation and dissociation of egocentric and vection- entrained components. Perception. 1991;20:285–305. doi: 10.1068/p200285. [DOI] [PubMed] [Google Scholar]
- 21.Hubel DH, Wiesel TN. Receptive fields, binocular interaction and functional architecture in the cat's visual cortex. J Physiol (Lond) 1962;160:106–154. doi: 10.1113/jphysiol.1962.sp006837. [DOI] [PMC free article] [PubMed] [Google Scholar]
- 22.Hubel DH, Wiesel TN. Receptive fields and functional architecture of monkey striate cortex. J Physiol (Lond) 1968;195:215–243. doi: 10.1113/jphysiol.1968.sp008455. [DOI] [PMC free article] [PubMed] [Google Scholar]
- 23.Kaas JH, Morel A. Connections of visual areas of the upper temporal lobe of owl monkeys: the MT crescent and dorsal and ventral subdivisions. J Neurosci. 1993;13:534–546. doi: 10.1523/JNEUROSCI.13-02-00534.1993. [DOI] [PMC free article] [PubMed] [Google Scholar]
- 24.Komatsu H, Wurtz RH. Relation of cortical areas MT and MST to pursuit eye movements. I. Localization and visual properties of neurons. J Neurophysiol. 1988;60:580–603. doi: 10.1152/jn.1988.60.2.580. [DOI] [PubMed] [Google Scholar]
- 25.Krubitzer LA, Kaas JH. Cortical connections of MT in four species of primates: areal, modular, retinotopic patterns. Vis Neurosci. 1990;5:165–204. doi: 10.1017/s0952523800000213. [DOI] [PubMed] [Google Scholar]
- 26.Lidén L, Pack C. The role of terminators and occlusion cues in motion integration and segmentation: a neural network model. Vision Res. 1999;39:3301–3320. doi: 10.1016/s0042-6989(99)00055-3. [DOI] [PubMed] [Google Scholar]
- 27.Malonek D, Tootell RB, Grinvald A. Optical imaging reveals the functional architecture of neurons processing shape and motion in owl monkey area MT. Proc R Soc Lond B Biol Sci. 1994;258:109–119. doi: 10.1098/rspb.1994.0150. [DOI] [PubMed] [Google Scholar]
- 28.Maunsell JH, Van Essen DC. The connections of the middle temporal visual area (MT) and their relationship to a cortical hierarchy in the macaque monkey. J Neurosci. 1983;3:2563–2586. doi: 10.1523/JNEUROSCI.03-12-02563.1983. [DOI] [PMC free article] [PubMed] [Google Scholar]
- 29.Mesulam MM. Principles of horseradish peroxidase neurohistochemistry and their applications for tracing neural pathways—axonal transport, enzyme histochemistry and light microscopic analysis. In: Mesulam MM, editor. Tracing neural connections with horseradish peroxidase. Wiley; New York: 1982. pp. 1–151. [Google Scholar]
- 30.Mountcastle VB. Modality and topographic properties of single neurons of cat's somatic sensory cortex. J Neurophysiol. 1957;20:408–434. doi: 10.1152/jn.1957.20.4.408. [DOI] [PubMed] [Google Scholar]
- 31.Mountcastle VB. The columnar organization of the neocortex. Brain. 1997;120:701–722. doi: 10.1093/brain/120.4.701. [DOI] [PubMed] [Google Scholar]
- 32.Nowlan SJ, Sejnowski TJ. A selection model for motion processing in area MT of primates. J Neurosci. 1995;15:1195–1214. doi: 10.1523/JNEUROSCI.15-02-01195.1995. [DOI] [PMC free article] [PubMed] [Google Scholar]
- 33.Obermayer K, Blasdel GG. Geometry of orientation and ocular dominance columns in monkey striate cortex. J Neurosci. 1993;13:4114–4129. doi: 10.1523/JNEUROSCI.13-10-04114.1993. [DOI] [PMC free article] [PubMed] [Google Scholar]
- 34.Reinhardt-Rutland AH. Induced movement in the visual modality: an overview. Psychol Bull. 1988;103:57–71. doi: 10.1037/0033-2909.103.1.57. [DOI] [PubMed] [Google Scholar]
- 35.Sokoloff L, Reivich M, Kennedy C, Des Rosiers MH, Patlak CS, Pettigrew KD, Sakurada O, Shinohara M. The [14C]-deoxyglucose method for the measurement of local cerebral glucose utilization: theory, procedure, and normal values in the conscious and anesthetized albino rat. J Neurochem. 1977;28:897–916. doi: 10.1111/j.1471-4159.1977.tb10649.x. [DOI] [PubMed] [Google Scholar]
- 36.Sterling P, Wickelgren BG. Visual receptive fields in the superior colliculus of the cat. J Neurophysiol. 1969;32:1–15. doi: 10.1152/jn.1969.32.1.1. [DOI] [PubMed] [Google Scholar]
- 37.Tanaka K, Hikosaka K, Saito H, Yukie M, Fukada Y, Iwai E. Analysis of local and wide-field movements in the superior temporal visual areas of the macaque monkey. J Neurosci. 1986;6:134–144. doi: 10.1523/JNEUROSCI.06-01-00134.1986. [DOI] [PMC free article] [PubMed] [Google Scholar]
- 38.Tootell RBH, Silverman MS. Two methods for flat-mounting cortical tissue. J Neurosci Methods. 1985;15:177–190. doi: 10.1016/0165-0270(85)90097-4. [DOI] [PubMed] [Google Scholar]
- 39.Tootell RBH, Hamilton SL, Silverman MS. Topography of cytochrome oxidase activity in owl monkey cortex. J Neurosci. 1985;5:2786–2800. doi: 10.1523/JNEUROSCI.05-10-02786.1985. [DOI] [PMC free article] [PubMed] [Google Scholar]
- 40.Ungerleider LG, Desimone R. Cortical connections of visual area MT in the macaque. J Comp Neurol. 1986;248:190–222. doi: 10.1002/cne.902480204. [DOI] [PubMed] [Google Scholar]
- 41.Weller RE, Wall JT, Kaas JH. Cortical connections of the middle temporal visual area (MT) and the superior temporal cortex in owl monkeys. J Comp Neurol. 1984;228:81–104. doi: 10.1002/cne.902280109. [DOI] [PubMed] [Google Scholar]
- 42.Wong-Riley MT. Columnar cortico-cortical interconnections within the visual system of the squirrel and macaque monkeys. Brain Res. 1979;162:201–217. doi: 10.1016/0006-8993(79)90284-1. [DOI] [PubMed] [Google Scholar]
- 43.Zeki S. The response properties of cells in the middle temporal area (area MT) of owl monkey visual cortex. Proc R Soc Lond B Biol Sci. 1980;207:239–248. doi: 10.1098/rspb.1980.0022. [DOI] [PubMed] [Google Scholar]