Abstract
Cell-free DNA (cfDNA) in the blood provides a noninvasive diagnostic avenue for patients with cancer1. However, characteristics of the origins and molecular features of cfDNA are poorly understood. We developed an approach to evaluate fragmentation patterns of cfDNA across the genome and found that cfDNA profiles of healthy individuals reflected nucleosomal patterns of white blood cells, while patients with cancer had altered fragmentation profiles. We applied this method to analyze fragmentation profiles of 236 patients with breast, colorectal, lung, ovarian, pancreatic, gastric, or bile duct cancer and 245 healthy individuals. A machine learning model incorporating genome-wide fragmentation features had sensitivities of detection ranging from 57% to >99% among the seven cancer types at 98% specificity, with an overall AUC of 0.94. Fragmentation profiles could be used to identify the tissue of origin of the cancers to a limited number of sites in 75% of cases. Combining our approach with mutation based cfDNA analyses detected 91% of cancer patients. The results of these analyses highlight important properties of cfDNA and provide a proof of principle approach for screening, early detection, and monitoring of human cancer.
Much of the morbidity and mortality of human cancers worldwide results from late diagnosis where therapeutic intervention is less effective2,3. Unfortunately, clinically proven biomarkers that can be used to broadly diagnose and treat patients are not widely available4. Recent analyses of circulating cfDNA suggest that approaches using tumor-specific alterations may provide new avenues for early diagnosis but not all patients have detectable changes5–8. Whole genome sequencing (WGS) of cfDNA can identify chromosomal abnormalities in cancer patients but detecting such alterations may be challenging due to the small number of abnormal chromosomal changes9–12. Analyses of the size of cfDNA fragments have been contradictory, indicating both increases13–16 and decreases in the overall distribution of cfDNA12,17–19. Recent studies have suggested that size selection of small cfDNA can increase enrichment of circulating tumor DNA (ctDNA) in late-stage cancer patients17. Nucleosome positions18,20, patterns near transcription start sites20,21, and the end positions of cfDNA22 may be altered in cancer but the sequencing needed to identify nucleosomes is impractical for routine analyses.
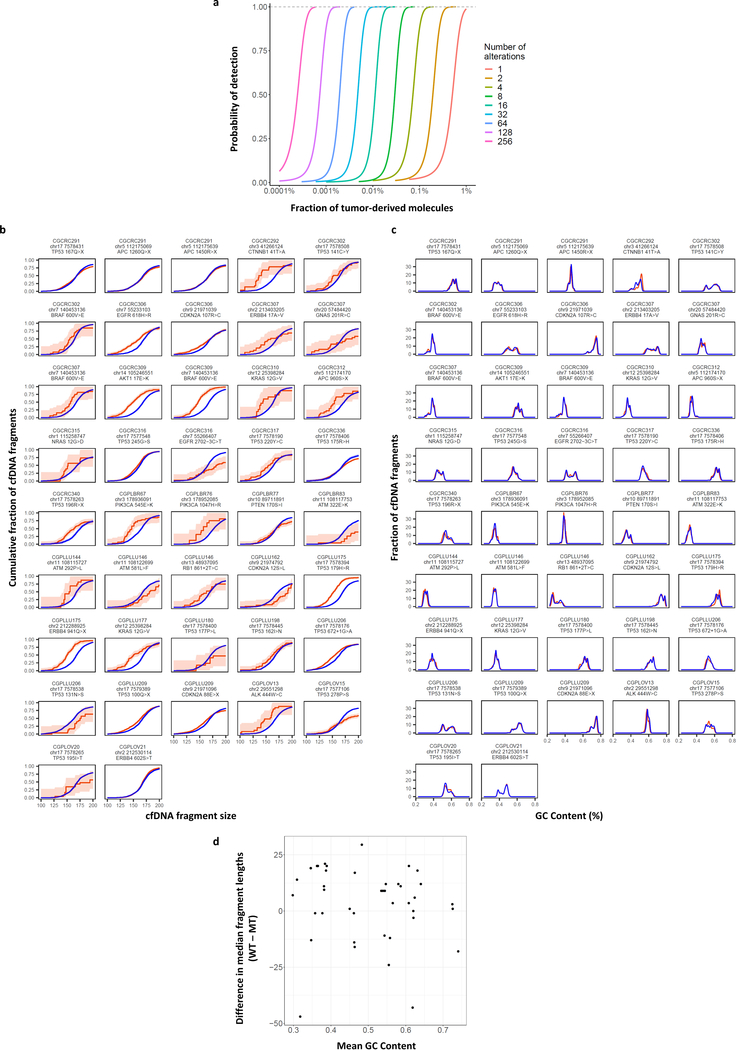
Conceptually, the sensitivity of any cfDNA approach depends on the number of alterations examined as well as the technical and biological limitations of detecting such changes. As a typical blood sample contains ~2000 genome equivalents of cfDNA per milliliter of plasma5, the theoretical limit of detection of a single alteration can be no better than one in a few thousand mutant to wild-type molecules. We hypothesized that detection of a larger number of alterations in the genome may be more sensitive for detecting cancer in the circulation. Monte Carlo simulations showed that increasing the number of abnormalities detected from a few to tens or hundreds can improve the limit of detection, similar to recent analyses of methylation changes in cfDNA23 (Extended Data Fig. 1a).
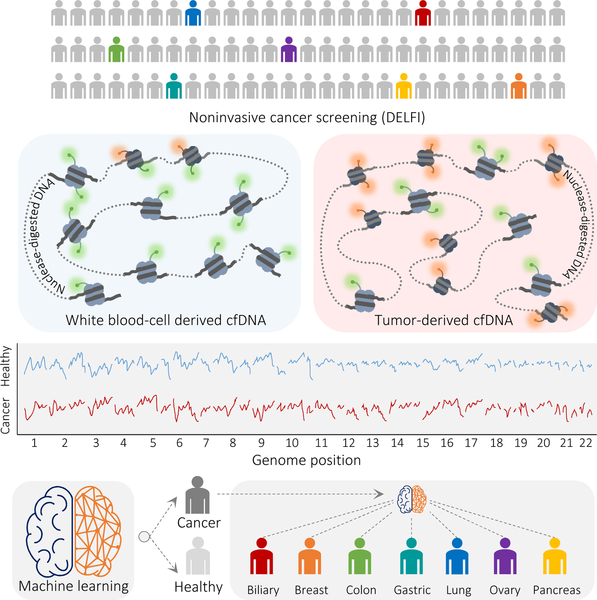
We developed an approach called DELFI (DNA evaluation of fragments for early interception, Fig. 1) to detect a large number of abnormalities in cfDNA through genome-wide analysis of fragmentation patterns. The method is based on low coverage WGS of isolated cfDNA. Mapped sequences are analyzed in non-overlapping windows covering the genome. Conceptually, windows may range in size from thousands to millions of bases, resulting in hundreds to thousands of windows in the genome. We used 5 Mb windows for evaluating cfDNA fragmentation patterns as this provided >20,000 reads per window at 1–2x genome coverage. Within each window, we examined coverage and size distribution of cfDNA fragments in healthy and cancer populations (Supplementary Table 1). The genome-wide pattern from an individual can be compared to reference populations to determine if the pattern is likely healthy or cancer-derived. As genome-wide profiles may reveal differences associated with specific tissues, these patterns may also indicate the tissue source of cfDNA.
Fig. 1. Schematic of DELFI approach.
Blood is collected from healthy individuals and patients with cancer. cfDNA is extracted from plasma, processed into sequencing libraries, examined through WGS, mapped to the genome, and analyzed to determine cfDNA fragmentation profiles across the genome. Machine learning is used to categorize whether individuals have cancer and identify tumor tissue of origin.
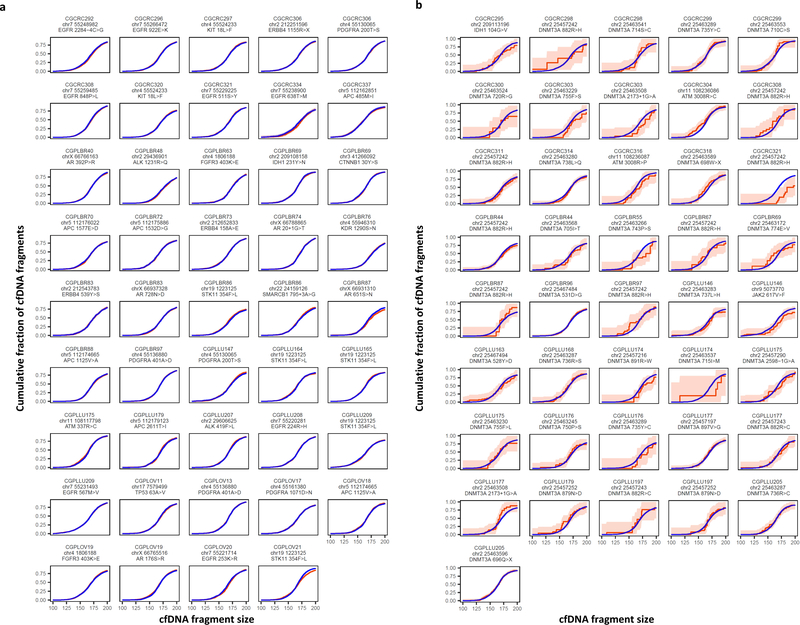
We focused on fragmentation size of cfDNA as we found that cancer-derived cfDNA may be more variable in length than cfDNA from non-cancer cells. We initially examined cfDNA from targeted regions captured and sequenced at high coverage from patients with breast, colorectal, lung or ovarian cancer5 (Supplementary Tables 1, 2, 3). Analyses of loci containing 165 tumor-specific alterations from 81 patients revealed an average absolute difference of 6.5 bp (95% CI, 5.4–7.6 bp) between lengths of median mutant and wild-type cfDNA fragments, with mutant cfDNA fragments ranging from 30 bases smaller to 47 bases larger (Extended Data Fig. 1b, Supplementary Table 3). GC content was similar for mutated and non-mutated fragments, with no correlation between GC content and fragment length (Extended Data Fig. 1c, d). Analyses of 44 germline alterations from 38 patients identified median cfDNA size differences <1 bp between different alleles (Extended Data Fig. 2a, Supplementary Table 3). For 41 alterations related to clonal hematopoiesis5 there were no significant differences between cfDNA fragments containing such alterations and wild-type fragments (Extended Data Fig. 2b, Supplementary Table 3). Overall, cancer-derived cfDNA fragment lengths were more variable compared to non-cancer cfDNA (p<0.001, variance ratio test). We hypothesized that these differences may reflect changes in chromatin structure as well as other genomic and epigenomic abnormalities in cancer24,25 and that cfDNA fragmentation in a position-specific manner could serve as a biomarker for cancer detection.
As targeted sequencing analyzes a limited number of loci, we investigated whether genome-wide analyses would detect additional abnormalities from cfDNA fragmentation. In a pilot analysis, we isolated cfDNA from ~4 ml of plasma from 8 stage I-III lung cancer patients and 30 healthy individuals (Supplementary Tables 1, 4, 5), and performed WGS at ~9x coverage (Supplementary Table 4). As expected12,18,19, median overall cfDNA fragment lengths of healthy individuals were larger than those of cancer patients (167.3 bp and 163.8, respectively, p<0.01, Welch’s t-test) (Supplementary Table 5). To examine differences in fragment size and coverage in a position-dependent manner across the genome, we mapped fragments to their genomic origin and evaluated fragment lengths in 504 windows of 5 Mb, covering ~2.6 Gb of the genome. For each window, we determined the fraction of small cfDNA fragments (100 to 150 bp) to larger cfDNA fragments (151 to 220 bp) and overall coverage to obtain genome-wide fragmentation profiles for each sample.
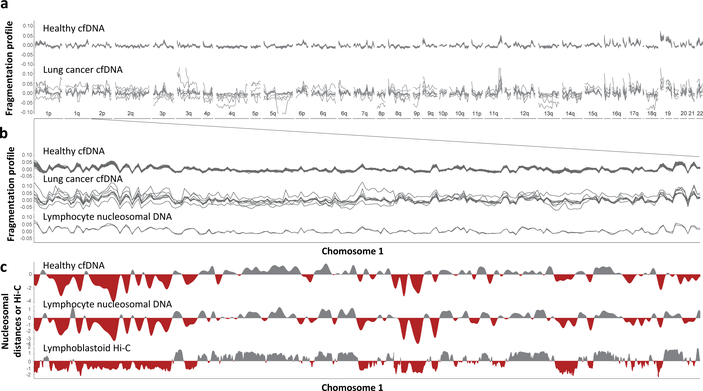
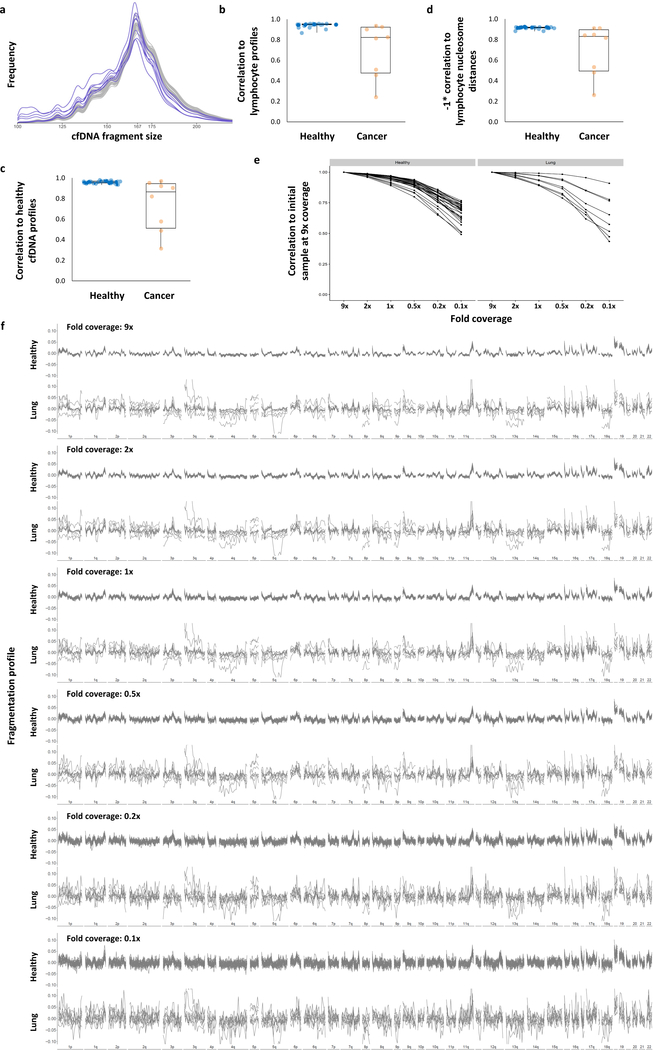
We found that healthy individuals had similar genome-wide fragmentation profiles (Fig. 2a, b, Extended Data Fig. 3a). To examine the origins of cfDNA fragmentation patterns, we isolated and nuclease treated nuclei from lymphocytes of two healthy individuals to obtain nucleosomal DNA fragments. Healthy cfDNA patterns were highly correlated to lymphocyte nucleosomal DNA fragmentation profiles and nucleosome distances (Fig. 2b, c, Extended Data Fig. 3b, c). Median distances between nucleosomes in lymphocytes were correlated to Hi-C open (A) and closed (B) compartments of lymphoblastoid cells (Fig. 2c)26,27. These analyses suggest that fragmentation patterns of normal cfDNA are the result of nucleosomal DNA patterns that reflect the chromatin structure of normal blood cells.
Fig. 2. Aberrant cfDNA fragmentation profiles in patients with cancer.
a, Genome-wide cfDNA fragmentation profiles (defined as the ratio of short to long fragments) from ~9x WGS are shown in 5 Mb bins for 30 healthy individuals (top) and 8 lung cancer patients (bottom). b, Analyses of healthy cfDNA (top), lung cancer cfDNA (middle), and healthy lymphocyte (bottom) fragmentation profiles from chromosome 1 at 1 Mb resolution. Healthy lymphocyte profiles were scaled with a standard deviation equal to that of the median healthy cfDNA profiles. c, Smoothed median distances between adjacent nucleosome centered at zero using 100 kb bins from healthy cfDNA (top) and nuclease-digested healthy lymphocytes (middle) are depicted together with the first eigenvector for the genome contact matrix from Hi-C analyses of lymphoblastoid cells27 (bottom).
In contrast to healthy cfDNA, patients with cancer had multiple distinct genomic differences with increases and decreases in fragment sizes at different regions (Fig. 2a, b). We performed genome-wide correlation analyses of the fraction of short to long cfDNA fragments for each sample compared to the median fragment length profile of healthy individuals and found that, while cfDNA fragment profiles were consistent among healthy individuals (median correlation of 0.99), the median correlation of fragment ratios among cancer patients was 0.84 (95% CI 0.07–0.50, p<0.001, Wilcoxon rank sum test, Fig. 2a, b, Extended Data Fig. 3d, Supplementary Table 5). Similar differences were observed comparing cfDNA fragmentation profiles of cancer patients to fragmentation profiles of healthy lymphocytes (Fig. 2c, Extended Data Fig. 3b, c). To account for potential biases attributable to GC content, we applied a locally weighted smoother and found that differences in fragmentation profiles between healthy individuals and cancer patients remained after this adjustment (median correlation of cancer patients to healthy = 0.83, Supplementary Table 5).
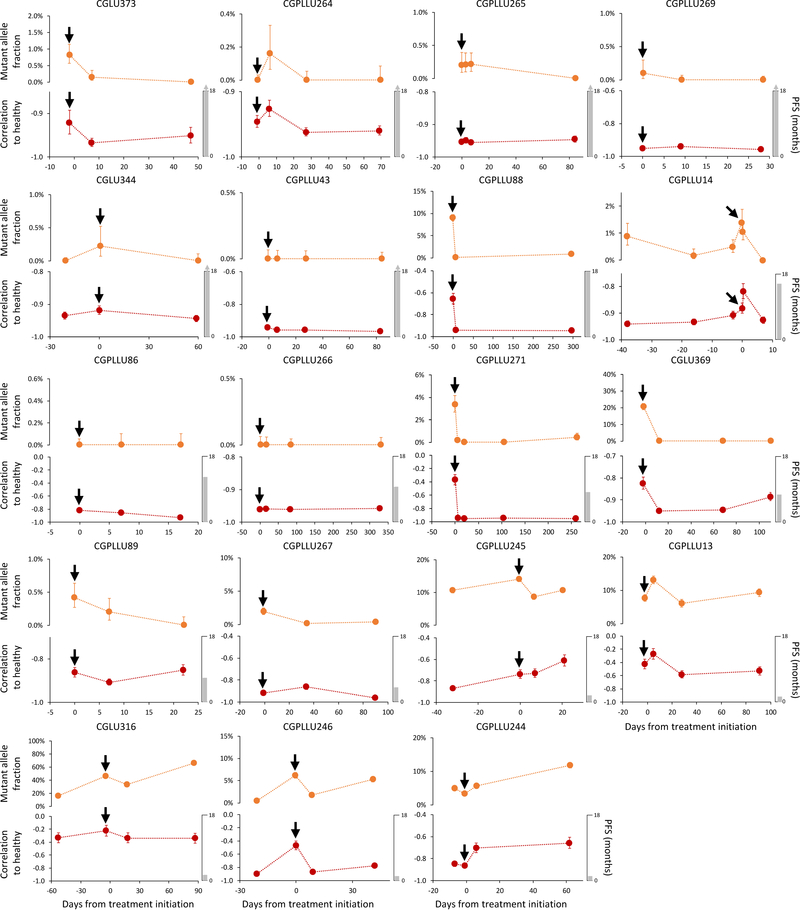
We subsampled WGS data at 9x coverage to ~2x, ~1x, ~0.5x, ~0.2x, and ~0.1x genome coverage, and determined that altered fragmentation profiles from cancer patients were identified even at 0.5x coverage (Extended Data Fig. 3e, f). Based on these observations, we performed WGS at 1–2x coverage to evaluate whether fragmentation profiles may change during the course of therapy28,29. We evaluated cfDNA from 19 non-small cell lung cancer patients during anti-EGFR or anti-ERBB2 therapy (Supplementary Table 6). The degree of abnormality in the fragmentation profiles during therapy closely matched levels of EGFR or ERBB2 mutant allele fractions (Extended Data Fig. 4, Spearman correlation of mutant allele fractions to fragmentation profiles = 0.74)29. These results demonstrate that fragmentation analyses may be useful for detecting tumor-derived cfDNA and monitoring patients during treatment.
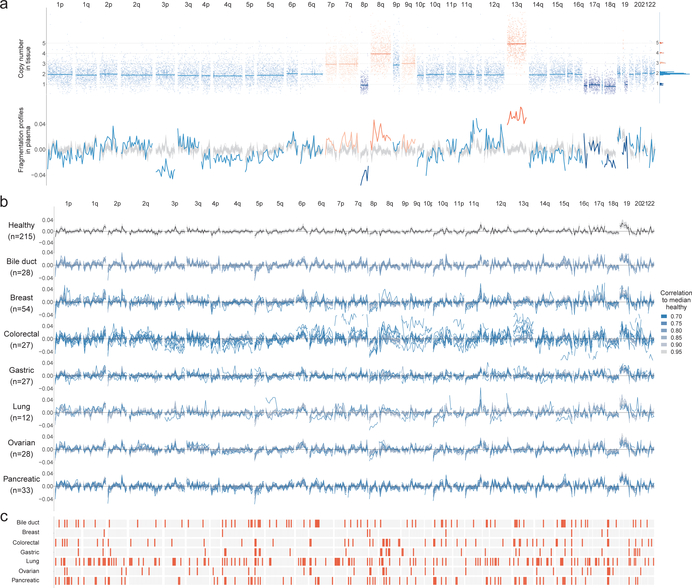
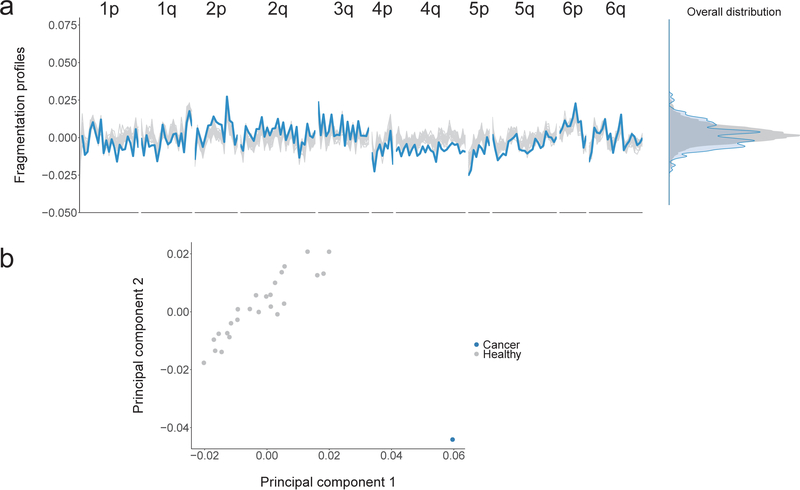
As cfDNA fragmentation profiles would be expected to reflect both epigenomic and genomic alterations, we examined these in a patient with known tumor copy number changes. Altered fragmentation profiles were present in regions of the genome that were copy-neutral and were further affected in regions with copy number changes (Fig. 3a, Extended Data Fig. 5a). Position-dependent differences in fragmentation patterns distinguished cancer-derived cfDNA from healthy cfDNA, while overall cfDNA fragment size analyses would have missed such differences (Extended Data Fig. 5a, b).
Fig. 3. cfDNA fragmentation profiles in healthy individuals and patients with cancer.
a, Fragmentation profiles (bottom) in the context of tumor copy number changes (top) in a colorectal cancer patient. The distribution of segment means and integer copy numbers are shown at top right. b, GC adjusted fragmentation profiles from 1–2x WGS for healthy individuals and patients with cancer are depicted per cancer type using 5 Mb windows. The median healthy profile is indicated in black and the 98% confidence band is shown in gray. For patients with cancer, individual profiles are colored based on their Pearson correlation to the healthy median. c, Windows are indicated in orange if more than 10% of the cancer samples had a fragment ratio more than three standard deviations from the median healthy fragment ratio.
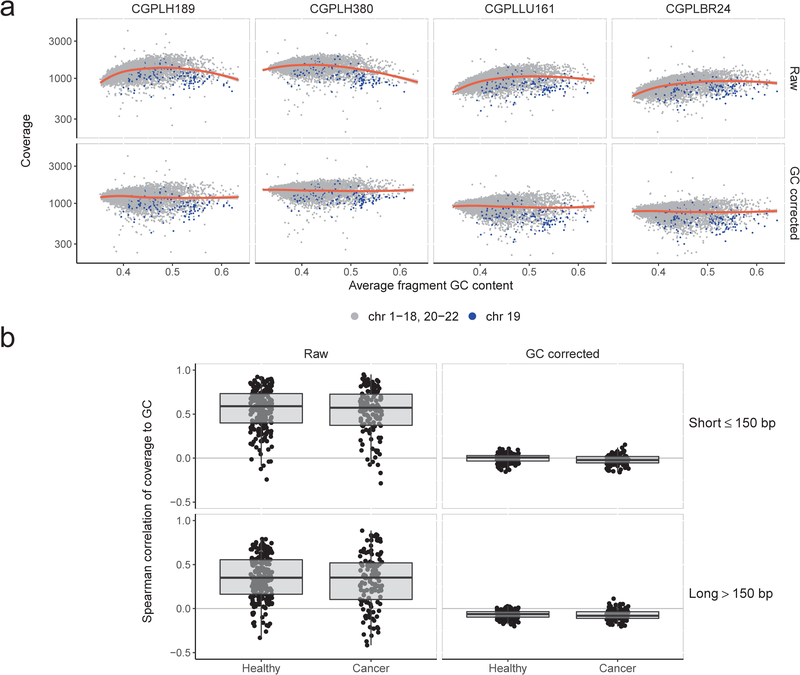
We performed WGS at 1–2x coverage of cfDNA from 208 patients with cancer, including breast (n=54), colorectal (n=27), lung (n=12), ovarian (n=28), pancreatic (n=34), gastric (n=27), or bile duct cancer (n=26), as well as 215 healthy individuals (Supplementary Tables 1, 4). All cancer patients were treatment naïve and the majority had resectable disease (n=183). After GC adjustment of short and long cfDNA fragment coverage (Extended Data Fig. 6a, b), we examined coverage and size characteristics of fragments in windows throughout the genome (Fig. 3b, Supplementary Tables 4, 7). Healthy individuals had concordant fragmentation profiles while patients with cancer had variability with decreased correlation to the median healthy profile (Supplementary Table 7). An analysis of commonly altered genomic windows revealed a median of 60 affected windows across the cancer types analyzed, highlighting position-dependent alterations in fragmentation of cfDNA (Fig. 3c).
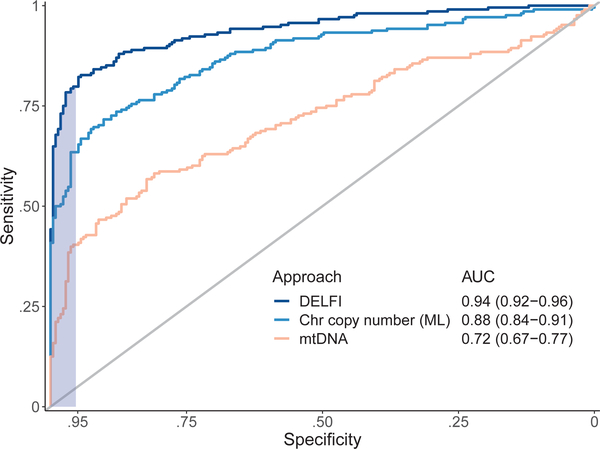
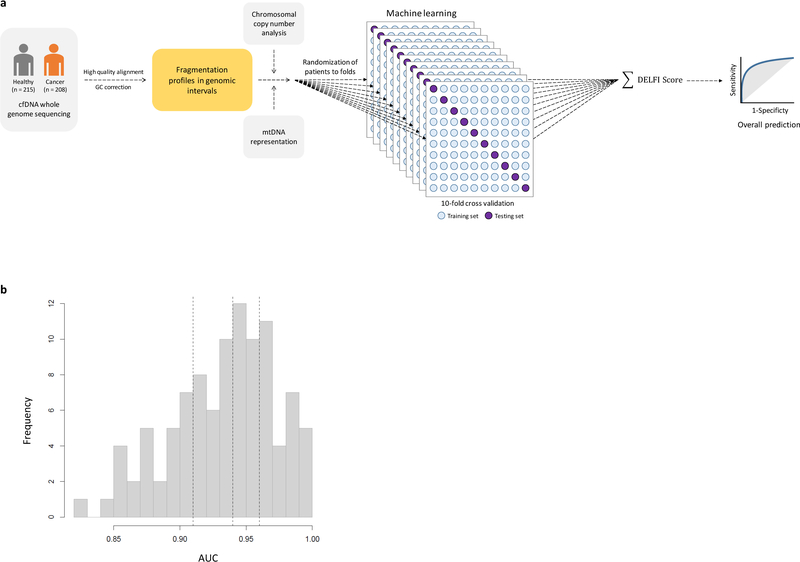
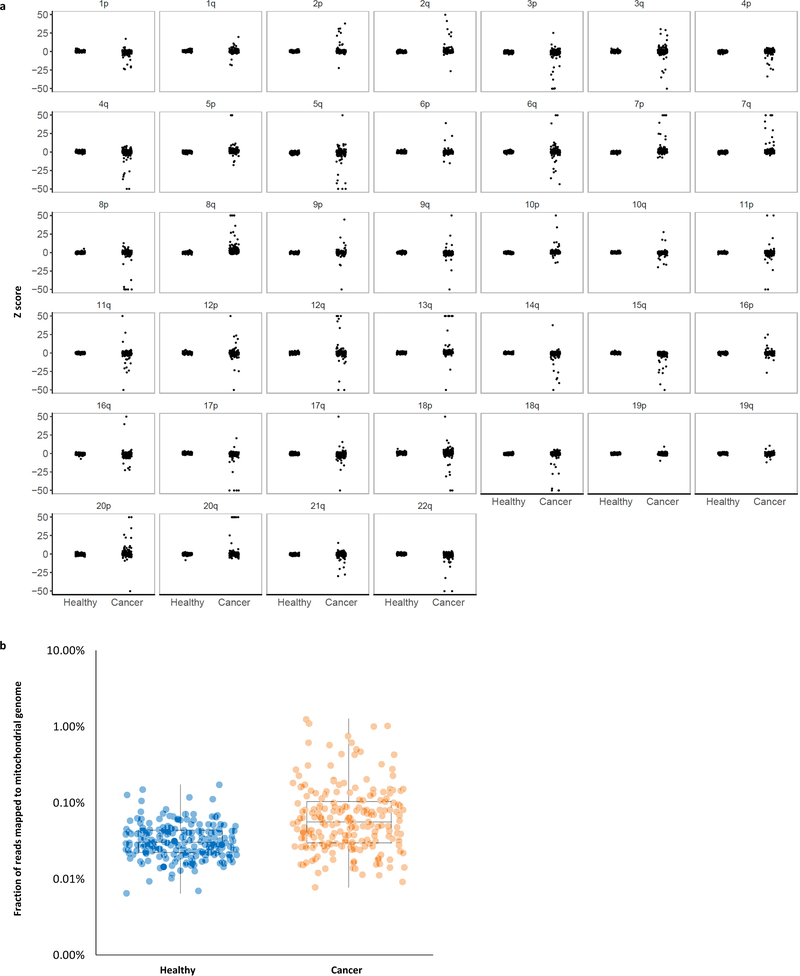
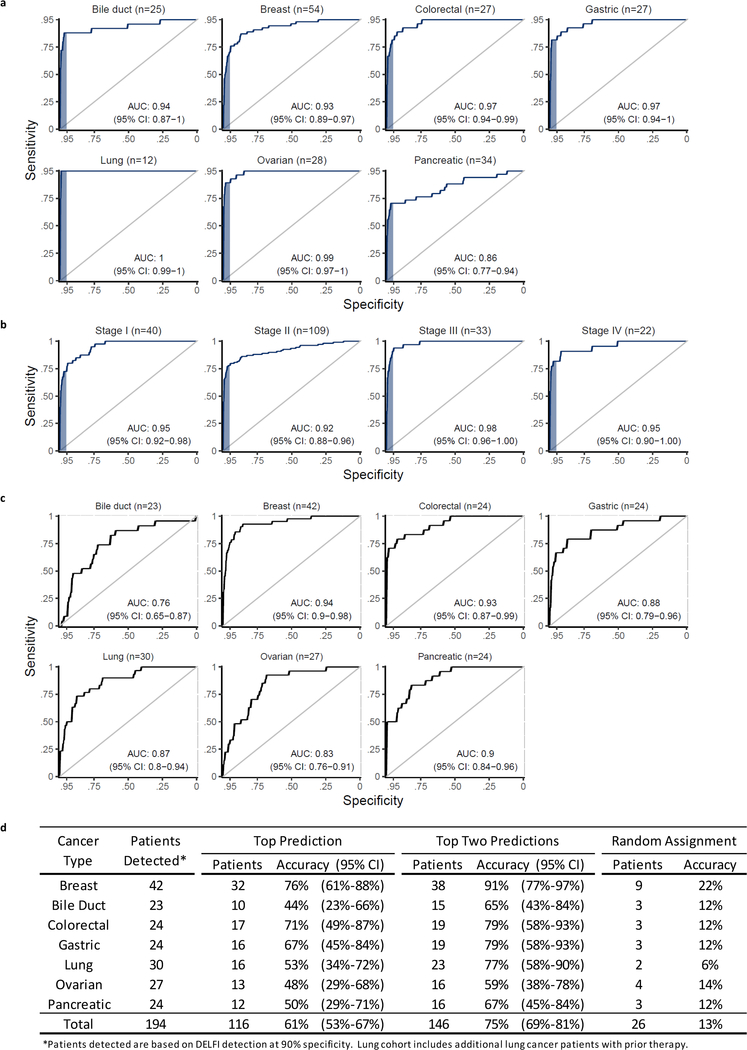
We implemented a gradient tree boosting machine learning model to examine whether cfDNA has characteristics of a cancer patient or healthy individual and estimated performance characteristics of this approach by ten-fold cross-validation repeated ten times (Extended Data Fig. 7a, b). The machine learning model included GC-adjusted short and long fragment coverage characteristics in windows throughout the genome. We also developed a machine learning classifier for copy number changes from chromosomal arm features 10,11 (Extended Data Fig. 8a, Supplementary Table 8) and included mitochondrial copy number changes12 (Extended Data Fig. 8b). Using this implementation of DELFI, we obtained a score that could be used to classify patients as healthy or having cancer. We detected 152 of 208 cancer patients (73% sensitivity, 95% CI 67%−79%) while misclassifying four of 215 healthy individuals (98% specificity) (Table 1). At a threshold of 95% specificity, we detected 80% of patients with cancer (95% CI, 74%−85%), including 79% of resectable (stage I – III) patients (145 of 183) and 82% of stage IV patients (18 of 22) (Table 1). Receiver operator characteristic analyses for detection of cancer patients had an AUC of 0.94 (95% CI 0.92 – 0.96), ranging from 0.86 for pancreatic cancer to ≥0.93 for breast, bile duct, colorectal, gastric, lung and ovarian cancers (Fig. 4, Extended Data Fig. 9a), with AUCs ≥0.92 for each stage (Extended Data Fig. 9b). To assess the contribution of fragment size and coverage across the genome, chromosome arm copy number, or mitochondrial copy number to the predictive accuracy of the model, we implemented the cross-validation procedure to assess performance characteristics of these features in isolation. Fragment coverage features alone (AUC = 0.94) were nearly identical to the classifier that combined all features (AUC = 0.94). In contrast, machine learning analyses of chromosomal copy number changes had lower performance (AUC = 0.88) but were still more predictive than copy number using individual scores (AUC=0.78) or mitochondrial copy number (AUC = 0.72) (Fig. 4). These results suggest that fragment coverage is the major contributor to our classifier, but we have included all features in our prediction model as they can be obtained from the same WGS data and may contribute in a complementary fashion for cancer detection.
Table 1.
DELFI performance for cancer detection
| Individuals analyzed | 95% specificity |
98% specificity |
||||||
|---|---|---|---|---|---|---|---|---|
| Individuals detected | Sensitivity | 95% CI | Individuals detected | Sensitivity | 95% CI | |||
| Healthy | 215 | 10 | - | - | 4 | - | - | |
| Cancer | 208 | 166 | 80% | 74%–85% | 152 | 73% | 67%–79% | |
| Type | Breast | 54 | 38 | 70% | 56%–82% | 31 | 57% | 43%–71% |
| Bile duct | 26 | 23 | 88% | 70%–98% | 21 | 81% | 61%–93% | |
| Colorectal | 27 | 22 | 81% | 62%–94% | 19 | 70% | 50%–86% | |
| Gastric | 27 | 22 | 81% | 62%–94% | 22 | 81% | 62%–94% | |
| Lung | 12 | 12 | 100% | 74%–100% | 12 | 100% | 74%–100% | |
| Ovarian | 28 | 25 | 89% | 72%–98% | 25 | 89% | 72%–98% | |
| Pancreatic | 34 | 24 | 71% | 53%–85% | 22 | 65% | 46%–80% | |
| Stage | I | 41 | 30 | 73% | 53%–86% | 28 | 68% | 52%–82% |
| II | 109 | 85 | 78% | 69%–85% | 78 | 72% | 62%–80% | |
| III | 33 | 30 | 91% | 76%–98% | 26 | 79% | 61%–91% | |
| IV | 22 | 18 | 82% | 60%–95% | 17 | 77% | 55%–92% | |
| X | 3 | 3 | 100% | 29%–100% | 3 | 100% | 29%–100% | |
Fig. 4. Detection of cancer using DELFI.
Receiver operator characteristics for detection of cancer using cfDNA fragmentation profiles and other genome-wide features in a machine learning approach are depicted for a cohort of 215 healthy individuals and 208 patients with cancer (DELFI, AUC = 0.94), with ≥ 95% specificity shaded in blue. Machine learning analyses of chromosomal arm copy number (Chr copy number (ML)), and mitochondrial genome copy number analyses (mtDNA), are shown in the indicated colors.
As fragmentation profiles reveal regional differences between tissues, we used machine learning to identify the tissue of origin of ctDNA. These analyses had a 61% accuracy (95% CI 53%−67%) that increased to 75% (95% CI 69%−81%) when assigning ctDNA to one of two sites of origin (Table 2, Extended Data Fig. 9c, d). For all tumor types the tissue of origin classification by DELFI was higher than random assignment (p<0.01, binomial test, Extended Data Fig. 9d).
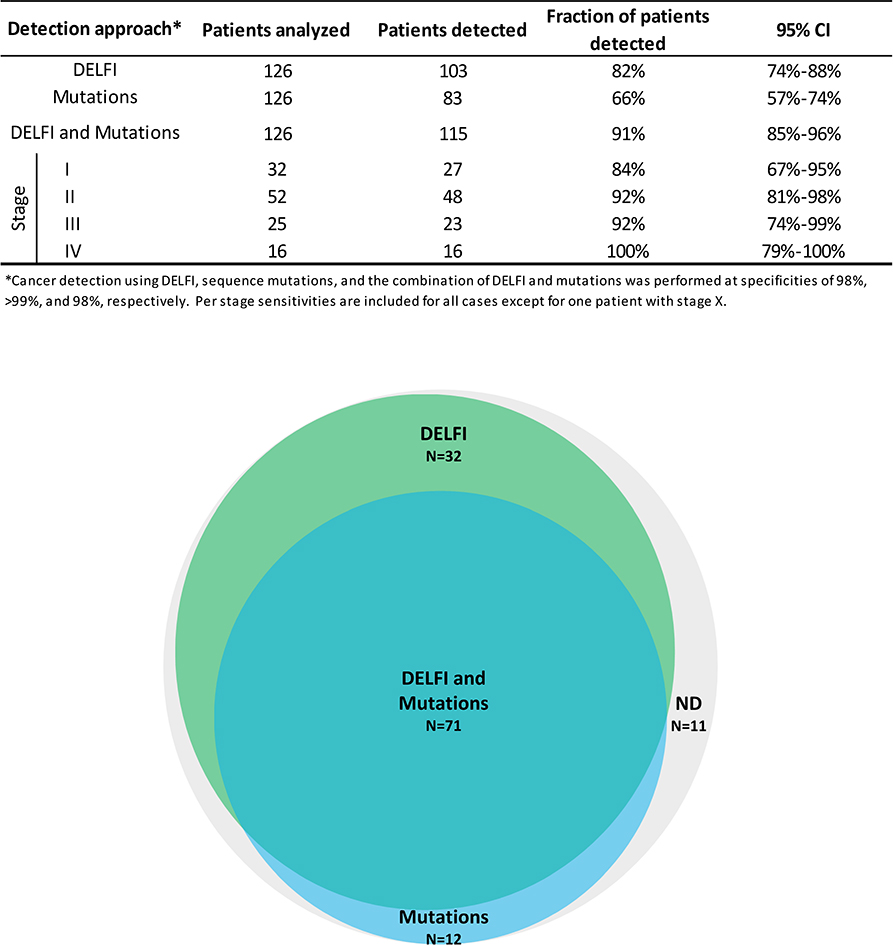
We evaluated whether combining DELFI with mutation detection in cfDNA5 could increase the sensitivity of cancer detection (Extended Data Fig. 10). An evaluation of cases analyzed using both approaches revealed that 82% (103 of 126) of patients were detected using DELFI while 66% (83 of 126) had sequence alterations. For cases with mutant allele fractions <1% DELFI detected 80% of cases, including those that were undetectable using targeted sequencing (Supplementary Table 7). When these approaches were used together the combined sensitivity increased to 91% (115 of 126 patients) with a specificity of 98% (Extended Data Fig. 10).
Overall, we have determined that genome-wide cfDNA fragmentation profiles are different between cancer patients and healthy individuals. In cancer patients, fragmentation patterns in cfDNA appear to result from mixtures of nucleosomal DNA from both blood and neoplastic cells. Our approach could be further improved through recovery of smaller fragments17,30, evaluation of single-stranded libraries18,30,31, or use of alternative technologies. Additionally, PCR-free libraries could reduce GC bias and sequencing artifacts18,30,31.
These observations have important implications for noninvasive detection of human cancer. DELFI simultaneously analyzes tens to hundreds of tumor-specific abnormalities from minute cfDNA amounts, overcoming a limitation that has precluded the possibility of more sensitive analyses of cfDNA. These analyses detected a higher fraction of cancer patients than previous methods5–7,12,17, and combining DELFI with detection of cfDNA sequence alterations further increased the sensitivity of detection. As fragmentation profiles appear related to nucleosomal patterns, DELFI may be useful for determining the source of tumor-derived cfDNA, an aspect that could be further improved using clinical characteristics, methylation changes23, and additional diagnostic approaches6. DELFI requires only a small amount of whole genome sequencing, suggesting that this approach could be broadly applied for screening and management of patients with cancer.
Methods
Patient and sample characteristics
Plasma samples from healthy individuals and plasma and tissue samples from patients with breast, lung, ovarian, colorectal, bile duct, or gastric cancer were obtained from ILSBio/Bioreclamation, Aarhus University, Herlev Hospital of the University of Copenhagen, Hvidovre Hospital, the University Medical Center of the University of Utrecht, the Academic Medical Center of the University of Amsterdam, the Netherlands Cancer Institute, and the University of California, San Diego. All samples were obtained under Institutional Review Board approved protocols with informed consent from all participants for research use at participating institutions. Plasma samples from healthy individuals were obtained at the time of routine screening, including for colonoscopies or Pap smears. Individuals were considered healthy if they had no previous history of cancer and negative screening results.
Plasma samples from individuals with breast, colorectal, gastric, lung, ovarian, pancreatic and bile duct cancer were obtained at the time of diagnosis, prior to tumor resection or therapy. Nineteen lung cancer patients analyzed for change in cfDNA fragmentation profiles across multiple time points were undergoing treatment with anti-EGFR or anti-ERBB2 therapy 29. Clinical data for all patients included in this study are listed in table S1. Sex was confirmed through genomic analyses of X and Y chromosome representation. Pathologic staging of gastric cancer patients was performed after neoadjuvant therapy. Samples where the tumor stage was unknown were indicated as stage X or unknown.
Nucleosomal DNA purification
Viably frozen lymphocytes were elutriated from leukocytes obtained from a healthy male (C0618) and female (D0808-L) (Advanced Biotechnologies Inc., Eldersburg, MD). Aliquots of 1 × 10⁶ cells were used for nucleosomal DNA purification using EZ Nucleosomal DNA Prep Kit (Zymo Research, Irvine, CA). Cells were initially treated with 100μl of Nuclei Prep Buffer and incubated on ice for 5 minutes. After centrifugation at 200g for 5 minutes, supernatant was discarded and pelleted nuclei were treated twice with 100μl of Atlantis Digestion Buffer or with 100μl of micrococcal nuclease (MN) Digestion Buffer. Finally, cellular nucleic DNA was fragmented with 0.5U of Atlantis dsDNase at 42oC for 20 minutes or 1.5U of MNase at 37oC for 20 minutes. Reactions were stopped using 5X MN Stop Buffer and DNA was purified using Zymo-Spin™ IIC Columns. Concentration and quality of eluted cellular nucleic DNA were analyzed using the Bioanalyzer 2100 (Agilent Technologies, Santa Clara, CA).
Sample preparation and sequencing of cfDNA
Whole blood was collected in EDTA tubes and processed immediately or within one day after storage at 4°C, or was collected in Streck tubes and processed within two days of collection for three cancer patients who were part of the monitoring analysis. Plasma and cellular components were separated by centrifugation at 800g for 10 min at 4°C. Plasma was centrifuged a second time at 18,000g at room temperature to remove any remaining cellular debris and stored at −80°C until the time of DNA extraction. DNA was isolated from plasma using the Qiagen Circulating Nucleic Acids Kit (Qiagen GmbH) and eluted in LoBind tubes (Eppendorf AG). Concentration and quality of cfDNA were assessed using the Bioanalyzer 2100 (Agilent Technologies).
NGS cfDNA libraries were prepared for whole genome sequencing and targeted sequencing using 5 to 250 ng of cfDNA as previously described5. Briefly, genomic libraries were prepared using the NEBNext DNA Library Prep Kit for Illumina [New England Biolabs (NEB)] with four main modifications to the manufacturer’s guidelines: (i) The library purification steps used the on-bead AMPure XP approach to minimize sample loss during elution and tube transfer steps32; (ii) NEBNext End Repair, A-tailing, and adapter ligation enzyme and buffer volumes were adjusted as appropriate to accommodate the on-bead AMPure XP purification strategy; (iii) a pool of eight unique Illumina dual index adapters with 8–base pair (bp) barcodes was used in the ligation reaction; and (iv) cfDNA libraries were amplified with Phusion Hot Start Polymerase. Whole genome libraries were sequenced using 100-bp paired-end runs on the Illumina HiSeq 2000/2500 (Illumina).
Analyses of targeted sequencing data from cfDNA
Analyses of targeted NGS data for cfDNA samples was performed as previously described5. Briefly, primary processing was completed using Illumina CASAVA (Consensus Assessment of Sequence and Variation) software (version 1.8), including demultiplexing and masking of dual-index adapter sequences. Sequence reads were aligned against the human reference genome (version hg18 or hg19) using NovoAlign with additional realignment of select regions using the Needleman-Wunsch method 33. The positions of sequence alterations we identified have not been affected by the different genome builds. Candidate mutations, consisting of point mutations, small insertions, and deletions, were identified using VariantDx33 (Personal Genome Diagnostics, Baltimore, MD) across the targeted regions of interest.
To analyze the fragment lengths of cfDNA molecules, we required that each read pair from a cfDNA molecule has a Phred quality score ≥ 30. We removed all duplicate ctDNA fragments, defined as having the same start, end, and index barcode. For each mutation, we only included fragments for which one or both of the read pairs contained the mutated (or wild-type) base at the given position. This analysis was done using the R packages Rsamtools and GenomicAlignments.
For each genomic locus where a somatic mutation was identified, we compared the lengths of fragments containing the mutant allele to the lengths of fragments with the wild-type allele. If more than 100 mutant fragments were identified, we used Welch’s two-sample t-test to compare the mean fragment lengths. For loci with fewer than 100 mutant fragments, we implemented a bootstrap procedure. Specifically, we sampled with replacement N fragments containing the wild-type allele, where N denotes the number of fragments with the mutation. For each bootstrap replicate of wild type fragments we computed their median length. The p-value was estimated as the fraction of bootstrap replicates with a median wild-type fragment length as or more extreme than the observed median mutant fragment length.
Analyses of whole genome sequencing data from cfDNA
Primary processing of whole genome NGS data for cfDNA samples was performed using Illumina CASAVA (Consensus Assessment of Sequence and Variation) software (version 1.8.2), including demultiplexing and masking of dual-index adapter sequences. Sequence reads were aligned against the human reference genome (version hg19) using ELAND.
Read pairs with a MAPQ score below 30 for either read and PCR duplicates were removed. We tiled the hg19 autosomes into 26,236 adjacent, non-overlapping 100 kb bins. We excluded regions of low mappability based on previous work27 where 10% of bins with the lowest coverage were removed, and excluded reads falling in the Duke blacklisted regions (http://hgdownload.cse.ucsc.edu/goldenpath/hg19/encodeDCC/wgEncodeMapability/). Using this approach, we excluded 361 Mb (13%) of the hg19 reference genome, including centromeric and telomeric regions. Short fragments were defined as having lengths between 100 and 150 bp and long fragments as having lengths between 151 and 220 bp.
To account for biases in coverage attributable to GC content of the genome, we applied the locally weighted smoother loess with span ¾ to the scatterplot of average fragment GC versus coverage calculated for each 100kb bin. This loess regression was performed separately for short and long fragments to account for possible differences in GC effects on coverage in plasma by fragment length, an approach loosely motivated by Benjamini et al.34 We subtracted the predictions for short and long coverage explained by GC from the loess model, obtaining residuals for short and long that were uncorrelated with GC. We returned the residuals to the original scale by adding back the genome-wide median short and long estimates of coverage. This procedure was repeated for each sample to account for possible differences in GC effects on coverage between samples. To further reduce the feature space and noise, we calculated the total GC-adjusted coverage in 5 Mb bins.
To compare the variability of fragment lengths from healthy subjects to fragments in patients with cancer, we calculated the standard deviation of the short to long fragmentation profiles for each individual. We compared the standard deviations in the two groups by a Wilcoxon rank sum test.
Analyses of chromosome arm copy number changes
To develop arm-level statistics for copy number changes, we adopted a previously described approach for aneuploidy detection in plasma10. This approach divides the genome into non-overlapping 50KB bins for which GC-corrected log2 read depth was obtained after correction by loess with span 3/4. This loess-based correction is comparable to the approach outlined above, but is evaluated on a log2 scale to increase robustness to outliers in the smaller bins and does not stratify by fragment length. To obtain an arm-specific Z-score for copy number changes, the mean GC-adjusted read depth for each arm (GR) was centered and scaled by the average and standard deviation, respectively, of GR scores obtained from an independent set of 50 healthy samples.
Analyses of mitochondrial-aligned reads from cfDNA
Whole genome sequence reads that initially mapped to the mitochondrial genome were extracted from bam files and realigned to the hg19 reference genome in end-to-end mode with Bowtie2 as previously described35. The resulting aligned reads were filtered such that both mates aligned to the mitochondrial genome with MAPQ >= 30. The number of fragments mapping to the mitochondrial genome was counted and converted to a percentage of the total number of fragments in the original bam files.
Prediction model for cancer detection
To distinguish healthy from cancer patients using fragmentation profiles, we used a stochastic gradient boosting model (gbm)36,37. GC-corrected total and short fragment coverage for all 504 bins were centered and scaled for each sample to have mean 0 and unit standard deviation. Additional features included Z-scores for each of the 39 autosomal arms and mitochondrial representation (log10-transformed proportion of reads mapped to the mitochondria). To estimate the prediction error of this approach, we used 10-fold cross-validation.38 Feature selection, performed only on the training data in each cross-validation run, removed bins that were highly correlated (correlation > 0.9) or had near zero variance. Stochastic gradient boosted machine learning was implemented using the R package gbm package with parameters n.trees=150, interaction.depth=3, shrinkage=0.1, and n.minobsinside=10. To average over the prediction error from the randomization of patients to folds, we repeated the 10-fold cross-validation procedure 10 times. Confidence intervals for sensitivity fixed at 98% and 95% specificity were obtained from 2000 bootstrap replicates.
Prediction model for tumor tissue of origin classification
For samples correctly identified from patients with cancer at 90% specificity (n = 174), a separate stochastic gradient boosting model was trained to classify the tissue of origin. To account for the small number of lung samples used for prediction, we included 18 cfDNA baseline samples from late stage lung cancer patients from the monitoring analyses of our study. Performance characteristics of the model were evaluated using 10-fold cross-validation repeated 10 times. This gbm model was trained using the same features as in the cancer classification model. Features that displayed correlation above 0.9 to each other or had near zero variance were removed within each training dataset during cross-validation. The tissue class probabilities were averaged across the 10 replicates for each patient and the class with the highest probability was used as the predicted tissue.
Analyses of nucleosomal DNA from human lymphocytes and cfDNA
From the nuclease treated lymphocytes, fragment sizes were analyzed in 5 Mb bins as described for whole genome cfDNA analyses. A genome-wide map of nucleosome positions was constructed from the nuclease treated lymphocyte cell lines. This approach identified local biases in the coverage of circulating fragments, indicating a region protected from degradation. A “Window positioning score” (WPS) was used to score each base pair in the genome18. Using a sliding window of 60bp centered around each base, the WPS was calculated as the number of fragments completely spanning the window minus the number of fragments with only one end in the window. Since fragments arising from nucleosomes have a median length of 167 bp, a high WPS indicated a possible nucleosomic position. WPS scores were centered at zero using a running median and smoothed using a Kolmogorov-Zurbenko filter39. For spans of positive WPS between 50 and 450 bp, a nucleosome peak was defined as the set of base pairs with a WPS above the median in that window. The calculation of nucleosome positions for cfDNA from 30 healthy individuals with sequence coverage of 9x was determined in the same manner as for lymphocyte DNA. To ensure that nucleosomes in healthy cfDNA were representative, we defined a consensus track of nucleosomes consisting only of nucleosomes identified in two or more individuals. Median distances between adjacent nucleosomes were calculated from the consensus track.
Monte Carlo simulation of detection sensitivity
We used Monte Carlo simulation to estimate the probability of detecting a molecule with a tumor-derived alteration. Briefly, we generated 1 million molecules from a multinomial distribution. For a simulation with m alterations, wild-type molecules were simulated with probability p and each of the m tumor alterations were simulated with probability (1-p)/m. Next, we sampled g * m molecules randomly with replacement, where g denotes the number of genome equivalents in 1 ml of plasma. If a tumor alteration was sampled s or more times, we classified the sample as cancer-derived. We repeated the simulation 1000 times, estimating the probability that the in silico sample would be correctly classified as cancer by the mean of the cancer indicator. Setting g = 2000 and s = 5, we varied the number of tumor alterations by powers of 2 from 1 to 256 and the fraction of tumor-derived molecules from 0.0001% to 1%.
Statistical analyses
All statistical analyses were performed using R version 3.4.3. The R packages caret (version 6.0–79) and gbm (version 2.1–4) were used to implement the classification of healthy versus cancer and tissue of origin. Confidence intervals from the model output were obtained with the pROC (version 1.13) R package40. Assuming the prevalence of undiagnosed cancer cases in this population is high (1 or 2 cases per 100 healthy), a genomic assay with a specificity of 0.95 and sensitivity of 0.8 would have useful operating characteristics (positive predictive value of 0.25 and negative predictive value near 1). Power calculations suggest that an analysis of more than 200 cancer patients and an approximately equal number of healthy controls, enable an estimation of the sensitivity with a margin of error of 0.06 at the desired specificity of 0.95 or greater.
Data and Code Availability
Sequence data utilized in this study have been deposited at the database of Genotypes and Phenotypes (dbGaP, study ID 34536). Code for analyses is available at http://github.com/Cancer-Genomics/delfi_scripts.
Extended Data
Extended Data Fig. 1. Simulations of noninvasive cancer detection based on number of alterations analyzed and tumor-derived cfDNA fragment distributions.
a, Monte Carlo simulations were performed using different numbers of tumor-specific alterations to evaluate the probability of detecting cancer alterations in cfDNA at the indicated fraction of tumor-derived molecules. The simulations were performed assuming an average of 2000 genome equivalents of cfDNA and the requirement of five or more observations of any alteration. These analyses indicate that increasing the number of tumor-specific alterations improves the sensitivity of detection of circulating tumor DNA. b, Cumulative density functions of cfDNA fragment lengths of 42 loci containing tumor-specific alterations from 30 patients with breast, colorectal, lung, or ovarian cancer are shown with 95% confidence bands (orange). Lengths of mutant cfDNA fragments were significantly different in size compared to wild-type cfDNA fragments (blue) at these loci. c, GC content was similar for mutated and non-mutated fragments. d, GC content was not correlated to fragment length.
Extended Data Fig. 2. Germline and hematopoietic cfDNA fragment distributions.
a, Cumulative density functions of fragment lengths at 44 loci containing germline alterations (non-tumor derived) from 38 patients with breast, colorectal, lung, or ovarian cancer are shown with 95% confidence bands. Fragments with germline mutations (orange) were comparable in length to wild-type cfDNA fragment lengths (blue). b, Cumulative density functions of fragment lengths at 41 loci containing hematopoietic alterations (non-tumor derived) from 28 patients with breast, colorectal, lung, or ovarian cancer are shown with 95% confidence bands. After correction for multiple testing, there were no significant differences (α=0.05) in the size distributions of mutated hematopoietic cfDNA fragments (orange) and wild-type cfDNA fragments (blue).
Extended Data Fig. 3. cfDNA fragmentation in healthy individuals and patients with lung cancer.
a, cfDNA fragments lengths are shown for healthy individuals (n=30, gray) and patients with lung cancer (n=8, blue). b-d, cfDNA fragmentation profiles from healthy individuals (n=30) had high correlations while patients with lung cancer (n=8) had lower correlations to median fragmentation profiles of b, lymphocytes, c, lymphocyte nucleosome distances, and, d, healthy cfDNA. Pearson correlations are shown with box plots depicting minimum, 25th percentile, median, 75th percentile, and maximum values. e, High coverage (9x) whole-genome sequencing data were subsampled to 2x, 1x, 0.5x, 0.2x, and 0.1x fold coverage. Mean centered genome-wide fragmentation profiles in 5 Mb bins for 30 healthy individuals and 8 patients with lung cancer are depicted for each subsampled fold coverage with median profiles shown in blue. f, Pearson Correlation of subsampled profiles to initial profile at 9x coverage for healthy individuals and patients with lung cancer.
Extended Data Fig. 4. cfDNA fragmentation profiles and sequence alterations during therapy.
Detection and monitoring of cancer in serial blood draws from NSCLC patients (n=19) undergoing treatment with targeted tyrosine kinase inhibitors (black arrows) was performed using targeted sequencing (top) as previously reported29 and genome-wide fragmentation profiles (bottom). For each case, the vertical axis of the lower panel displays −1 times the Pearson correlation of each sample to the median healthy cfDNA fragmentation profile. Error bars depict confidence intervals from binomial tests for mutant allele fractions and confidence intervals calculated using Fisher transformation for genome-wide fragmentation profiles. Although the approaches analyze different aspects of cfDNA (whole genome compared to specific alterations) the targeted sequencing and fragmentation profiles were similar for patients responding to therapy as well as those with stable or progressive disease. As fragmentation profiles reflect both genomic and epigenomic alterations, while mutant allele fractions only reflect individual mutations, mutant allele fractions alone may not reflect the absolute level of correlation of fragmentation profiles to healthy individuals.
Extended Data Fig. 5. Profiles of cfDNA fragment lengths in copy neutral regions in healthy individuals and one patient with colorectal cancer.
a, The fragmentation profile in 211 copy neutral windows in chromosomes 1–6 for 25 randomly selected healthy individuals (gray). For a patient with colorectal cancer (CGCRC291) with an estimated mutant allele fraction of 20%, we diluted the cancer fragment length profile to an approximate 10% tumor contribution (blue). a, b While the marginal densities of the fragment profiles for the healthy samples and cancer patient show substantial overlap (a, right), the fragmentation profiles are different as can be seen visualization of the fragmentation profiles (a, left) and by the separation of the colorectal cancer patient from the healthy samples (n=25) in a principal component analysis (b).
Extended Data Fig. 6. Genome-wide GC correction of cfDNA fragments.
To estimate and control for the effects of GC content on sequencing coverage, we calculated coverage in non-overlapping 100kb genomic windows across the autosomes. For each window, we calculated the average GC of the aligned fragments. a, Loess smoothing of raw coverage (top row) for two randomly selected healthy subjects (CGPLH189 and CGPLH380) and two cancer patients (CGPLLU161 and CGPLBR24) with undetectable aneuploidy (PA score < 2.35). After subtracting the average coverage predicted by the loess model, the residuals were rescaled to the median autosomal coverage (bottom row). As fragment length may also result in coverage biases, we performed this GC correction procedure separately for short (≤ 150 bp) and long (> 150 bp) fragments. While the 100 kb bins on chromosome 19 (blue points) consistently have less coverage than predicted by the loess model, we did not implement a chromosome-specific correction as such an approach would remove the effects of chromosomal copy number on coverage. b, Overall, we found a limited correlation between short or long fragment coverage and GC content after correction among healthy subjects (n=211, inter-quartile range: −0.03–0.03) and cancer patients (n=128, inter-quartile range: −0.06–0.02) with a PA score <3. Box plots depict minimum, 25th percentile, median, 75th percentile, and maximum values.
Extended Data Fig. 7. Machine learning model.
a, We used gradient tree boosting machine learning to examine whether cfDNA can be categorized as having characteristics of a cancer patient or healthy individual. The machine learning model included fragmentation size and coverage characteristics in windows throughout the genome, as well as chromosomal arm and mitochondrial DNA copy numbers. We employed a 10-fold cross-validation approach in which each sample is randomly assigned to a fold and 9 of the folds (90% of the data) are used for training and one fold (10% of the data) is used for testing. The prediction accuracy from a single cross-validation is an average over the 10 possible combinations of test and training sets. As this prediction accuracy can reflect bias from the initial randomization of patients, we repeat the entire procedure, including the randomization of patients to folds, 10 times. For all cases, feature selection and model estimation were performed on training data and were validated on test data and the test data were never used for feature selection. Ultimately, we obtained a DELFI score that could be used to classify individuals as likely healthy or having cancer. b, Distribution of AUCs across the repeated 10-fold cross-validation. The 25th, 50th, and 75th percentiles of the 100 AUCs for the cohort of 215 healthy individuals and 208 patients with cancer are indicated by dashed lines.
Extended Data Fig. 8. Whole-genome analyses of chromosomal arm copy number changes and mitochondrial genome representation.
a, Z scores for each autosome arm are depicted for healthy individuals (n=215) and patients with cancer (n=208). The vertical axis depicts normal copy at zero with positive and negative values indicating arm gains and losses, respectively. Z scores greater than 50 or less than −50 are thresholded at the indicated values. b, The fraction of reads mapping to the mitochondrial genome is depicted for healthy individuals (n=215) and patients with cancer (n=208). Box plots depict the minimum, 25th percentile, median, 75th percentile, and maximum values.
Extended Data Fig. 9. DELFI detection of cancer and tissue of origin prediction.
a, Analyses of individual cancer types using the DELFI-combined approach had AUCs ranging from 0.86 to >0.99. b, Receiver operator characteristics for detection of cancer using cfDNA fragmentation profiles and other genome-wide features in a machine learning approach are depicted for a cohort of 215 healthy individuals and each stage of 208 patients with cancer with ≥ 95% specificity shaded in blue. c, Receiver operator characteristics for DELFI tissue prediction of bile duct, breast, colorectal, gastric, lung, ovarian, or pancreatic cancer are depicted. In order to increase sample sizes within cancer type classes, we included cases detected with a 90% specificity, and the lung cancer cohort was supplemented with the addition of baseline cfDNA data from 18 lung cancer patients with prior treatment36. d, DELFI tissue of origin prediction.
Extended Data Fig. 10. Detection of cancer using DELFI and mutation-based cfDNA approaches.
DELFI (green) and targeted sequencing10 for mutation identification (blue) were performed independently in a cohort of 126 patients with breast, bile duct, colorectal, gastric, lung, or ovarian cancer. The number of individuals detected by each approach and in combination are indicated for DELFI detection with a specificity of 98%, targeted sequencing specificity at >99%, and a combined specificity of 98%. ND indicates not detected.
Supplementary Material
Acknowledgments
We thank members of our laboratories for critical review of the manuscript.
Funding: This work was supported, in part, by the Dr. Miriam and Sheldon G. Adelson Medical Research Foundation, the Stand Up to Cancer–Dutch Cancer Society International Translational Cancer Research Dream Team Grant (SU2C-AACR-DT1415), the Commonwealth Foundation, the Cigarette Restitution Fund, the Burroughs Wellcome Fund and the Maryland Genetics, Epidemiology and Medicine Training Program, the AACR-Janssen Cancer Interception Research Fellowship, the Mark Foundation for Cancer Research, U.S. NIH (grants CA121113, CA006973, and CA180950), the Danish Council for Independent Research (11–105240), the Danish Council for Strategic Research (1309–00006B), the Novo Nordisk Foundation (NNF14OC0012747 and NNF17OC0025052), and the Danish Cancer Society (R133-A8520–00-S41 and R146-A9466–16-S2). Stand Up To Cancer is a program of the Entertainment Industry Foundation administered by the American Association for Cancer Research.
Footnotes
Competing interests: S.C., A.L., J.P., J.F., V. Adleff, R.B.S., and V.E.V.. are inventors on patent applications (62/673,516 and 62/795,900) submitted by Johns Hopkins University related to cell-free DNA for cancer detection. V.E.V. is a founder of Delfi Diagnostics and Personal Genome Diagnostics, a member of their Scientific Advisory Boards and Boards of Directors, and owns Delfi Diagnostics and Personal Genome Diagnostics stock, which are subject to certain restrictions under university policy. Within the last five years, V.E.V. has been an advisor to Daiichi Sankyo, Janssen Diagnostics, Ignyta, and Takeda Pharmaceuticals. The terms of these arrangements are managed by Johns Hopkins University in accordance with its conflict of interest policies.
Additional information
Extended data is available for this paper at www.nature.com/nature.
Supplementary information is linked to the online version of the paper at www.nature.com/nature.
References and Notes
- 1.Wan JCM et al. Liquid biopsies come of age: towards implementation of circulating tumour DNA. Nat Rev Cancer 17, 223–238, doi: 10.1038/nrc.2017.7 (2017). [DOI] [PubMed] [Google Scholar]
- 2.Bray F et al. Global cancer statistics 2018: GLOBOCAN estimates of incidence and mortality worldwide for 36 cancers in 185 countries. CA Cancer J Clin 68, 394–424, doi: 10.3322/caac.21492 (2018). [DOI] [PubMed] [Google Scholar]
- 3.World Health Organization. Guide to Cancer Early Diagnosis. Guide to Cancer Early Diagnosis (2017). [Google Scholar]
- 4.National Comprehensive Cancer Network (NCCN) clinical practice guidelines in oncology. Accessed 16 April 2019. [DOI] [PubMed]
- 5.Phallen J et al. Direct detection of early-stage cancers using circulating tumor DNA. Sci Transl Med 9, doi: 10.1126/scitranslmed.aan2415 (2017). [DOI] [PMC free article] [PubMed] [Google Scholar]
- 6.Cohen JD et al. Detection and localization of surgically resectable cancers with a multi-analyte blood test. Science 359, 926–930, doi: 10.1126/science.aar3247 (2018). [DOI] [PMC free article] [PubMed] [Google Scholar]
- 7.Newman AM et al. An ultrasensitive method for quantitating circulating tumor DNA with broad patient coverage. Nat Med 20, 548–554, doi: 10.1038/nm.3519 (2014). [DOI] [PMC free article] [PubMed] [Google Scholar]
- 8.Bettegowda C et al. Detection of circulating tumor DNA in early- and late-stage human malignancies. Sci Transl Med 6, 224ra224, doi: 10.1126/scitranslmed.3007094 (2014). [DOI] [PMC free article] [PubMed] [Google Scholar]
- 9.Leary RJ et al. Development of personalized tumor biomarkers using massively parallel sequencing. Sci Transl Med 2, 20ra14, doi:2/20/20ra14 [pii] 10.1126/scitranslmed.3000702 [doi] (2010). [DOI] [PMC free article] [PubMed] [Google Scholar]
- 10.Leary RJ et al. Detection of chromosomal alterations in the circulation of cancer patients with whole-genome sequencing. Sci Transl Med 4, 162ra154, doi: 10.1126/scitranslmed.3004742 (2012). [DOI] [PMC free article] [PubMed] [Google Scholar]
- 11.Chan KC et al. Noninvasive detection of cancer-associated genome-wide hypomethylation and copy number aberrations by plasma DNA bisulfite sequencing. Proc Natl Acad Sci U S A 110, 18761–18768, doi: 10.1073/pnas.1313995110 (2013). [DOI] [PMC free article] [PubMed] [Google Scholar]
- 12.Jiang P et al. Lengthening and shortening of plasma DNA in hepatocellular carcinoma patients. Proc Natl Acad Sci U S A 112, E1317–1325, doi: 10.1073/pnas.1500076112 (2015). [DOI] [PMC free article] [PubMed] [Google Scholar]
- 13.Wang BG et al. Increased plasma DNA integrity in cancer patients. Cancer Res 63, 3966–3968 (2003). [PubMed] [Google Scholar]
- 14.Umetani N et al. Prediction of breast tumor progression by integrity of free circulating DNA in serum. J Clin Oncol 24, 4270–4276, doi: 10.1200/JCO.2006.05.9493 (2006). [DOI] [PubMed] [Google Scholar]
- 15.Chan KC, Leung SF, Yeung SW, Chan AT & Lo YM Persistent aberrations in circulating DNA integrity after radiotherapy are associated with poor prognosis in nasopharyngeal carcinoma patients. Clin Cancer Res 14, 4141–4145, doi: 10.1158/1078-0432.CCR-08-0182 (2008). [DOI] [PubMed] [Google Scholar]
- 16.Mouliere F et al. High fragmentation characterizes tumour-derived circulating DNA. PLoS One 6, e23418, doi: 10.1371/journal.pone.0023418 (2011). [DOI] [PMC free article] [PubMed] [Google Scholar]
- 17.Mouliere F et al. Enhanced detection of circulating tumor DNA by fragment size analysis. Sci Transl Med 10, doi: 10.1126/scitranslmed.aat4921 (2018). [DOI] [PMC free article] [PubMed] [Google Scholar]
- 18.Snyder MW, Kircher M, Hill AJ, Daza RM & Shendure J Cell-free DNA Comprises an In Vivo Nucleosome Footprint that Informs Its Tissues-Of-Origin. Cell 164, 57–68, doi: 10.1016/j.cell.2015.11.050 (2016). [DOI] [PMC free article] [PubMed] [Google Scholar]
- 19.Underhill HR et al. Fragment Length of Circulating Tumor DNA. PLoS Genet 12, e1006162, doi: 10.1371/journal.pgen.1006162 (2016). [DOI] [PMC free article] [PubMed] [Google Scholar]
- 20.Ulz P et al. Inferring expressed genes by whole-genome sequencing of plasma DNA. Nat Genet 48, 1273–1278, doi: 10.1038/ng.3648 (2016). [DOI] [PubMed] [Google Scholar]
- 21.Ivanov M, Baranova A, Butler T, Spellman P & Mileyko V Non-random fragmentation patterns in circulating cell-free DNA reflect epigenetic regulation. BMC Genomics 16 Suppl 13, S1, doi: 10.1186/1471-2164-16-S13-S1 (2015). [DOI] [PMC free article] [PubMed] [Google Scholar]
- 22.Jiang P et al. Preferred end coordinates and somatic variants as signatures of circulating tumor DNA associated with hepatocellular carcinoma. Proc Natl Acad Sci U S A, doi: 10.1073/pnas.1814616115 (2018). [DOI] [PMC free article] [PubMed] [Google Scholar]
- 23.Shen SY et al. Sensitive tumour detection and classification using plasma cell-free DNA methylomes. Nature, doi: 10.1038/s41586-018-0703-0 (2018). [DOI] [PubMed] [Google Scholar]
- 24.Corces MR et al. The chromatin accessibility landscape of primary human cancers. Science 362, doi: 10.1126/science.aav1898 (2018). [DOI] [PMC free article] [PubMed] [Google Scholar]
- 25.Polak P et al. Cell-of-origin chromatin organization shapes the mutational landscape of cancer. Nature 518, 360–364, doi: 10.1038/nature14221 (2015). [DOI] [PMC free article] [PubMed] [Google Scholar]
- 26.Lieberman-Aiden E et al. Comprehensive mapping of long-range interactions reveals folding principles of the human genome. Science 326, 289–293, doi: 10.1126/science.1181369 (2009). [DOI] [PMC free article] [PubMed] [Google Scholar]
- 27.Fortin JP & Hansen KD Reconstructing A/B compartments as revealed by Hi-C using long-range correlations in epigenetic data. Genome Biol 16, 180, doi: 10.1186/s13059-015-0741-y (2015). [DOI] [PMC free article] [PubMed] [Google Scholar]
- 28.Diehl F et al. Circulating mutant DNA to assess tumor dynamics. Nat Med 14, 985–990 (2008). [DOI] [PMC free article] [PubMed] [Google Scholar]
- 29.Phallen J et al. Early noninvasive detection of response to targeted therapy in non-small cell lung cancer. Cancer Research 15, 1204–1213, doi:DOI: 10.1158/0008-5472.CAN-18-1082 (2019). [DOI] [PMC free article] [PubMed] [Google Scholar]
- 30.Burnham P et al. Single-stranded DNA library preparation uncovers the origin and diversity of ultrashort cell-free DNA in plasma. Scientific reports 6, 27859, doi: 10.1038/srep27859 (2016). [DOI] [PMC free article] [PubMed] [Google Scholar]
- 31.Sanchez C, Snyder MW, Tanos R, Shendure J & Thierry AR New insights into structural features and optimal detection of circulating tumor DNA determined by single-strand DNA analysis. NPJ genomic medicine 3, 31, doi: 10.1038/s41525-018-0069-0 (2018). [DOI] [PMC free article] [PubMed] [Google Scholar]
- 32.Fisher S et al. A scalable, fully automated process for construction of sequence-ready human exome targeted capture libraries. Genome Biol 12, R1, doi: 10.1186/gb-2011-12-1-r1 (2011). [DOI] [PMC free article] [PubMed] [Google Scholar]
- 33.Jones S et al. Personalized genomic analyses for cancer mutation discovery and interpretation. Sci Transl Med 7, 283ra253, doi: 10.1126/scitranslmed.aaa7161 (2015). [DOI] [PMC free article] [PubMed] [Google Scholar]
- 34.Benjamini Y & Speed TP Summarizing and correcting the GC content bias in high-throughput sequencing. Nucleic Acids Res 40, e72, doi: 10.1093/nar/gks001 (2012). [DOI] [PMC free article] [PubMed] [Google Scholar]
- 35.Langmead B & Salzberg SL Fast gapped-read alignment with Bowtie 2. Nat Methods 9, 357–359, doi: 10.1038/nmeth.1923 (2012). [DOI] [PMC free article] [PubMed] [Google Scholar]
- 36.Friedman JH Greedy function approximation: A gradient boosting machine. Ann Stat 29, 1189–1232, doi:DOI 10.1214/aos/1013203451 (2001). [DOI] [Google Scholar]
- 37.Friedman JH Stochastic gradient boosting. Comput Stat Data An 38, 367–378, doi:Doi 10.1016/S0167-9473(01)00065-2 (2002). [DOI] [Google Scholar]
- 38.Efron B & Tibshirani R Improvements on cross-validation: The .632+ bootstrap method. J Am Stat Assoc 92, 548–560, doi:Doi 10.2307/2965703 (1997). [DOI] [Google Scholar]
- 39.Zurbenko IG The spectral analysis of time series. (Elsevier, 1986). [Google Scholar]
- 40.Robin X et al. pROC: an open-source package for R and S+ to analyze and compare ROC curves. BMC bioinformatics 12, 77, doi: 10.1186/1471-2105-12-77 (2011). [DOI] [PMC free article] [PubMed] [Google Scholar]
Associated Data
This section collects any data citations, data availability statements, or supplementary materials included in this article.
Supplementary Materials
Data Availability Statement
Sequence data utilized in this study have been deposited at the database of Genotypes and Phenotypes (dbGaP, study ID 34536). Code for analyses is available at http://github.com/Cancer-Genomics/delfi_scripts.


