Abstract
Objective:
Dermatomyositis (DM) and polymyositis (PM) make up the largest group of potentially treatable myopathies and require early diagnosis. This study investigates whether the edema of thigh muscles in DM/PM can be quantitatively assessed by a novel accelerated T2 mapping technique—GRAPPATINI.
Methods:
Three conventional MR sequences and GRAPPATINI accelerated T2 mapping of bilateral thighs from 20 patients (7 DM and 13 PM) and 10 healthy volunteers were prospectively carried out on a 3 T MR scanner. Afterwards, T2 values of 477 thigh muscles from the patients and the healthy controls were manually measured. In addition, the correlations between T2 values and serum muscle enzymes in patients were also analyzed.
Results:
The new GRAPPATINI technique made quantitative T2 mapping of bilateral thighs feasible with a scanning time of only 2 min 18 s. Moreover, GRAPPATINI-generated T2 values of muscles from patients were markedly higher than those from healthy subjects (p < 0.001). GRAPPATINI accelerated T2 mapping appeared a more sensitive technique in that some DM/PM muscles appearing normal per conventional MRI had increased T2 relaxation time. Furthermore, GRAPPATINI-generated T2 values of DM/PM thigh muscles positively correlated with serum enzyme levels (p < 0.001), which reflected the severity of myopathy.
Conclusion:
GRAPPATINI can significantly shorten acquisition time of T2 mapping and may potentially be applied clinically in DM and PM.
Advances in knowledge:
GRAPPATINI acceleration makes T2 mapping feasible in clinical practice in providing quantitative information regarding thigh muscle inflammation in DM and PM.
Introduction
Dermatomyositis (DM) and polymyositis (PM) are two important inflammatory myopathies that are immune mediated. These diseases are the largest group of potentially treatable myopathies in children and adults.1 Their hallmarks are weakness and muscle inflammation in the proximal musculature. DM and PM are highly debilitating and easily relapse,2–4 with a mean 10 year survival rate of approximately 69%.5 It is critical to diagnose these diseases in an early stage. Without early treatment, a variety of serious complications can develop, including interstitial lung disease, pneumonia, cardiac arrhythmias, and ventricular dysfunction.6
In recent years, the importance of MRI for assessment of DM and PM has been widely recognized, because of its non-invasive nature and high contrast for soft tissues.7,8 Nevertheless, assessment of signal changes in conventional MRI [usually fat saturated T2 weighted images (T2WI)] is subjective and hard to quantify among different MRI scanners and acquisition protocols.9,10 T2 mapping technology which can quantitatively measure the T2 relaxation time of tissue has the potential to objectively quantify muscle edema, making MRI evaluations comparable. A previous study exploring T2 mapping sequence in children with juvenile DM,11 revealed significantly increased T2 values in active juvenile DM compared with inactive juvenile DM and healthy children. However, in order to acquire a reliable sampling, conventional T2 mapping technique has to sample the whole k-space, thus requiring as long as 30 min for each thigh examination,12 which is clinically impractical.
For rapid acquisition of T2 mapping, a fast acceleration technique has been newly proposed that is based on a multiecho spin echo sequence, including a reconstruction method that combines model-based accelerated relaxometry by iterative nonlinear inversion (MARTINI)13,14 with generalized autocalibrating partial parallel acquisition (GRAPPA).15 GRAPPA, a method for parallel imaging, uniformly undersamples k-space (e.g. skipping every other phase-encoding line) and then compensates for the undersampled data by using spatial sensitivity information from a multi coil receiver array in the k-space domain. MARTINI allows, on top of GRAPPA, a blockwise undersampling of k-space, shifting the sampled blocks of k-space between the different echoes (i.e. in each echo, a different block of k-space is acquired). In order to recover non-sampled information, it imposes prior information on the signal decay, i.e. a mono-exponential decay over the echoes, and uses an iterative optimization algorithm to minimize the error of the estimation with respect to the sampled data. This combination, GRAPPATINI, can exploit the orthogonal characteristics of the two underlying methods, enabling additional acceleration in brain T2 maps.16,17 The scanning time of the whole brain T2 map in healthy volunteers was shortened from 17 min 23 s with conventional T2 mapping sequence to only 3 min 46 s with this new technique, achieving a 10-fold acceleration. However, little is known about whether this acceleration technique could be applied to evaluate musculature in patients with DM or PM.
The aim of the present study is to use T2 mapping accelerated by GRAPPATINI technique to study thigh muscles of patients with DM or PM, and to evaluate whether T2 values generated by this method can quantitatively assess muscular edema in DM and PM.
methods and materials
Study population
This prospective one center study was performed according to the standard of medical ethics at Peking Union Medical College Hospital, and all the subjects provided written, informed consent for their participation. Inclusion criteria were as follows: (i) DM/PM patients were diagnosed by rheumatologists at our hospital; (ii) electromyography (EMG) was performed after or at least 1 week before the MRI examination; and (iii) muscle biopsy was conducted after or at least 1 month before the MRI examination. Exclusion criteria were as follows: (i) gravida; (ii) juveniles; (iii) individuals with claustrophobia or other MRI contraindications. The patients' demographic information and serum muscle enzymes around the MRI examination, including creatine kinase (CK), alanine aminotransferase (ALT), aspartate aminotransferase (AST), and lactate dehydrogenase (LDH) were recorded.
Healthy volunteers who were free of systemic or musculoskeletal diseases were included as a control group. Both patients and volunteers were instructed to avoid physical exercises for 2 days and to sit still for 30 min before the examination.
Finally, a total of 20 patients including seven patients with DM and 13 patients with PM from our hospital were enrolled in this study consecutively from November 2016 to September 2018. There were 9 male and 11 female patients, with an average age of 49.0 years. Among the patients, one had concurrent breast cancer, one had ascending colon cancer, and one died later of interstitial lung fibrosis complicated by infection. Patient characteristics are presented in Table 1. Additionally, 10 healthy volunteers served as the control group, which included 1 male and 9 females, aged 25–63 years, with an average age of 36.6 years.
Table 1. .
Patient characteristics
| Age | 49.0 y (range, 29–69 y) |
| Gender | Female-to-male ratio = 1:1.2 |
| Diagnosis | Dermatomyositis (n = 7) |
| Polymyositis (n = 13) | |
| Length of disease | 32.2 m (range, 2–144 m) |
| Status of Treatment | Treated (n = 7) |
| Untreated (n = 13) | |
| CK (normal range, 24–195 U l−1) | 1816 U l−1 (range, 15–4055 U l−1) |
| ALT (normal range, 9–50 U l−1) | 92 U l−1 (range, 11–277 U l−1) |
| AST (normal range, 15–40 U l−1) | 121 U l−1 (range, 15–247 U l−1) |
| LDH (normal range, 0–250 U l−1) | 560 U l−1 (range, 143–1274 U l−1) |
ALT = alanine aminotransferase, AST = aspartate aminotransferase,CK = creatine kinase, and LDH = lactate dehydrogenase.
Image acquisition
Subjects were scanned using a Magnetom Skyra 3T MR scanner (Siemens Healthcare, Erlangen, Germany) with an 18-channel body coil. Subjects were placed head first in the supine position, and both thighs were scanned at the same time. The detailed parameters of conventional coronal T1 weighted imaging (T1WI), coronal Dixon T2WI, axial Dixon T2WI, and axial T2 mapping were listed in Table 2. For T2 mapping, chemical shift selective saturation was used to achieve fat saturation; GRAPPA acceleration factor = 2 with an additional MARITINI undersampling factor of 5, resulting in a 10-fold total acceleration.
Table 2. .
MR sequence parameters
| Parameter | T1 weighted VIBE dixon coronal image | T2 weighted dixon coronal image | T2 weighted dixon axial image | T2 mapping accelerated by GRAPPATINI axial image |
| Field of view (mm2) | 420 × 420 | 420 × 420 | 420 × 236 | 400 × 232 |
| Pixel (mm3) | 1.0 × 1.0×1.0 | 0.8 × 0.8×5.0 | 0.8 × 0.8×5.0 | 1.7 × 1.7×5.0 |
| TR (ms) | 6.73 | 3050 | 5330 | 6690 |
| TE (ms) | 2.46/3.69 | 119 | 119 | 10–100 (ΔTE = 10 ms) |
| No. of slices (mm) | 176 | 32 | 56 | 56 |
| Slice thickness (mm) | 1 | 5 | 5 | 5 |
| Interslice gap (mm) | 0 | 1 | 1 | 1 |
| No. of averages | 1 | 1 | 1 | 1 |
| No. of concatenations | 1 | 2 | 2 | 1 |
| Bandwidth (Hz/Pixel) | 670/320 | 337 | 337 | 221 |
| Acquisition time | 5 min 17 s | 3 min 23 s | 2 min 41 s | 2 min 18 s |
TE, echo time; TR, repetition time;VIBE, volumetric interpolated breath-hold examination.
GRAPPA acceleration factor = 2 with an additional MARITINI undersampling factor of 5, resulting in a 10-fold total acceleration.
Image measurements
Acquired images were transferred to a workstation (syngo multi modality workplace, Siemens Healthcare) where two experienced radiologists specialized in musculoskeletal imaging (8 and 15 years of work experience) analyzed the MR images. A consensus was reached on the location of the affected area and signal characteristics. On the basis of fat saturated axial T2WI, region of interest (ROI) was drawn with an area of about 60 mm2 which was replicated on the corresponding T2 map images. The T2 map was color coded reflecting the T2 relaxation times. Eight muscles [vastus medialis (VM), vastus lateralis (VL), rectus femoris (RF), and vastus intermedius (VI) from anterior group; adductor magnus (AM) from medial group; and biceps femoris (BF), semi-membranosus (SM), and semi-tendinosus (ST) muscles from posterior group] were analyzed and assessed one by one. Sartorius and gracilis were excluded because of their relatively small transverse area. Bilateral thigh muscles were calculated separately.
In patients, edematous muscle was defined as increased signal intensity noted on fat saturated T2WI; non-edematous muscle was defined as normal signal intensity of thigh muscle on both coronal and axial fat saturated T2WI. The T2 values of the edematous and non-edematous thigh muscles of DM/PM patients and normal subjects were measured. For edematous muscles, the ROI was drawn in the maximum cross-section of the lesion; for non-edematous and normal muscles, it was drawn in the maximum cross-section of muscle. Areas of fat infiltration, artifacts, and blood vessels were carefully avoided when placing the ROI.
Statistical analysis
Data were analyzed using SPSS v. 22.0 software (SPSS Inc., Chicago, IL). Variables are expressed as mean ± standard deviation (SD). For one marker of each muscle, the group t test was used to evaluate statistical differences among three groups—i.e. edematous group of DM/PM patients, non-edematous group of DM/PM patients, and healthy control subjects. Since there are multiple comparisons, the Bonferroni correction was applied and p < 0.017 (0.05/3) was considered statistically significant. In order to detect the relationship between T2 values and serum muscle enzymes, Pearson correlation coefficient was used and p < 0.05 was considered statistically significant.
Results
All patients and healthy subjects underwent MRI scanning successfully with parameters outlined in Table 2. The acquisition time for T2 mapping accelerated by GRAPPATINI was 2 min and 18 s, and the total scanning time for each patient was about 15 min. In one DM patient, focal edema of three muscles (BF, SM and ST) of the left thigh was on the distal portion close to the coil edge. As a result, the corresponding T2 map slices were distorted, thus these three muscles were excluded. As a result, a total of 212 edematous muscles and 105 non-edematous muscles in patients, and 160 muscles in healthy volunteers were measured to obtain T2 values.
GRAPPATINI-T2 map differentiated muscles from myositis patients vs. healthy individuals
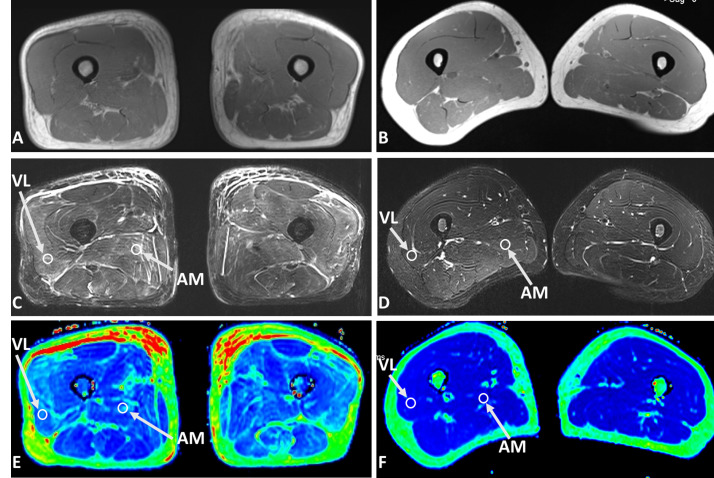
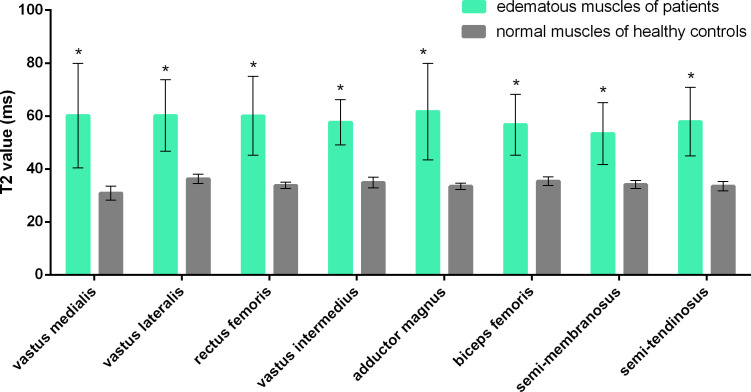
The very first question is whether GRAPPATINI accelerated T2 mapping could differentiate inflammatory muscles from myositis patients and normal muscles from healthy volunteers. To address this issue, this T2 mapping technique was applied to analyze inflammatory muscles from the DM or PM patients, and normal muscles from healthy volunteers. As shown in Figures 1 and 2, T2 values of edematous VM of patients were markedly higher than those of normal VM of healthy subjects (60.19 ± 19.80 ms vs 30.92 ± 2.62 ms, p < 0.001). Similarly, for each of the other seven thigh muscles evaluated (VL, RF, VI, AM, BF, SM and ST), the T2 values of the edematous DM/PM group were significantly higher than those of the volunteer group (all p < 0.001). The results suggested that GRAPPATINI accelerated T2 mapping could differentiate between inflammatory myopathy and healthy controls, and thus had application potential for the diagnosis of DM/PM.
Figure 1. .
Axial T1 weighted images (A, B), fat saturated T2 weighted images (C, D), and T2 maps (E, F) of a 59-year-old male with dermatomyositis (left panel), and a 33-year-old healthy volunteer (right panel), respectively. In the patient with dermatomyositis, the T2 weighted image showed diffused muscle edema and patchy subcutaneous fluid in both thighs. The T2 value of AM and VL was 55.40 ms and 65.62 ms, respectively. In comparison, the T2 value of AM and VL in the healthy control was was 35.87 ms and 34.94 ms, respectively. AM, adductor magnus; VL, vastus lateralis.
Figure 2. .
GRAPPATINI generated T2 values of edematous muscles of patients with dermatomyositis or polymyositis and those of normal muscles of healthy controls. * represents a statistically significant difference (p < 0.017).
GRAPPATINI-T2 map was not inferior to conventional MRI in detection of muscle edema
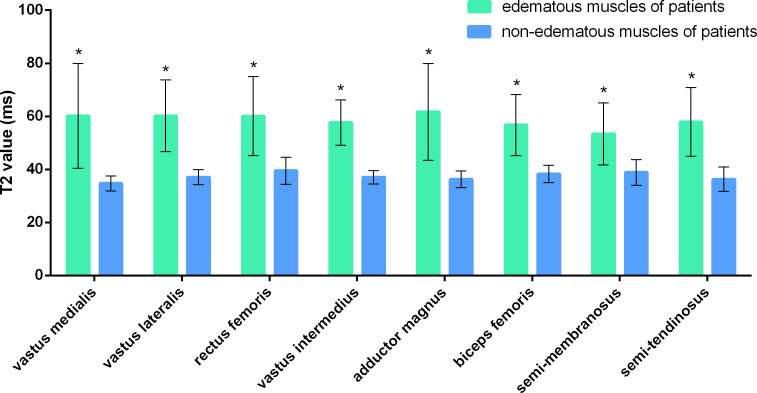
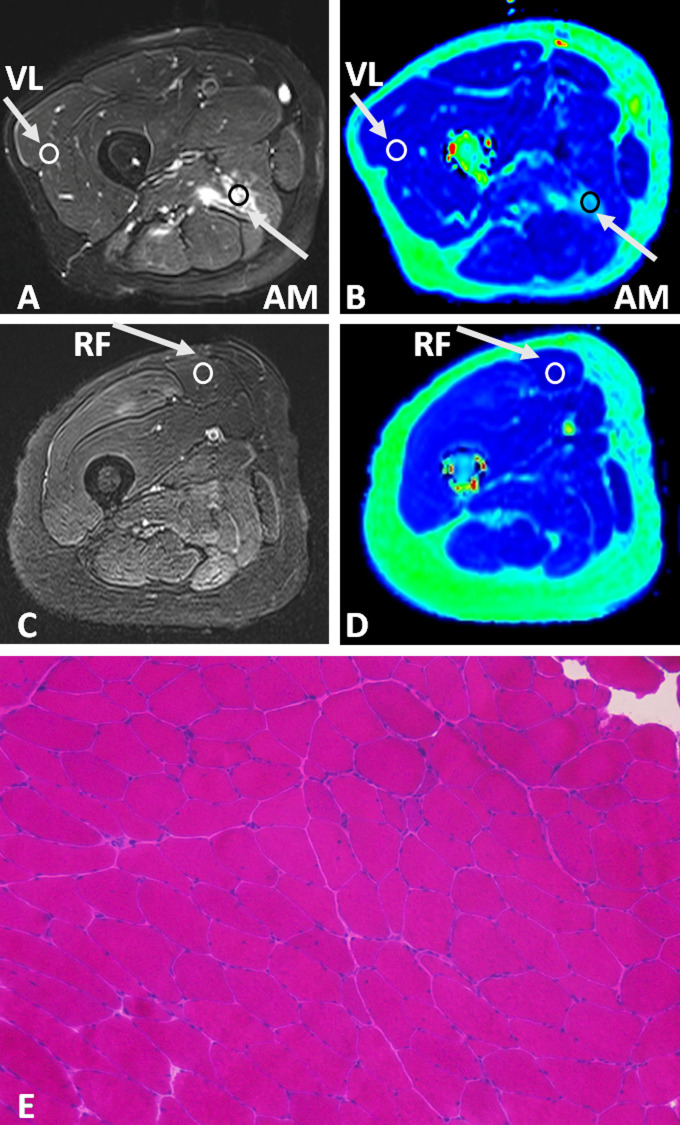
Because GRAPPATINI significantly shortened the procedure time compared to conventional method, it was necessary to investigate whether GRAPPATINI accelerated T2 mapping was as efficient as conventional MRI in reflecting the muscular edema due to inflammatory myopathies. For this purpose, the muscles of the DM/PM patients were categorized into two groups: those with edema and those without edema per conventional MRI assessments. GRAPPATINI accelerated T2 mapping was applied to these two groups of muscles and T2 values were generated. As shown in Figure 3, there is a significant difference between T2 values of the edematous and non-edematous VM of patients (60.19 ± 19.80 ms vs 34.73 ± 2.84 ms, p < 0.001). Similar trend was also observed in the other seven thigh muscles evaluated (VL, RF, VI, AM, BF, SM and ST), where all the T2 values of the edematous muscles were significantly higher than T2 values of the non-edematous muscles (p < 0.001) (Figure 4A & B). The data indicated GRAPPATINI accelerated T2 mapping was as efficient as conventional MRI for quantitatively assessing the muscular edema of the DM/PM patients.
Figure 3. .
GRAPPATINI generated T2 values of edematous and non-edematous muscles (as determined by conventional MRI) of patients with dermatomyositis or polymyositis. * represents a statistically significant difference (p < 0.017).
Figure 4. .
Axial fat saturated T2 weighted image (A), and T2 map (B) of the right thigh from a 50-year-old male with polymyositis; axial fat saturated T2 weighted image (C), T2 map (D), and histopathology (E, hematoxylin and eosin [H & E] staining,×100) of the right thigh from a 52-year-old female with polymyositis. In the male patient, there was patchy edema in the right AM in T2 weighted image (A) with a T2 value of up to 69.54 ms (B), while the T2 value of VL which appeared normal on structural images was 40.21 ms. In the female patient, the signal intensity of RF on T2 weighted image of the right thigh (C) was almost normal; its T2 value measured on T2 map (D) was mildly elevated to be approximately 37.08 ms (T2 value of RF in healthy volunteers: 33.81 ± 1.21 ms). Biopsy of the RF after MRI examination (E) revealed scattered myofiber atrophy with very few degenerative changes. AM, adductor magnus; RF, rectus femoris; VL, vastus lateralis.
GRAPPATINI-T2 map appeared more sensitive than conventional MRI in detecting muscle edema
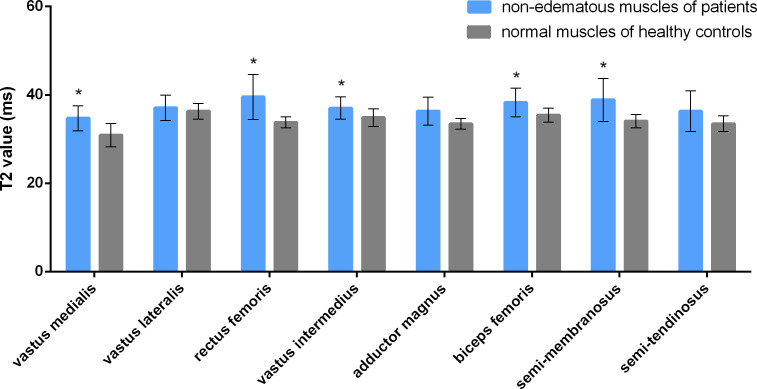
In order to diagnose DM/PM in early stage, it is important to identify the change when muscular edema is still in early stage and not obvious. It was unknown whether GRAPPATINI accelerated T2 mapping had advantage over conventional MRI for this application. To address this issue, non-edematous muscles of DM/PM group as determined by conventional MRI were analyzed with GRAPPATINI accelerated T2 mapping. The muscles of healthy volunteers were also analyzed to serve as the control. The results were shown in Figure 5. GRAPPATINI-generated T2 values of VM, RF, VI, BF, and SM in the so-called non-edematous muscles of patients were higher than those of the control group with statistically significant differences (p < 0.001, p < 0.001, p = 0.014, 0.007, and 0.006, respectively) (Figure 4C–E). Of note, GRAPPATINI-generated T2 values of VL, AM, and ST in the so-called non-edematous muscles of patients were also higher when compared to those of the control group, but the differences were not statistically significant (all p > 0.017). The results indicate that in DM and PM, some muscles appearing normal per conventional MRI may already have increased T2 relaxation time. Thus, compared to conventional MRI, GRAPPATINI accelerated T2 mapping is a more sensitive technique, and may potentially be used to identify early-stage myopathies in which the edema is still non-obvious to conventional imaging technique.
Figure 5. .
GRAPPATINI-generated T2 values of the non-edematous muscles (per conventional MRI) of patients with dermatomyositis or polymyositis vs those of normal muscles of healthy controls.* represents a statistically significant difference (p < 0.017).
GRAPPATINI-T2 map positively correlated with analysis of serum muscle enzymes
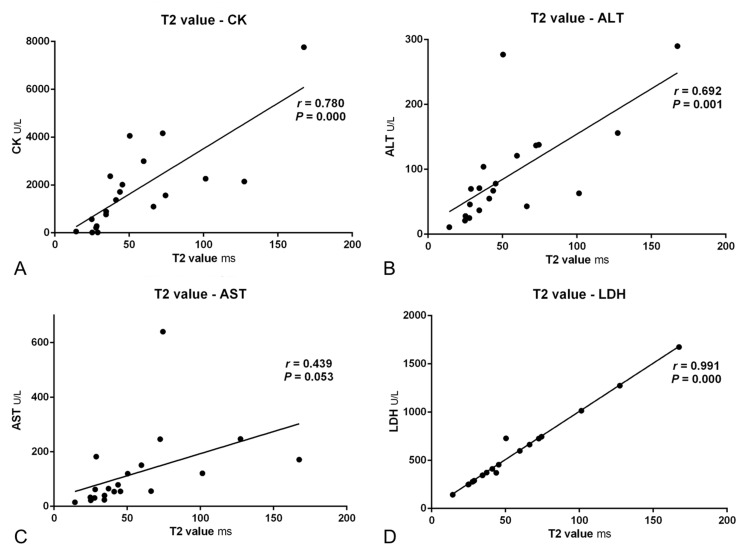
It is important to investigate whether T2 values measured by GRAPPATINI accelerated T2 mapping can reflect the severity of muscle damages, which is commonly evaluated by serum muscle enzymes. Thus, the correlation between GRAPPATINI-generated T2 values of thigh muscles and serum muscle enzymes in patients with DM or PM was investigated. The results were presented in Figure 6. Analysis using Pearson correlation coefficient revealed a positive relationship between the T2 values and serum CK, ALT, or LDH with an r value of 0.780, 0.692, and 0.991, respectively (all p < 0.001). The correlation coefficient of T2 values and serum AST level was marginal (r = 0.439) and not statistically significant (p = 0.053). These results indicate that in patients with DM or PM, T2 values generated by GRAPPATINI accelerated T2 mapping may be associated with the severity of muscle damages.
Figure 6. .
Correlations between GRAPPATINI-generated T2 values and muscle enzymes of patients with dermatomyositis or polymyositis. ALT, alanine aminotransferase; AST, aspartateaminotransferase; CK, creatine kinase; LDH, lactate dehydrogenase.
Discussion
Applying T2 mapping to thigh muscles is potentially helpful to manage DM and PM by providing quantitative information of disease activity, but is clinically impractical due to the long scanning time. In this study, the clinical feasibility of using T2 mapping accelerated by GRAPPATINI in thigh muscles was investigated in 20 patients with DM or PM and 10 healthy control subjects. The results showed this prototypically fast T2 mapping technique made quantitative acquisition of both thighs from hips to knees feasible with a scanning time of only 2 min and 18 s, though the FOV was as large as 400 mm, the slice thickness was as small as 5 mm, and the interslice gap was only 1 mm. Regarding quantitative evaluation, T2 values of edematous muscles in patients with DM or PM are significantly elevated, as compared to those of non-edematous muscles of patients and normal muscles of healthy controls. In addition, elevation of GRAPPATINI-generated T2 values in some so-called non-edematous muscles (i.e. appearing normal in conventional MRI) in DM/PM patients was also observed when compared to the healthy control subjects. Moreover, there is a positive correlation between T2 values and serum muscle enzymes (CK, ALT, and LDH) in DM/PM patients. Thus, GRAPPATINI accelerated T2 mapping is clinically feasible and potentially useful for quantitative analysis of muscle inflammation in DM and PM.
In contrast to conventional structural MRI images, quantitative mapping provides important data for both intra- and intersubject comparisons.18 However, the major challenge of clinically applying conventional T2 mapping to thigh muscles is the long scanning time. In order to obtain a high resolution and minimize spatial blurring and ringing, conventional T2 mapping sequence must sample the entire k-space, resulting a very long scanning time. During MRI examination, it is critical for patients to lie still in order to avoid motion artifacts, but patients with myositis suffering from myasthenia, weakness, fever, or other systemic conditions (tumors, infections, etc.) are not able to lie still in MRI scanner for as long as 30 min as required by conventional T2 mapping for thigh examination. In order to determine where to perform T2 mapping for edematous thigh muscles, radiologists need to participate in the examination for the data acquisition. Given the long examination time, as well as the patchy muscle edema in myositis, using T2 map to evaluate thigh muscles of myositis is impractical for clinical usage and plagued with sampling error.
The novel prototype GRAPPATINI T2 mapping technique16,17 used in this study combines MARTINI13,14 and GRAPPA.15 Model-based iterative reconstruction algorithms use a physical model of the signal as prior information. In conjunction with the iterative reconstruction optimizer, this information allows for sub Nyquist sampling of the k-space. The reconstruction starts with initial estimates of the M0 image and T2 map based on standard fitting of under sampled data, and iteratively checks whether the error between estimated and measured values meet a fixed termination criterion. Additionally, GRAPPA is used to interpolate missing k-space lines of two-fold subsampled blocks of the MARTINI scheme prior to MARTINI reconstruction. The accuracy and reproductivity of T2 mapping accelerated by the combination of the two fast-acquisition techniques was investigated on a phantom as well as brain, knee, prostate, and liver from three healthy volunteers, showing highly reproducible and fast T2 maps.17 Herein, T2 mapping accelerated by GRAPPATINI allows the application of T2 mapping to bilateral thighs with a scanning time of as short as approximately 2 min. With the advantage of GRAPPATINI acceleration, T2 mapping of the whole thigh is made feasible to run on autopilot without the supervision of radiologists during the examination. In addition, radiologists are able to retrospectively place ROIs on T2 map images to objectively evaluate any muscle lesions of interest.
In this study, GRAPPATINI-generated T2 values of edematous muscles in patients with DM or PM were remarkably elevated, which is in accordance with the pathophysiological changes and previous studies using conventional T2 mapping sequences.11,19,20 The T2 value describes the transverse relaxation rate, with a higher value indicating an increased amount of free water. In DM, complement membranolytic attack complex is activated and deposited on the endothelial cells, leading to necrosis, ischemia, and muscle fiber destruction; in contrast, CD8+ cytotoxic T cells are recruited in PM to attack the surface of the muscle fibers directly.21 Nevertheless, both immunologic processes result in muscle edema and myonecrosis, which is reflected by the increased T2 relaxation time quantitatively measured by T2 mapping accelerated by GRAPPATINI. Herein, the GRAPPATINI-generated T2 value in edematous thigh muscles of DM and PM was around 60 ms, which is comparable to the average T2 value of edematous muscles in IM of two prior studies using a 1.5 T MRI scanner and conventional T2 mapping (62.219 and 62.4 ms,20 respectively). In myositis, muscle edema represents active muscle inflammation which is treatable and reversible. T2 mapping accelerated by GRAPPATINI could quantitatively assess muscular edema of patients with DM or PM, and may potentially contribute to clinical management of DM and PM.
One unexpected result of this study is the elevation of GRAPPATINI-generated T2 values of some non-edematous muscles in PM/DM patients that appeared normal on conventional MRI, when compared to those of the healthy control subjects. In a research on myocardial edema of 27 patients with acute ischemic injury,22 edema was detected in 26 patients with T2 mapping; by comparison, T2WI with short time inversion recovery was negative in seven and uninterpretable in two patients. However, no similar result has been reported so far for myositis, probably because healthy volunteers were not included in previous studies of applying T2 mapping in myositis patients. Inflammatory cells have been detected in DM/PM by biopsy in thigh muscles with normal appearance in conventional MRI, while microscopic changes may have occurred.8 The signal of affected muscles can only be detected by radiologists in the conventional structural MRI images when the intensity changes significantly; whereas the results of this study indicate that GRAPPATINI accelerated T2 mapping technique may detect earlier changes. Thus, GRAPPATINI T2 mapping may enable early detection of muscle lesions in DM and PM, which is critical for early diagnosis.
Although muscle enzymes are widely used to diagnose and follow up patients with DM or PM, they are not specific and may be affected in different conditions.23 For example, CK responds to any muscle injury such as muscular dystrophy, extreme exercises, and end stage renal diseases; LDH exists in nearly every tissue of the body, thus increases in a variety of diseases; ALT and AST are more often used as markers for liver injury and dysfunction. Thus, a reliable biomarker is needed to reflect the severity of muscle damages. A prior study20 showed that T2 values of conventional T2 mapping correlated with serum CK and LDH (r = 0.42 and 0.35, respectively) in myositis. In our study, this correlation was also observed with a much higher correlation coefficient (r = 0.780 and 0.991, respectively). Besides, a correlation between the T2 values of thigh muscles and serum ALT (r = 0.692) was revealed in this study as well. Therefore, GRAPPATINI-generated T2 value of thigh muscles may serve as an alternative biomarker to evaluate muscle inflammation in DM and PM.
Admittedly, there were several limitations in this study. First, the sample size was relatively small, and the patients are relatively heterogeneous in regards to age, length of diseases and therapy. But we believe that the increase of muscle T2 values is mainly caused by myositis rather than these factors. Besides edema, fatty infiltration and muscle atrophy are also important manifestations in DM and PM, which may confound the interpretation of muscle T2 values especially in advanced myositis. However, the theoretical advantage of fat corrected T2 measurement over T2 measurement was not confirmed.20 In our study, T2 mapping with fat saturation was used, and ROI was carefully drawn on the basis of fat saturated T2WI to avoid fat infiltration, artifacts, and blood vessels. Second, the clinical myositis disease metrics such as Physician Global Activity and Myositis Disease Activity Assessment Tool were not performed since they are time-consuming and not routinely used in daily clinical practice, especially in populated countries. Third, there was no systemic comparison of this new T2 mapping technique and conventional T2 mapping sequences, as the conventional T2 mapping sequences with the same FOV, slice thickness and inter slice gap will result in a very long scanning time for the patients. Lastly, the abnormal site identified by T2 mapping was not subjected to muscle biopsy due to ethical considerations.
Conclusion
Our findings demonstrate that GRAPPATINI acceleration significantly shortened the examination time and makes T2 mapping feasible in clinical practice in providing quantitative information regarding thigh muscle edema in DM and PM.
Footnotes
Acknowledgment: The authors thank Tianyi Qian (Siemens Healthcare, Beijing, China) for his technical support, and Dong Liu (Department of Radiology, Peking Union Medical College Hospital, Chinese Academy of Medical Sciences & Peking Union Medical College, Beijing, China) for help during data acquisition.
Fengdan Wang and Haiping Zhang are contributed equally
Contributor Information
Fengdan Wang, Email: wangfengdan@pumch.cn.
Haiping Zhang, Email: 18810554160@163.com.
Chanyuan Wu, Email: wchypumch@hotmail.com.
Qian Wang, Email: wangqian_pumch@126.com.
Bo Hou, Email: hb8680@gmail.com.
Yi Sun, Email: yi-sun@siemens.com.
Tobias Kober, Email: tobias.kober@simens-healthineers.com.
Tom Hilbert, Email: tom.hilbert@epfl.ch.
Yan Zhang, Email: zhangyanpumch@126.com.
Xiaofeng Zeng, Email: wfdpumc@126.com.
Zhengyu Jin, Email: pumchradiology@126.com.
REFERENCES
- 1.Furst DE, Amato AA, Iorga Şerban R, Gajria K, Fernandes AW. Epidemiology of adult idiopathic inflammatory myopathies in a U.S. managed care plan. Muscle Nerve 2012; 45: 676–83. doi: 10.1002/mus.23302 [DOI] [PubMed] [Google Scholar]
- 2.Marie I, Lahaxe L, Benveniste O, Delavigne K, Adoue D, Mouthon L, et al. Long-Term outcome of patients with polymyositis/ dermatomyositis and anti-PM-Scl antibody. Br J Dermatol 2010; 162: 337–44. doi: 10.1111/j.1365-2133.2009.09484.x [DOI] [PubMed] [Google Scholar]
- 3.Marie I, Ménard J-F, Hachulla E, Chérin P, Benveniste O, Tiev K, et al. Infectious complications in polymyositis and dermatomyositis: a series of 279 patients. Semin Arthritis Rheum 2011; 41: 48–60. doi: 10.1016/j.semarthrit.2010.08.003 [DOI] [PubMed] [Google Scholar]
- 4.Hallowell R, Ascherman D, Danoff S. Pulmonary manifestations of polymyositis/dermatomyositis. Semin Respir Crit Care Med 2014; 35: 239–48. doi: 10.1055/s-0034-1371528 [DOI] [PubMed] [Google Scholar]
- 5.Chen LF, Chao CT, Chen CJ. Correspondence to inflammatory muscle disease. N Engl J Med 2015; 373: 393. [DOI] [PubMed] [Google Scholar]
- 6.van der Kooi AJ, de Visser M. Idiopathic inflammatory myopathies. Handb Clin Neurol 2014; 119: 495–512. [DOI] [PubMed] [Google Scholar]
- 7.Del Grande F, Carrino JA, Del Grande M, Mammen AL, Christopher Stine L. Magnetic resonance imaging of inflammatory myopathies. Top Magn Reson Imaging 2011; 22: 39–43. doi: 10.1097/RMR.0b013e31825b2c35 [DOI] [PubMed] [Google Scholar]
- 8.Tomasová Studynková J, Charvát F, Jarosová K, Vencovsky J. The role of MRI in the assessment of polymyositis and dermatomyositis. Rheumatology 2007; 46: 1174–9. doi: 10.1093/rheumatology/kem088 [DOI] [PubMed] [Google Scholar]
- 9.Filli L, Maurer B, Manoliu A, Andreisek G, Guggenberger R. Whole-Body MRI in adult inflammatory myopathies: do we need imaging of the trunk? Eur Radiol 2015; 25: 3499–507. doi: 10.1007/s00330-015-3783-3 [DOI] [PubMed] [Google Scholar]
- 10.Schanz S, Henes J, Ulmer A, Kötter I, Fierlbeck G, Claussen CD, et al. Magnetic resonance imaging findings in patients with systemic scleroderma and musculoskeletal symptoms. Eur Radiol 2013; 23: 212–21. doi: 10.1007/s00330-012-2584-1 [DOI] [PubMed] [Google Scholar]
- 11.Maillard SM, Jones R, Owens C, Pilkington C, Woo P, Wedderburn LR, et al. Quantitative assessment of MRI T2 relaxation time of thigh muscles in juvenile dermatomyositis. Rheumatology 2004; 43: 603–8. doi: 10.1093/rheumatology/keh130 [DOI] [PubMed] [Google Scholar]
- 12.Kim HK, Laor T, Horn PS, Racadio JM, Wong B, Dardzinski BJ. T2 mapping in Duchenne muscular dystrophy: distribution of disease activity and correlation with clinical assessments. Radiology 2010; 255: 899–908. doi: 10.1148/radiol.10091547 [DOI] [PubMed] [Google Scholar]
- 13.Sumpf TJ, Uecker M, Boretius S, Frahm J. Model-Based nonlinear inverse reconstruction for T2 mapping using highly undersampled spin-echo MRI. J Magn Reson Imaging 2011; 34: 420–8. doi: 10.1002/jmri.22634 [DOI] [PubMed] [Google Scholar]
- 14.Block KT, Uecker M, Frahm J. Model-Based iterative reconstruction for radial fast spin-echo MRI. IEEE Trans Med Imaging 2009; 28: 1759–69. doi: 10.1109/TMI.2009.2023119 [DOI] [PubMed] [Google Scholar]
- 15.Griswold MA, Jakob PM, Heidemann RM, Nittka M, Jellus V, Wang J, et al. Generalized autocalibrating partially parallel acquisitions (grappa. Magn Reson Med 2002; 47: 1202–10. doi: 10.1002/mrm.10171 [DOI] [PubMed] [Google Scholar]
- 16.Hilbert T, Kober T, Sumpf TJ, Tan Z. MARTINI and GRAPPA-when speed is taste. Proc Intl Soc Mag Reson Med 2014;Available from https://infoscience.epfl.ch/record/210638. [Google Scholar]
- 17.Hilbert T, Sumpf TJ, Weiland E, Frahm J, Thiran J-P, Meuli R, et al. Accelerated T2 mapping combining parallel MRI and model-based reconstruction: GRAPPATINI. J Magn Reson Imaging 2018; 48: 359–68. doi: 10.1002/jmri.25972 [DOI] [PubMed] [Google Scholar]
- 18.Patten C, Meyer RA, Fleckenstein JL. T2 mapping of muscle. Semin Musculoskelet Radiol 2003; 7: 297–305. doi: 10.1055/s-2004-815677 [DOI] [PubMed] [Google Scholar]
- 19.Yao L, Gai N. Fat-corrected T2 measurement as a marker of active muscle disease in inflammatory myopathy. AJR Am J Roentgenol 2012; 198: W475–W481. doi: 10.2214/AJR.11.7113 [DOI] [PubMed] [Google Scholar]
- 20.Yao L, Yip AL, Shrader JA, Mesdaghinia S, Volochayev R, Jansen AV, et al. Magnetic resonance measurement of muscle T2, fat-corrected T2 and fat fraction in the assessment of idiopathic inflammatory myopathies. Rheumatology 2016; 55: 441–9. doi: 10.1093/rheumatology/kev344 [DOI] [PMC free article] [PubMed] [Google Scholar]
- 21.Dalakas MC. Inflammatory muscle diseases. N Engl J Med 2015; 372: 1734–47. doi: 10.1056/NEJMra1402225 [DOI] [PubMed] [Google Scholar]
- 22.Verhaert D, Thavendiranathan P, Giri S, Mihai G, Rajagopalan S, Simonetti OP, et al. Direct T2 quantification of myocardial edema in acute ischemic injury. JACC Cardiovasc Imaging 2011; 4: 269–78. doi: 10.1016/j.jcmg.2010.09.023 [DOI] [PMC free article] [PubMed] [Google Scholar]
- 23.Alexanderson H, Lundberg IE, indicators D-specificquality. Outcome measures and guidelines in polymyositis and dermatomyositis. Clin Exp Rheumatol 2007; 25(suppl. 47): S153–S158. [PubMed] [Google Scholar]


