

Abstract
Modulated radiotherapy with multileaf collimators is widely used to improve target conformity and normal tissue sparing. This introduced an additional degree of complexity, studied by multiple teams through different properties. Three categories of complexity metrics were considered in this review: fluence, deliverability and accuracy metrics. The first part of this review is dedicated to the inventory of these complexity metrics. Different applications of these metrics emerged. Influencing the optimizer by integrating complexity metrics into the cost function has been little explored and requires more investigations. In modern treatment planning system, it remains confined to MUs or treatment time limitation. A large majority of studies calculated metrics only for analysis, without plan modification. The main application was to streamline the patient specific quality assurance workload, investigating the capability of complexity metrics to predict patient specific quality assurance results. Additionally complexity metrics were used to analyze behaviour of TPS optimizer, compare TPS, operators and plan properties, and perform multicentre audit. Their potential was also explored in the context of adaptive radiotherapy and automation planning. The second part of the review gives an overview of these studies based on the complexity metrics.
Introduction
Compared to conformational radiotherapy (CRT), intensity modulated radiotherapy (IMRT) and volumetric modulated arc therapy (VMAT) improve target volume conformity and normal tissue sparing, resulting in reduced acute and late toxicities.1–4 Considering conventional linear-accelerators (linacs), intensity modulation is achieved through different parameters, according to the technique used: multileaf collimator (MLC) position for step-and-shoot (or segmental) IMRT, MLC position and speed variation for sliding window (or dynamic) IMRT and additionally, gantry rotation speed and dose rate variation for VMAT. Due to the complexity of modulated plans, patient specific quality assurance (PSQA) is strongly recommended by various professional organizations.5–11 The complexity level of a modulated plan is variable according to patient anatomy, dosimetric constraints, optimization algorithm and linac capabilities.
In order to quantify this level of complexity, a wide range of complexity metrics have been proposed but, up to date, without consensus. Plan complexity is generally defined from machine parameters and plan properties (fluence, MLC aperture, position and displacement, gantry speed and dose rate variations, MU) to study correlations with the agreement between delivered and calculated dose distributions. The main idea is that this agreement is more difficult to achieve for a plan with a high level of complexity. Complexity metrics are then based on identified sources of errors in IMRT/VMAT delivery (MLC leaf position, gantry rotation, beam stability) and treatment planning system (TPS) calculation (MLC modelling, off-axis and irregular field modelling, output factors for small field sizes).5 According to these considerations, Crowe et al12 divided complexity metrics into three categories corresponding to different approaches:
The fluence metrics exclusively consider the resulting fluence of a modulated plan or beam. They aim to quantify the complexity without identifying the sources (machine and/or TPS). They can be applied to both IMRT and VMAT plans. The hypothesis is that a highly heterogeneous fluence reflects a high level of complexity, comparing with CRT homogeneous beams. However, a limitation of fluence map-based metrics is their insensitivity to the degeneracy of fluence map.13 Indeed, the same fluence map could be generated either by a single large beam or by a combination of successive small beams, leading to a similar fluence-based metric.
The deliverability metrics focus on machine capability of delivering the treatment as planned due to the variation of mechanical (gantry, MLC) and dosimetric (dose rate, MU) machine parameters. They are treated independently or combined. These metrics depends on the technique applied.
The accuracy metrics aim to quantify the parameters identified as most likely to compromise accurate dose calculation due to the machine modelling and algorithm inaccuracy in the TPS. In particular, the small distance between opposite leaves, the off-axis leaf aperture, the leaf leakage dose and the aperture irregularities are pointed out. Accuracy metrics focus on MLC only and consequently can be applied to both IMRT and VMAT. Deliverability and accuracy metrics are intrinsically linked and some metrics could belong to both categories. As an example, the small distance between opposite leaves is a challenging situation for both the machine and the dose calculation as well. In ambiguous case, the intention of the authors describing the metric was considered.
The aim of this paper is to provide a wide review of existing complexity metrics and their applications. As complexity metrics depend on technical considerations, only conventional linacs were considered in this review. In early studies, complexity metrics were mainly developed with the purpose of predicting the PSQA outcome. Some strategies were then proposed to streamline PSQA process, reducing workload. Furthermore, in order to adapt the plan complexity to the dosimetric requirement, correlation between complexity metrics and plan quality was investigated. In the same way, complexity metrics were used to compare TPSs, optimization algorithms and plan properties. Some studies aimed to estimate their utility for multicentre external audit and in the context of adaptive radiotherapy and automation planning.
The literature was searched in “PubMed” and “google scholar” search engines, using the following keywords and logic statements: (“VMAT” OR “IMRT”) AND (“complexity” OR “modulation”) AND (“metric” OR “index” OR “level” OR “degree”). The term “complexity metric” was chosen in this review.
Complexity metrics
Table 1 lists the main complexity metrics grouped into the three categories defined by Crowe et al12 and detailed in the introduction. Listed complexity metrics are described below.
Table 1. .
Main complexity metrics for IMRT and/or VMAT plans, divided into three categories12
| Category | Complexity metrics | Main reference |
| Fluence complexity | FMC - Fluence map complexity | Llacer et al14 |
| MI - modulation index | Webb15 | |
| 2D MI - 2D modulation index | Nicolini et al16 | |
| MIR - Maximum intensity ratio | Coselmon et al17 | |
| PIMV - Plan intensity map variation | ||
| Fractal dimension analysis methods: the variation, power spectrum and variogram methods | Nauta et al18 | |
| Textural features: ASM, IDM, contrast, variance, correlation and entropy | Park et al19,20 | |
| Deliverability | MU, MU/Gy or PMU - Monitor Unit, monitor unit per Gy or plan normalized monitor unit | Du et al,13 Mohan et al,21 Masi et al22 |
| PI - Plan averaged beam irregularity | Du et al13 | |
| PM - Plan averaged beam modulation | ||
| AAV - Aperture area variability | McNiven et al23 | |
| LSV - Leaf sequence variability | ||
| MCS - Modulation complexity score (combination of LSV and AAV) | ||
| DR - Variations of the nominal DR | Nicolini et al24 | |
| GS - Variation of gantry speed | ||
| Degree/MU - The gantry angle per MU | Miura et al22 | |
| mm/MU - Leaf travel per MU | ||
| MU/CP - Number of Monitor unit per Control Point and proportion of CP with MU <3 (%MU/CP <3) | Shen et al25 | |
| Sl-h - The average proportion of leaf speeds from a given range | Park et al26 | |
| Al-h - The average proportion of leaf accelerations from a given range | ||
| MIs - Modulation index for speed of MLC | Park et al27 | |
| MIa - Modulation index for speed and acceleration of MLC | ||
| MIt - Modulation index for speed and acceleration of MLC, gantry acceleration and dose rate variation | ||
| MCSv or MCSarc - Modulation complexity score for VMAT plans | Masi et al22 | |
| LT - Leaf travel | ||
| LTMCS - Combination of LT and MCSv | ||
| MISPORT – Modulation index for station parameter optimized radiation therapy | Li and Xing28 | |
| Accuracy | Average leaf gap | Nauta et al18 |
| MFA - Mean field area | Kairn et al29 Crowe et al30 |
|
| SAS - Small aperture score and SAS(x) | ||
| CLS - Closed leaf score | ||
| CAS - Cross-axis score | ||
| MAD - Mean asymmetry distance | ||
| SA/CP - Segment area per CP | Shen et al25 | |
| Modulation degree | Heijmen et al31 | |
| PA - Plan averaged beam area | Du et al13 | |
| Segment area/Perimeter or Circumference/area | Carlsson et al,32 Götstedt et al33 | |
| EM - Edge metric | Younge et al34,35 | |
| EAM - Edge area metric | Götstedt et al33 | |
| CAM - Converted aperture metric | ||
| LOIC - Leaf offset impact on calculation | Mathot et al,36 Dechambre et al37 | |
| Accuracy/Deliverability | MIc - Comprehensive modulation index | Park et al38 |
IMRT, intensity modulated radiotherapy; VMAT, volumetric modulated arc therapy.
Fluence metrics
IMRT/VMAT treatment planning with TPS generates fluence maps using optimizers. These fluence maps can be represented as two-dimensional (2D) matrices composed by beamlets (bixels) with different independent weights (intensities). The plan complexity can be assessed through metrics derived from these fluence maps, which serve as input to the leaf sequencer computing the time sequence of MLC settings.39
This type of metrics was initially introduced for IMRT plans. Llacer et al14 defined the Fluence Map Complexity metric (FMC). The FMC likened to a smoothness measure is a normalized root sum over the local differences between bixel values and their two neighbours. It is sensitive to differences between adjacent beamlet weights and the existence of excessive large beamlet weights in the field periphery in an otherwise relatively uniform beam map. The FMC focuses on local differences without relating the local changes to the overall fluence standard deviation. In this context, Webb15 proposed the Modulation Index (MI) that better relates the local changes to the global ones. Indeed, the MI quantifies the variations of photon fluence along one direction between neighbouring pixels in the fluence map including a threshold defined as a fraction of the standard deviation in the beam. The definition of MI has been later generalized to changes along x, y and diagonal directions by Nicolini et al16 and called 2D MI.
Coselmon et al17 introduced the Plan Intensity Map Variation (PIMV) metric quite similar to MI and FMC. The PIMV is the sum of the intensity difference for each beamlet at the (j,k) position with its neighbours at (j,k + 1), (j + 1,k) and (j + 1,k + 1) positions. In addition, Coselmon et al17 defined a second metric called maximum intensity ratio (MIR) which considers the maximum intensity allowed for each beamlet during the optimization process.
Later, Nauta et al18 suggested that IMRT fluence map complexity could be assessed by means of fractal dimensions analysis. For this purpose, three types of fractal dimension have been evaluated: the Variation method, the Power Spectrum method and the Variogram method. The Variogram method based on the statistical Gaussian modelling of images was preferred to assess the complexity because of its good independency of image size, its strict increase with the theoretical dimension of the fractal and its precision.
The first fluence map metric dedicated to VMAT technique was published by Park et al.19 This work consisted in analysing six second-order statistical textural features of fluence map derived from its grey level co-occurrence matrix generated for three bixel displacement distances (d = 1, 5 and 10). Co-occurrence matrices allowed the characterization of pattern repetitions. In Park’s study, the following textural features were calculated: angular second moment (ASM) as a measure of homogeneity; inverse different moment (IDM) as a measure of local homogeneity; contrast as a measure of local variations; variance as a measure of inhomogeneity; correlation as a measure of linear dependency of grey levels; and entropy as a measure of randomness.
A limitation of fluence map-based metrics is that the same fluence map could be generated either by a single large beam or by a combination of successive small beams.13 In order to overcome this pitfall, Park et al20 edge-enhanced fluence applying a feature analysis by doubling the pixel values representing MLC tips during the fluence map generation in order to prevent smearing out of small or irregular fields. Consequently, the edge-enhanced fluences showed a lot of short discrete lines perpendicular to the direction of MLC. Park et al20 improved the performance of contrast (d = 1) as a complexity metric for VMAT.
Deliverability metrics
To overcome the limitations of fluence metrics, deliverability metrics were introduced, in regards to mechanical and dosimetric features of the machine. The observation made by several authors that the machine capability of delivering treatments as planned decreased with increasing MLC complexity16,21,40–42 led to the creation of different MLC-based deliverability metrics. The plan complexity in terms of delivery can be assessed by multiple comprehensive metrics13 or single metric summarizing different properties.23 The advantage of these separated metrics is that they are easily interpreted due to their physical meaning.
Some machine parameters can be easily retrieved from a plan and used as deliverability metrics. One of them is the plan MUs, tending to increase with plan complexity.21 Du et al13 proposed to study the plan normalized MUs (PMU) defined as the plan MU normalized to a single fraction of 2 Gy, also used by Masi et al.22 Other authors introduced more complex metrics. For example, for each IMRT segment, Du et al13 calculated the aperture area (AA), the aperture perimeter (AP) and the aperture irregularity (AI) quantifying the non-circularity of the aperture. With these three metrics, they calculated the beam irregularity (BI) by weighting AA and AI with the MUs of each segment. The beam modulation (BM) is based on MU-weighted ratio between AA and the union area of all apertures. Corresponding plan metrics: plan averaged beam irregularity (PI) and plan averaged beam modulation (PM) were obtained by combining beam metrics weighted with the MUs per beam.
McNiven et al23 defined the modulation complexity score (MCS), which combines two parameters: the leaf sequence variability (LSV) and the aperture area variability (AAV). LSV and AAV are close to PI and PM defined by Du et al,13 since they evaluate the field irregularity comparing adjacent leaf positions and the field area variation from a maximum area, respectively. MCS was initially described for step and shoot IMRT and designed as a simple score ranging from 0 to 1, with 1 referring to a plan without modulation.
VMAT plans combine MLC modulation with gantry rotation speed and dose rate variation. Gantry rotation is discretized into control points (CP) equivalent to IMRT segments. Among machine parameters easily retrieved, other parameters of interest for VMAT delivery than those previously described for IMRT were the variations of the nominal dose rate (DR) and gantry speed (GS), as investigated by Nicolini et al.24 The gantry angle per MU (Degrees/MU) was proposed by Miura et al.43 Shen et al25 focused on the number of MU per CPs (MU/CP) since low MU/CP is potentially demanding in terms of MLC motion. They especially pointed out the proportion of CP with less than 3MU (%MU/CP <3).
Some studies41,42 showed that leaf speed is correlated with MLC performance for dynamic and VMAT deliveries since a decrease of leaf speed improves positional accuracy of the MLC. In addition to mean MLC speed and acceleration, Park et al26 proposed as complexity metric the average proportion of leaf speeds (Sl–h) and acceleration (Al–h) within a given range. A particular metric, MISPORT, was used by Li et al28 and represents the modulation of MLC around a given CP considering a certain range of adjacent CPs, weighted by the corresponding MU per gantry angle. Park et al27 proposed to evaluate MLC speed and acceleration, gantry acceleration and variation of dose rate by adapting the MI initially proposed by Webb15 from IMRT to VMAT. MIs evaluates MLC speed, MIa adds MLC acceleration and MIt (or MItotal) combines the four parameters. Another metric was adapted from IMRT to VMAT by Masi et al,22 the MCS renamed MCSv for VMAT. Additionally, on the basis of the work of Chen et al44 showing the dosimetric impact of leaf travel, they quantified the mean leaf travel (LT), considering leaf displacement of open leaf pairs. And they proposed a third metric named LTMCS combining LT and MCSv by multiplying MCSv with a normalized LT. Similarly, Miura et al43 considered the leaf travel per MU (mm/MU).
Accuracy metrics
This third category was defined to deal with challenging MLC configurations. Some accuracy metrics focus on the small field feature. The average leaf gap was evaluated as a simple metric by Nauta et al.18 Other simple metrics were introduced by Kairn et al29 and Crowe et al30 such as the mean field area (MFA) and the small aperture score (SAS). The MFA considers segment areas without making distinction between single and split fields into a given segment and between line-like and circular-like fields. The SAS(x) counts for the proportion of open leaf pairs separated by less than a given distance x. Similarly, the segment area per CP (SA/CP) and the percentage of CPs with segment area < 5×5 cm² (%SA < 5×5 cm²) were used by Shen et al.25 In the same way, Du et al13 calculated the plan averaged beam area (PA), by combining beam area (BA) weighted with the MUs per beam from aperture area (AA) of each segment. The Monaco TPS (Elekta AB, Stockholm, Sweden) calculates the modulation degree as the inverse of the sum over all segments of the segment area multiplied by the segment MU, weighted by the total beam MU and divided by the total beam area.31 This definition is very similar to MFA and, to our knowledge, Monaco is the only TPS providing an advanced complexity metric. The modulation degree is available during and after the optimization process.
Other metrics29,30 focus on the beam aperture position relatively to the isocenter such as the closed leaf score (CLS), the cross-axis score (CAS) and the mean asymmetry distance or mean aperture displacement (MAD). The CLS, CAS and MAD consider the proportion of closed leaf pairs within the jaw field, the proportion of open leaf pairs with a leaf crossing the central axis and the mean distance between the centre of open leaf pairs and the central axis, respectively.
Carlsson et al32 presented a simple mean to quantify the aperture complexity: the perimeter–area ratio of the MLC aperture, also named circumference/area ratio (C/A) by Götstedt et al.33 Younge et al34,35 considered this metric in a more complex formula with the definition of the edge metric (M or EM). The EM quantifies the ratio between the MLC aperture perimeter and area, considering different weights between leaf side-and leaf end distances constituting the perimeter. Götstedt et al33 also intended to improve the C/A by introducing the edge area metric (EAM). It is defined by the ratio between the area enclosing the field penumbra with 5 mm both sides of the MLC edge and the sum of this aforementioned area with the rest of MLC aperture area. Additionally, Göstedt et al33 defined the converted aperture metric (CAM). This third metric combines complexity scores with regard to the mean MLC edge distances along and across the leaf displacement direction and the equivalent square field size. Those two parameters are converted by a non-linear function to increase the penalty for small fields.
The metric introduced by Mathot et al36,37 aims to quantify the dosimetric impact of a MLC offset variation. Leaf offset impact on calculation (LOIC) was defined as the percentage variation of PTV mean dose with respect to a change in the leaf offset parameter of the machine model.
One of the complexity metric specifically designed to belong to both deliverability and accuracy metrics categories is the comprehensive modulation index MIc. Park et al38 defined it from a previously suggested one, the MIt,26 taking into account MLC speed and acceleration, gantry acceleration and dose rate variation as described in the deliverable metrics section. A weighting factor based on an aperture index (AI), WAI, was developed to account for dosimetric inaccuracies of some aperture sizes and geometries. This weighting factor is a monotonically increasing function depending on AI. AI determines the convergence speed of a function based on the line pixel quantification iteratively applied to binary images of MLC apertures after running a thinning algorithm well-known in image processing.
Among all the complexity metrics described above, some are highly correlated because they provide similar information and can therefore be considered equivalent.45
Applications
Use of complexity metric during the optimization process
To our knowledge, Younge et al34,35 and Li et al28 presented the only studies in which the complexity metric is used to improve the optimization process. Using the EM complexity metric, Younge et al34,35 introduced the penalization of the aperture complexity. Using the MISPORT complexity metric, Li et al28 introduced the concept of “demand metric” to adapt the angular sampling of VMAT arc and thus its level of complexity. In 2007, during the worldwide spread of intensity modulation in clinical routine, Craft et al46 demonstrated that the largely increased number of MUs observed in step-and-shoot IMRT was not mandatory in order to reach the expected plan quality. They included the number of MUs, as an objective in the optimization process and they showed that the number of MUs can sometimes be reduced more than twofold while maintaining a similar plan quality. In the same context Mohan et al21 demonstrated that complex anatomy and severe constraints lead to complex intensity patterns. They investigated the use of a filtration technique to reduce intensity map fluctuations and MUs in dynamic sliding window IMRT.
At the moment, most modern TPSs only offer the possibility to limit the treatment time and/or the number of MUs per beam/plan during VMAT optimization. This MU reduction correlates to an increase average size of MLC segments/CPs and thus might improve some metrics described in the previous section.
Optimization of the PSQA workload
A large majority of studies calculated metrics only for analysis, without plan modification. However, knowledge of the modulation level during or at the end of the optimization step allows to adapt the dosimetric objectives, to compare plans or TPS and to optimize the PSQA strategy. The primary focus reported in the literature is to predict PSQA results from complexity metrics, with the final purpose to reduce the QA workload.36,37,47
PSQA consists in individualized measurements either before the first fraction (without patient) and/or during treatment (in vivo)5–11 and is still considered as gold standard for treatment quality assessment, despite the workload. Assuming that agreement between calculations and measurements decreases as plan modulation increases, it should be possible to predict PSQA results from complexity metrics.
The first approach consists in finding correlation between PSQA results and complexity metrics. Table 2 lists the main published correlation studies which failed to reach a consensus. Correlation is strongly impacted by many parameters: (1) detector, (2) analysis method and criteria and (3) linac, treatment technique, TPS and beam modelling.55 Such correlations are reduced by the spread out of PSQA results from highly modulated plans (Figure 1), which are more sensitive to the linac state at the time of measurement.
Table 2. .
Main correlations studies between complexity metrics and PSQA results.
| Ref | Technique (localization) | QA system | Analysis | Evaluated metrics | Correlation coefficients |
| Crowe et al12 | 52 ss-IMRT plans (multisite) | EPID with Epiqa system (EPIdos) | γ 3%/3 mm and 2%/2 mm | MU, AAV, CAS, MAD, MCS, MI, SAS1, SAS5 and SAS10 | Significant (F) |
| MFA, CLS and FMC | Not significant (F) | ||||
| Crowe et al12 | 70 VMAT plans (multisite) | EPID with Epiqa system (EPIdos) | γ 3%/3 mm and 2%/2 mm | MAD, MCS, MI and SAS1 | Significant (F) |
| MU, MFA, AAV, CLS, CAS, FMC, SAS5 and SAS10 | Not significant (F) | ||||
| Du et al13 | 65 ss-IMRT plans (prostate, head and neck, and spine) and 26 VMAT plans (prostate) | Ion chamber and radiographic films | Dose difference and γ 5%/3 mm | PA, PI, PM and PMU | None (s) |
| Park et al20 | 40 VMAT plans (20 prostate, 20 h&N) | MapCheck (Sun Nuclear) | γ local and global 2%/2 mm | Contrast1,5,10, ASM1, IDM1,5, Variance1,5, correlation5,10 | Moderate (s) |
| ADM5, IDM10, Variance10, correlation1, Entropy1,5,10 | Weak (s) | ||||
| ASM10 | None (s) | ||||
| McNiven et al23 | 243 IMRT plans (multisite) | MapCheck (Sun Nuclear) | γ local 3%/3 mm and 2%/2 mm | MCS and MU | None (NA) |
| Masi et al22 | 142 VMAT plans (multisite) | Delta4 phantom (Scandidos) | γ local 3%/3 mm and 2%/2 mm | LT, MCSv and LTMCS | Moderate (p) |
| PMU | Weak (p) | ||||
| Shen et al25 | 71 VMAT (nasopharyngeal cancer) | ArcCheck (Sun Nuclear) | γ Individual volume-based 3D | MU/CP, SA/CP | Significant (c) |
| %MU/CP < 3, %SA < 5×5, MCSv/arc and LT | Not significant (c) | ||||
| Park et al26 | 40 VMAT plans (20 prostate, 20 h&N) | MapCheck (Sun Nuclear) | γ global and local 1%/2 mm | Mean MLC speeds and mean MLC accelerations | Weak and moderate (s) |
| Park et al27 | 40 VMAT plans (20 prostate, 20 h&N) | MapCheck (Sun Nuclear) | γ local 2%/2 mm | MIs, Mia and MIt | Moderate (s) |
| MIsport | Weak (s) | ||||
| LTMCS | None (s) | ||||
| Crowe et al30 | 122 ss-IMRT beams (prostate) | MapCheck (Sun Nuclear) | γ 3%/3 mm and 2%/2 mm | MI, MFA, SAS5 and SAS10 | Significant (F) |
| MCS, LSV, AAV, FMC, CLS, CAS, MAD, SAS2 and SAS20 | Not significant (F) | ||||
| Gödtstedt et al33 | 30 Artificial IMRT /VMAT beams | EPID | Dose difference pass rate (3 and 5%) |
CAM, EAM, EM, Circumference/area and MU/Gy | Strong (p) |
| Aperture area | Moderate (p) | ||||
| MCS and Aperture irregularity | Weak (p) | ||||
| Gödtstedt et al33 | 30 Artificial IMRT /VMAT beams | Rradiochromic films | Dose difference pass rate (3 and 5%) |
CAM, EAM, EM, Circumference/area and MU/Gy | Strong (p) |
| MCS and Aperture irregularity | Moderate (p) | ||||
| Aperture area | Weak (p) | ||||
| Dechambre et al37 | 93 VMAT plans (multisite) | ArcCheck (Sun Nuclear) | γ global 3%/3 mm and 2%/2 mm | LOIC, CAS and MCSv SAS and PMU MFA, MAD and CLS |
Moderate (p) Weak (p) None (p) |
| Park et al38 | 52 VMAT plans (22 prostate, 30 h&N - two institutions) | MapCheck (Sun Nuclear) | γ local 2%/2 mm |
MIt, MIc and MIsport MIc, LTMCS, variance, PI and PM MCSv, contrast, contrastedge and PA PMU |
Strong (s) Moderate (s) Weak (s) None (s) |
| Agnew et al48 | 30 VMAT (prostate, prostate and pelvic node, H&N) | OCTAVIUS 4D and 729 array (PTW) | γ global 2%/2 mm | MCSv | Moderate (p) |
| MU | None (p) | ||||
| Glenn et al49 | 343 IMRT/ VMAT plans (H&N - 312 institutions) | TLD and Radiochromic films | Dose difference (5%) and γ 7%, 4 mm | MU, MCS, EM, PI, PM, MIs, MIa, MIt, LT, Mean DR variation, Mean GS var. Mean MLC speed var. | None (s) |
| Jurado-Bruggeman et al50 | 36 VMAT plans (2 prostate and 2 h&N done by nine institutions) | ArcCheck (Sun Nuclear) | γ global 3%/3 mm and 2%/2 mm | MU | Strong (p) |
| PI, MCSv, MIt | None (p) | ||||
| McGarry et al51 | 39 VMAT plans (virtual volumes - 34 institutions) | OCTAVIUS II and 729 array (PTW) | γ global and local 1%/2 mm | MCSv and MU | Weak (p) but Moderate (p) for Varian linacs |
| Park et al52 | 202 IMRT plans (multisite) | ArcCheck and MapCheck (Sun Nuclear) | γ global 2%/2 mm | PI and MCS | Moderate (s) |
| MIs, PA and PM | None (s) | ||||
| Wang et al53 | 20 IMRT plans (10 nasopharyngeal cancer and 10 prostate) with intentional MLC leaf errors | ArcCheck (Sun Nuclear) | γ 2%/2 mm | MCS | Strong (s) |
| Park et al54 | 240 VMAT plans (multisite) | ArcCheck (Sun Nuclear) | γ local 2%/2 mm | MIt, MIc, LTMCS, MIsport, PI and PM MCSv and PMU PA |
Moderate (s) Weak (s) None (s) |
IMRT, intensity modulated radiotherapy; MCS, modulation complexity score; MI, Modulation Index; PSQA, patient specific quality assurance; TPS, treatment planning system; VMAT, volumetric modulated arc therapy.
Statistical analysis methodologies used are Spearman (s), Pearson (p), Canonical (c) orF-test (F). Correlation for Spearman and Pearson coefficients were considered as strong r ≥ 0.7,moderate for 0.5 ≤ r<0.7,weak for 0.4 ≤ r<0.5 and none for r < 0.4. All presented data are associated with a p-value ≤0.05. According to these definitions, complexity metrics with a significant (Canonical and F-test) or a strong (Spearman and Pearson tests) correlation with PSQA results are in bold. If none is specified, only one institution is involved in the study.
Figure 1. .
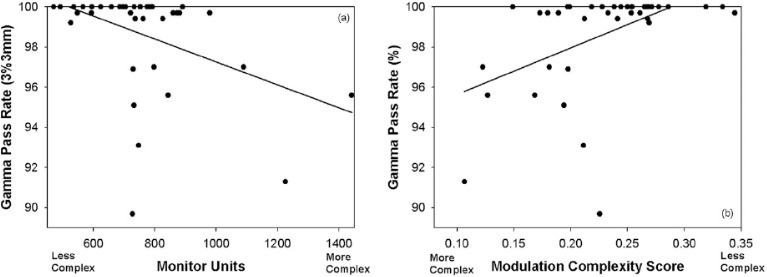
Typical aspect of correlation plots for two complexity metrics (MU and MCS) and PSQA results. An important spread out appears for plans with large MU (>700) and low MCS (<0.23) corresponding to high modulation level. Figure comes from McGarry et al.51 MCS, modulation complexity score; PSQA, patient specific quality assurance.
PSQA measurements are performed within phantoms with different geometry and material characteristics, using a wide variety of detectors which might be prone to calibration, response or setup errors.5,55,56 Characteristics of detectors such as spatial resolution,57 rotational dependence, water equivalency and uncertainties58 affect PSQA measurements. In addition, authors used various analysis methods impacting PSQA outcome.5,55,56,59 Most publications12,13,18,20,22,23,25–27,30,38,48–53,60,61 characterized measurements by means of γ index passing rates (GPR)62 but some used dose difference from point measurements13,49 or dose difference pass rate.33 Moreover, when GPR was used, options and criteria widely varied between studies. For example, Rajasekaran et al61 obtained very different correlation coefficient according to γ analysis option and criteria, preventing any conclusion. Furthermore, the γ index might be prone to misleading interpretation.63–66 The well-known γ index remains the most widely used by the medical physics community.
In the same way, TPS configuration and beam modelling influence the agreement between calculated and measured doses. For example, Masi et al22 demonstrated the impact of CP spacing in TPS on PSQA results, and consequently on correlation with complexity metrics.
A second approach consists in evaluating the capability of complexity metrics to identify plans requiring no PSQA. This can be driven by means of receiver operating characteristic (ROC) analysis. ROC curves are generated for a specified complexity metric by varying the metric threshold and plotting the true positive rate (TPR, also known as “sensitivity”) vs the false positive rate (FPR, equal to “1 – specificity”). The purpose is to determine an appropriate complexity threshold above which a plan should be considered for either re-optimization (high specificity) or exemption from QA measurements (very high sensitivity, or even 100% sensitivity).36,47 ROC area under the curve (AUC) quantifies the ability of the metric to distinguish between positive and negative cases, respectively. Nauta et al18 classified AUC ranging from 0.5 (chance accuracy) to 1.0 (perfect accuracy), with the following intermediate benchmarks: 0.6 (poor), 0.7 (fair), 0.8 (good), 0.9 (excellent), >0.95 (almost perfect). Park et al27 performed ROC analysis with a 90% tolerance level for the GPR (local 2%/2 mm) and obtained the best performance in terms of sensitivity and specificity (AUC = 0.849) for the MIs (f = 2) metric, while the MCSv metric showed the poorest performance (AUC = 0.527). Using the edge metric (EM), Younge et al35 obtained a 44% sensitivity (meaning only 44% of plans failing PSQA were correctly flagged) and 93% specificity (7% of plans passing PSQA incorrectly flagged). Enforcing no false positive (specificity 100%), Mc Niven et al23 improved the sensitivity up to 36% using the MCS metric, as compared to 23% using the normalized number of MU.
The latest approach recently developed in the literature is the use of machine learning67 to predict PSQA results. We can discern two strategies: technique designed by domain experts and deep neural networks without domain knowledge. The model developed by Valdes et al60,68 belongs to the first category since input data were a large set of complexity metrics. Output data were local GPR 3%/3 mm measured with a 2D diode array. The resulting model predicted GPR with an error smaller than 3%. Moreover, a model analysis showed that metrics with major impact were MU/Gy,22 PI13 and SAS(10 mm).29,30 The model was applied to a second institution that uses EPID measurements.68 GPR were predicted within 3.5% for 120 out of 139 plans. Iterian et al69 compared results obtained by Valdes et al60,68 with a deep learning convolutional neural network (CNN) strategy. Fluence maps calculated for each plan were used as inputs to the CNN. Predictions from CNN were comparable to a system designed by physicist experts. Tomori et al70 proposed for prostate plans, a CNN model based on following input data: the sagittal planar dose distribution calculated in a phantom, the volumes of the PTV, the rectum and their overlapping, and the MU for each beam. They found a moderate Spearman correlation between measured and predicted GPR values.
In the context of online adaptive radiotherapy, PSQA of adapted plans is not feasible. Complexity metrics can then be used as online and fast verification of the adapted plans. Crijns et al71 referred to five established plan metrics (number of MU, equivalent field size, MCS and the components of MCS, i.e. AAV et LSV) in order to validate adapted prostate VMAT plans in response to anatomical variations. They used a sophisticated forward planning approach correcting MLC apertures and MU for each CP, and compared the adapted plan to the original one by means of the abovementioned plan metrics. This method is much faster than replanning, allowing for online plan adaptation. In this context, MCS was not retained due to the contrasting behaviour of the AAV and LSV components. For the remaining four complexity metrics, a population model was built to derive tolerance tables. Adapted plans with complexity metrics within the tolerance were validated and delivered, without additional PSQA.
Correlation with plan quality
In parallel with correlations between plan complexity metrics and PSQA, the question arises whether these metrics are related to plan quality, i.e. the degree of achievement of planning objectives (mainly target coverage, dose homogeneity, dose conformity, dose fall-off and doses to organs at risk). In this context we should keep in mind that, on one hand, “a high degree of complexity is not necessarily a negative feature of a treatment plan, as it may be required due to the geometry and location of the target and organs at risk,”23 on the other hand “more complex plans do not necessarily produce better dose distributions.”45,46,72 In order to compare treatment plans, Jurado-Bruggeman et al50 defined a plan quality index (PQI), which is a weighted sum of the score for a planning objective sets. They did not obtain a correlation between plan quality, plan complexity, and γ scores in a multicentre environment. In a multiinstitutional dosimetry audit for VMAT Mc Garry et al51 defined the plan quality metric (PQM) as a percentage of achievement for a specified planning constraint. They did not observe a correlation between PQMs and MCS, while PQM was significantly correlated with MU for planning systems independent of linac manufacturers. Using a multidimensional exploratory statistical method Shen et al25 showed that some complexity parameters of 71 VMAT nasopharyngeal cancer patient plans (i.e. SurfaceArea/CP and percentage of CPs with SA < 5×5 cm2) were highly weighted in correlation with plan quality.
The results of these publications tend to show weak correlation (if not absent) between plan quality and plan complexity. This could be related to the established fact that complexity often results from unrealistic or conflicting optimization goals35 and the increasing number of optimization iterations and/or successive optimizations during the inverse planning process,13 while similar plan quality might be achieved with less modulated or narrow beams. This highlights the need for dedicated complexity metrics to reach an acceptable trade-off between plan quality (with respect to the achievement of planning objectives) and plan complexity for a number of rival plans, as mentioned by Masi et al.22
Comparison of TPSs, operators or plan properties
Complexity metrics can be used to compare the optimization results from different TPSs (differences in optimizers) or operators (use of the TPS). In a multicentre comparison, Jurado-Bruggeman et al50 pointed out differences in value for three complexity metrics (BI, MCS and MIt) depending on the TPS manufacturer or the operator and demonstrated differences in terms of MLC, gantry speed and dose rate modulation management. Another comparison study51 based on complexity metrics divided TPS into two groups: those designed by the manufacturer for their own linac and those independently developed. This study recommended the use of a TPS and a linac from the same manufacturer. Llacer et al14 used the FMC, among other tools, to compare the behaviour of five different algorithms in inverse radiation therapy planning. The level of the FMC was linked to different complexity aspects on dose distribution such as the amount of very high beam weights in the periphery of some fluence maps. Hernandez et al45 compared three different TPSs with the help of many complexity metrics (MCS, EM, LT, PI, PM, MIt). The range of complexity metrics for each TPS revealed significant differences between algorithms. Complexity metrics can also be used in the context of TPS change (or TPS version upgrade). Edouard et al73 used the MCSv index in their evaluation of VMAT dosimetric practice changes when passing from Eclipse to RayStation. In the same way, complexity metrics were used in combination with plan quality metrics to evaluate a new optimizer and the impact of the optimization parameters.74–76 The knowledge of the modulation level can be a valuable tool to improve plan properties. For example, based on MCSv and plan quality metrics, Li et al77 found the optimal collimator angle (45°) for hypofractionated VMAT prostate treatment. Similar approach was used to compare different treatment techniques: classic vs HyperArc VMAT78 or IMRT vs VMAT.79 Additionally, Kantz et al76 assessed the impact of various MLC type on the modulation degree. Russo et al80 investigated if the cardiac-sparing benefit of the deep inspiration breath-hold (DIBH) technique for left breast VMAT treatment is achieved with lower plan complexity than free breathing (FB) technique. Based on various known complexity metrics (MUs, LT, EM, PI, MCSv and MIt), they obtained a slightly lower degree of plan complexity for DIBH-VMAT plans.
Within the last few years, automation algorithms were developed to streamline and standardize the treatment planning process.81 Among the large number of studies which compare manual and automated plans, some included complexity metrics.31,82,83
Multicentre external audit
As described above, complexity metrics provide essential information on optimization process and plan properties and can be related to PSQA outcome. Consequently, they could play a role in external audits.51 Such audits aim to verify TPS modelling and treatment delivery, credentialing institution for accurate clinical implementation. Comparison is generally based on the same clinical data and dosimetric constraints. Among the studies listed in Table 2, three were carried out in the context of a multicentre external audit,49–51 involving different linacs, treatment techniques, TPSs and beam modelling. These three studies attempted to detect correlations between complexity metrics and PSQA results and/or plan quality with variable success as discussed above. The study of Glenn et al,49 which included 312 different institutions with various linacs, techniques and TPSs, provided no correlation. By comparison, the two other studies50,51 involving a limited number of institutions obtained strong (considering 9 institutions) or moderate (considering 34 institutions) correlations. Furthermore, the correlation between the γ index passing rates and the complexity metrics might have been affected by the use of TLD presenting higher calibration and measurement uncertainties and thus requiring larger γ criteria (7% in dose and 4 mm distance-to-agreement). These higher γ tolerances had negative impact on correlations with complexity metrics since many highly modulated plans might have passed γ criteria, leading to an artificially high number of false positive plans and incidentally to weak correlations (low ROC AUC).
However, complexity metrics comparison between audited centres provided additional information. For example, in the audit of the Catalan Society of Medical Physicists,50 complexity metrics underlined the different strategies of modulation employed by linacs and TPSs. On the basis of a UK national audit for VMAT,84 McGarry et al51 highlighted the capability of complexity metrics, combined with plan quality metrics and TPS modelling parameters, to track excessive level of complexity. Thus, these strategies can lead to an improvement in planning methodologies and a full characterization of each TPS/linacs system.
Conclusion
A large number of complexity metrics is reported in the literature for IMRT and VMAT treatments. An informed choice has to be made between metrics enclosing the same source of complexity. Also studying correlations between complexity metrics is advised.
Correlation between complexity metrics and PSQA results is evaluated but strongly impacted by both dose measurement and dose calculation. For instance, measurement and modelling of small fields/segments are often inaccurate due to the need for dedicated measurement equipment and correction considerations and the chosen compromise during the TPS modelling. Consequently, both measurement and calculation of a plan with a lot of small segments could be affected. This is thus biasing the correlation analysis since the PSQA equipment is not supposed to add a complexity. Also machine state at the time of PSQA measurement has to be considered to be part of the analysis since it influences the PSQA results independently of the machine capabilities in a normal state. All of this explains the lack of consensus in the literature to highlight one particular metric among all the proposed definitions. Additionally, a given complexity metric is not showing the same correlation strength depending on studies, making any guidelines challenging. One of the most important guidelines is that the relationship between complexity metrics and PSQA results should be specifically established by each centre depending on PSQA process/material, machine settings and TPS modelling/optimizer. Moreover, ROC curve analysis is recommended for such studies as it can determine threshold values beyond which satisfying PSQA results are systematically achieved, although correlations are weakened by false negative. Automatically generated ROC curves based on centre specific PSQA results and well-chosen plan metrics might be an important step towards an experience-driven allocation of human and technical resources within medical physics departments.
PSQA workload optimization becomes crucial in a context of online adaptive radiotherapy since measurements are not possible. Complexity metrics, easily and almost instantly calculable, can be a way to overcome this issue.
Furthermore, complexity metrics allow interesting comparison between treatment technics, linacs, TPS and operators. In association with plan quality metric, they have demonstrated their usefulness to rationalize and standardize optimization process and their role in multicentre audits. With the recent development of automated planning approaches, such tools become essential for controlling the TPS. However, to our knowledge, only one TPS provides an advanced complexity metric. Moreover, the integration of complexity metrics into the cost function remains confined to MUs or treatment time limitations.
For future developments, one can imagine the wide implementation of complexity metrics into TPSs, their automated analysis and their use as a feedback to the system in an inverse optimization control loop.
Contributor Information
Sophie Chiavassa, Email: Sophie.Chiavassa@ico.unicancer.fr.
Igor Bessieres, Email: igor.bessieres@gmail.com.
Magali Edouard, Email: MAGALI.EDOUARD@gustaveroussy.fr.
Michel Mathot, Email: mmathot@chuliege.be.
Alexandra Moignier, Email: Alexandra.Moignier@ico.unicancer.fr.
REFERENCES
- 1.Nutting C, Dearnaley DP, Webb S. Intensity modulated radiation therapy: a clinical review. Br J Radiol 2000; 73: 459–69. doi: 10.1259/bjr.73.869.10884741 [DOI] [PubMed] [Google Scholar]
- 2.Webb S. The physical basis of IMRT and inverse planning. Br J Radiol 2003; 76: 678–89. doi: 10.1259/bjr/65676879 [DOI] [PubMed] [Google Scholar]
- 3.Teoh M, Clark CH, Wood K, Whitaker S, Nisbet A. Volumetric modulated Arc therapy: a review of current literature and clinical use in practice. Br J Radiol 2011; 84: 967–96. doi: 10.1259/bjr/22373346 [DOI] [PMC free article] [PubMed] [Google Scholar]
- 4.Yu CX, Tang G. Intensity-Modulated Arc therapy: principles, technologies and clinical implementation. Phys Med Biol 2011; 56: R31–R54. doi: 10.1088/0031-9155/56/5/R01 [DOI] [PubMed] [Google Scholar]
- 5.Miften M, Olch A, Mihailidis D, Moran J, Pawlicki T, Molineu A, et al. Tolerance limits and methodologies for IMRT measurement-based verification QA: Recommendations of AAPM Task Group No. 218. Med Phys 2018; 45: e53–83. doi: 10.1002/mp.12810 [DOI] [PubMed] [Google Scholar]
- 6.Ezzell GA, Burmeister JW, Dogan N, et al. Imrt commissioning: multiple institution planning and dosimetry comparisons, a report from AAPM task group 119: report from AAPM task group 119: IMRT commissioning. Med Phys 2009; 36: 5359–73. [DOI] [PubMed] [Google Scholar]
- 7.Moran JM, Dempsey M, Eisbruch A, Fraass BA, Galvin JM, Ibbott GS, et al. Safety considerations for IMRT: Executive summary. Pract Radiat Oncol 2011; 1: 190–5. doi: 10.1016/j.prro.2011.04.008 [DOI] [PMC free article] [PubMed] [Google Scholar]
- 8.Hartford AC, Galvin JM, Beyer DC, Eichler TJ, Ibbott GS, Kavanagh B, et al. American College of radiology (ACR) and American Society for radiation oncology (ASTRO) practice guideline for intensity-modulated radiation therapy (IMRT. Am J Clin Oncol 2012; 35: 612–7. doi: 10.1097/COC.0b013e31826e0515 [DOI] [PubMed] [Google Scholar]
- 9. Code of practice for the quality assurance and control for intensity modulated radiotherapy Report No.: .: 22 of the Netherlands Commission on Radiation Dosimetry. 2013.
- 10. Code of practice for the quality assurance and control for volumetric modulated Arc therapy Report No.: .: 24 of the Netherlands Commission on Radiation Dosimetry. 2015. [DOI] [PubMed]
- 11.Seravalli E, Van Battum L, Van Gellekom M.et al. NCS Report 28: National Audit of Quality Assurance for Intensity Modulated Radiotherapy and Volumetric Modulated Arc Therapy. Delft: The British Institute of Radiology.; 2018. [Google Scholar]
- 12.Crowe SB, Kairn T, Middlebrook N, Sutherland B, Hill B, Kenny J, et al. Examination of the properties of IMRT and VMAT beams and evaluation against pre-treatment quality assurance results. Phys Med Biol 2015; 60: 2587–601. doi: 10.1088/0031-9155/60/6/2587 [DOI] [PubMed] [Google Scholar]
- 13.Du W, Cho SH, Zhang X, Hoffman KE, Kudchadker RJ. Quantification of beam complexity in intensity-modulated radiation therapy treatment plans. Med Phys 2014; 41: 021716. doi: 10.1118/1.4861821 [DOI] [PubMed] [Google Scholar]
- 14.Llacer J, Solberg TD, Promberger C. Comparative behaviour of the dynamically penalized likelihood algorithm in inverse radiation therapy planning. Phys Med Biol 2001; 46: 2637–63. doi: 10.1088/0031-9155/46/10/309 [DOI] [PubMed] [Google Scholar]
- 15.Webb S. Use of a quantitative index of beam modulation to characterize dose conformality: illustration by a comparison of full beamlet IMRT, few-segment IMRT (fsIMRT) and conformal unmodulated radiotherapy. Phys Med Biol 2003; 48: 2051–62. doi: 10.1088/0031-9155/48/14/301 [DOI] [PubMed] [Google Scholar]
- 16.Nicolini G, Antonella F, Eugenio V, Alessandro C, Filippo A, Luca C. What is an acceptably smoothed fluence? Dosimetric and delivery considerations for dynamic sliding window IMRT. Radiat Oncol 2007; 2: 42. doi: 10.1186/1748-717X-2-42 [DOI] [PMC free article] [PubMed] [Google Scholar]
- 17.Coselmon MM, Moran JM, Radawski JD, Fraass BA. Improving IMRT delivery efficiency using intensity limits during inverse planning: intensity limits for IMRT inverse planning. Med Phys 2005; 32: 1234–45. [DOI] [PubMed] [Google Scholar]
- 18.Nauta M, Villarreal-Barajas JE, Tambasco M. Fractal analysis for assessing the level of modulation of IMRT fields. Med Phys 2011; 38: 5385–93. doi: 10.1118/1.3633912 [DOI] [PubMed] [Google Scholar]
- 19.Park S-Y, Kim IH, S-J Y, Carlson J, Park JM. Texture analysis on the fluence map to evaluate the degree of modulation for volumetric modulated Arc therapy: texture analysis to evaluate modulation degree of VMAT. Med Phys 2014; 41: 111718. [DOI] [PubMed] [Google Scholar]
- 20.Park S-Y, Park JM, Sung W, Kim IH, Ye S-J. Texture analysis on the edge-enhanced fluence of VMAT. Radiat Oncol 2015; 10. doi: 10.1186/s13014-015-0382-z [DOI] [PMC free article] [PubMed] [Google Scholar]
- 21.Mohan R, Arnfield M, Tong S, Wu Q, Siebers J. The impact of fluctuations in intensity patterns on the number of monitor units and the quality and accuracy of intensity modulated radiotherapy. Med Phys 2000; 27: 1226–37. doi: 10.1118/1.599000 [DOI] [PubMed] [Google Scholar]
- 22.Masi L, Doro R, Favuzza V, Cipressi S, Livi L. Impact of plan parameters on the dosimetric accuracy of volumetric modulated Arc therapy: plan parameters and VMAT dosimetric accuracy. Med Phys 2013; 40: 071718. [DOI] [PubMed] [Google Scholar]
- 23.McNiven AL, Sharpe MB, Purdie TG. A new metric for assessing IMRT modulation complexity and plan deliverability: new metric for assessing IMRT complexity and deliverability. Med Phys 2010; 37: 505–15. [DOI] [PubMed] [Google Scholar]
- 24.Nicolini G, Clivio A, Cozzi L, Fogliata A, Vanetti E. On the impact of dose rate variation upon RapidArc implementation of volumetric modulated are therapy. Med Phys 2011; 38: 264–71. doi: 10.1118/1.3528214 [DOI] [PubMed] [Google Scholar]
- 25.Shen L, Chen S, Zhu X, Han C, Zheng X, Deng Z, et al. Multidimensional correlation among plan complexity, quality and deliverability parameters for volumetric-modulated Arc therapy using canonical correlation analysis. J Radiat Res 2018; 59: 207–15. doi: 10.1093/jrr/rrx100 [DOI] [PMC free article] [PubMed] [Google Scholar]
- 26.Park JM, Wu H-G, Kim JH, Carlson JNK, Kim K. The effect of Mlc speed and acceleration on the plan delivery accuracy of VMAT. Br J Radiol 2015; 88: 20140698. doi: 10.1259/bjr.20140698 [DOI] [PMC free article] [PubMed] [Google Scholar]
- 27.Park JM, Park S-Y, Kim H, Kim JH, Carlson J, Ye S-J. Modulation indices for volumetric modulated Arc therapy. Phys Med Biol 2014; 59: 7315–40. doi: 10.1088/0031-9155/59/23/7315 [DOI] [PubMed] [Google Scholar]
- 28.Li R, Xing L. An adaptive planning strategy for station parameter optimized radiation therapy (sport): segmentally boosted VMAT. Med Phys 2013; 40: 050701. doi: 10.1118/1.4802748 [DOI] [PMC free article] [PubMed] [Google Scholar]
- 29.Kairn T, Crowe SB, Kenny J, Knight RT, Trapp JV. Predicting the likelihood of QA failure using treatment plan accuracy metrics. Journal of Physics: Conference Series 2014; 489: 012051. doi: 10.1088/1742-6596/489/1/012051 [DOI] [Google Scholar]
- 30.Crowe SB, Kairn T, Kenny J, Knight RT, Hill B, Langton CM, et al. Treatment plan complexity metrics for predicting IMRT pre-treatment quality assurance results. Australas Phys Eng Sci Med 2014; 37: 475–82. doi: 10.1007/s13246-014-0274-9 [DOI] [PubMed] [Google Scholar]
- 31.Heijmen B, Voet P, Fransen D, Penninkhof J, Milder M, Akhiat H, et al. Fully automated, multi-criterial planning for Volumetric Modulated Arc Therapy - An international multi-center validation for prostate cancer. Radiother Oncol 2018; 128: 343–8. doi: 10.1016/j.radonc.2018.06.023 [DOI] [PubMed] [Google Scholar]
- 32.Carlsson F. Combining segment generation with direct step-and-shoot optimization in intensity-modulated radiation therapy: combining segment generation with direct step-and-shoot optimization. Med Phys 2008; 35: 3828–38. [DOI] [PubMed] [Google Scholar]
- 33.Götstedt J, Karlsson Hauer A, Bäck A. Development and evaluation of aperture-based complexity metrics using film and EpiD measurements of static MLC openings: development and evaluation of aperture-based complexity metrics. Med Phys 2015; 42: 3911–21. [DOI] [PubMed] [Google Scholar]
- 34.Younge KC, Matuszak MM, Moran JM, McShan DL, Fraass BA, Roberts DA. Penalization of aperture complexity in inversely planned volumetric modulated Arc therapy: Penalization of aperture complexity in inversely planned VMAT. Med Phys 2012; 39: 7160–70. [DOI] [PMC free article] [PubMed] [Google Scholar]
- 35.Younge KC, Roberts D, Janes LA, Anderson C, Moran JM, Matuszak MM. Predicting deliverability of volumetric-modulated Arc therapy (VMAT) plans using aperture complexity analysis. J Appl Clin Med Phys 2016; 17: 124–31. doi: 10.1120/jacmp.v17i4.6241 [DOI] [PMC free article] [PubMed] [Google Scholar]
- 36.Mathot M, Dechambre D. 6 VMAT complexity metrics can reduce patient QA workload. Physica Medica 2018; 56(s1): 3–4. doi: 10.1016/j.ejmp.2018.09.019 [DOI] [Google Scholar]
- 37.Dechambre D, Baart V, Mathot M. OC-0612: dedicated VMAT complexity metrics reduce patient QA workload. Radiotherapy and Oncology 2018; 127: S323. doi: 10.1016/S0167-8140(18)30922-8 [DOI] [Google Scholar]
- 38.Park JM, Park S-Y, Kim H. Modulation index for VMAT considering both mechanical and dose calculation uncertainties. Phys Med Biol 2015; 60: 7101–25. doi: 10.1088/0031-9155/60/18/7101 [DOI] [PubMed] [Google Scholar]
- 39.Xing L, Li JG. Computer verification of fluence map for intensity modulated radiation therapy. Med Phys 2000; 27: 2084–92. doi: 10.1118/1.1289374 [DOI] [PubMed] [Google Scholar]
- 40.LoSasso T, Chui CS, Ling CC. Physical and dosimetric aspects of a multileaf collimation system used in the dynamic mode for implementing intensity modulated radiotherapy. Med Phys 1998; 25: 1919–27. doi: 10.1118/1.598381 [DOI] [PubMed] [Google Scholar]
- 41.Agnew A, Agnew CE, Grattan MWD, Hounsell AR, McGarry CK. Monitoring daily MLC positional errors using trajectory log files and EpiD measurements for IMRT and VMAT deliveries. Phys Med Biol 2014; 59: N49–N63. doi: 10.1088/0031-9155/59/9/N49 [DOI] [PubMed] [Google Scholar]
- 42.Kerns JR, Childress N, Kry SF. A multi-institution evaluation of Mlc log files and performance in IMRT delivery. Radiat Oncol 2014; 9: 176. doi: 10.1186/1748-717X-9-176 [DOI] [PMC free article] [PubMed] [Google Scholar]
- 43.Miura H, Tanooka M, Fujiwara M, Takada Y, Doi H, Odawara S, et al. Predicting delivery error using a DICOM-RT plan for volumetric modulated Arc therapy. Int J Med Phys Clin Eng Radiat Oncol 2014; 03: 82–7. doi: 10.4236/ijmpcero.2014.32013 [DOI] [Google Scholar]
- 44.Chen F, Rao M, Ye J-song, Shepard DM, Cao D. Impact of leaf motion constraints on IMAT plan quality, deliver accuracy, and efficiency. Med Phys 2011; 38: 6106–18. doi: 10.1118/1.3651698 [DOI] [PubMed] [Google Scholar]
- 45.Hernandez V, Saez J, Pasler M, Jurado-Bruggeman D, Jornet N. Comparison of complexity metrics for multi-institutional evaluations of treatment plans in radiotherapy. Physics and Imaging in Radiation Oncology 2018; 5: 37–43. doi: 10.1016/j.phro.2018.02.002 [DOI] [PMC free article] [PubMed] [Google Scholar]
- 46.Craft D, Süss P, Bortfeld T. The tradeoff between treatment plan quality and required number of monitor units in intensity-modulated radiotherapy. Int J Radiat Oncol Biol Phys 2007; 67: 1596–605. doi: 10.1016/j.ijrobp.2006.11.034 [DOI] [PubMed] [Google Scholar]
- 47.Benedek H, Isacsson U, Olevik-Dunder M, Westermark M, Hållström P, Olofsson J, et al. Strategies for quality assurance of intensity modulated radiation therapy. Journal of Physics: Conference Series 2015; 573: 012015. doi: 10.1088/1742-6596/573/1/012015 [DOI] [Google Scholar]
- 48.Agnew CE, Irvine DM, McGarry CK. Correlation of phantom-based and log file patient-specific QA with complexity scores for VMAT. Journal of Applied Clinical Medical Physics 2014; 15: 204–16. doi: 10.1120/jacmp.v15i6.4994 [DOI] [PMC free article] [PubMed] [Google Scholar]
- 49.Glenn MC, Hernandez V, Saez J, Followill DS, Howell RM, Pollard-Larkin JM, et al. Treatment plan complexity does not predict IROC Houston anthropomorphic head and neck phantom performance. Phys Med Biol 2018; 63: 205015. doi: 10.1088/1361-6560/aae29e [DOI] [PMC free article] [PubMed] [Google Scholar]
- 50.Jurado-Bruggeman D, Hernández V, Sáez J, Navarro D, Pino F, Martínez T, et al. Multi-Centre audit of VMAT planning and pre-treatment verification. Radiother Oncol 2017; 124: 302–10. doi: 10.1016/j.radonc.2017.05.019 [DOI] [PubMed] [Google Scholar]
- 51.McGarry CK, Agnew CE, Hussein M, Tsang Y, McWilliam A, Hounsell AR, et al. The role of complexity metrics in a multi-institutional dosimetry audit of VMAT. Br J Radiol 2016; 89: 20150445. doi: 10.1259/bjr.20150445 [DOI] [PMC free article] [PubMed] [Google Scholar]
- 52.Park S-Y, Kim J-in, Chun M, Ahn H, Park JM. Assessment of the modulation degrees of intensity-modulated radiation therapy plans. Radiation Oncology 2018; 13. doi: 10.1186/s13014-018-1193-9 [DOI] [PMC free article] [PubMed] [Google Scholar]
- 53.Wang Y, Pang X, Feng L, Wang H, Bai Y. Correlation between gamma passing rate and complexity of IMRT plan due to MLC position errors. Phys Med 2018; 47: 112–20. doi: 10.1016/j.ejmp.2018.03.003 [DOI] [PubMed] [Google Scholar]
- 54.Park JM, Kim J, Park S. Modulation indices and plan delivery accuracy of volumetric modulated Arc therapy. J of Applied Clin Med Phys 2019;: 1–11. [DOI] [PMC free article] [PubMed] [Google Scholar]
- 55.Park JM, Kim J-in, Park S-Y, Oh DH, Kim S-T. Reliability of the gamma index analysis as a verification method of volumetric modulated Arc therapy plans. Radiat Oncol 2018; 13. doi: 10.1186/s13014-018-1123-x [DOI] [PMC free article] [PubMed] [Google Scholar]
- 56.Low DA, Moran JM, Dempsey JF, Dong L, Oldham M. Dosimetry tools and techniques for IMRT: IMRT dosimetry tools. Med Phys 2011; 38: 1313–38. [DOI] [PubMed] [Google Scholar]
- 57.Poppe B, Djouguela A, Blechschmidt A, Willborn K, Rühmann A, Harder D. Spatial resolution of 2D ionization chamber arrays for IMRT dose verification: single-detector size and sampling step width. Phys Med Biol 2007; 52: 2921–35. doi: 10.1088/0031-9155/52/10/019 [DOI] [PubMed] [Google Scholar]
- 58.Bouchard H, Lacroix F, Beaudoin G, Carrier J-F, Kawrakow I. On the characterization and uncertainty analysis of radiochromic film dosimetry: characterization and uncertainty analysis of radiochromic film dosimetry. Med Phys 2009; 36(6Part1): 1931–46. [DOI] [PubMed] [Google Scholar]
- 59.Hussein M, Rowshanfarzad P, Ebert MA, Nisbet A, Clark CH. A comparison of the gamma index analysis in various commercial IMRT/VMAT QA systems. Radiother Oncol 2013; 109: 370–6. doi: 10.1016/j.radonc.2013.08.048 [DOI] [PubMed] [Google Scholar]
- 60.Valdes G, Scheuermann R, Hung CY, Olszanski A, Bellerive M, Solberg TD. A mathematical framework for virtual IMRT QA using machine learning. Med Phys 2016; 43: 4323–34. doi: 10.1118/1.4953835 [DOI] [PubMed] [Google Scholar]
- 61.Rajasekaran D, Jeevanandam P, Sukumar P, Ranganathan A, Johnjothi S, Nagarajan V. A study on the correlation between plan complexity and gamma index analysis in patient specific quality assurance of volumetric modulated Arc therapy. Rep Pract Oncol Radiother 2015; 20: 57–65. doi: 10.1016/j.rpor.2014.08.006 [DOI] [PMC free article] [PubMed] [Google Scholar]
- 62.Low DA, Harms WB, Mutic S, Purdy JA. A technique for the quantitative evaluation of dose distributions. Med Phys 1998; 25: 656–61. doi: 10.1118/1.598248 [DOI] [PubMed] [Google Scholar]
- 63.Nelms BE, Chan MF, Jarry G, Lemire M, Lowden J, Hampton C, et al. Evaluating IMRT and VMAT dose accuracy: practical examples of failure to detect systematic errors when applying a commonly used metric and action levels. Med Phys 2013; 40: 111722. doi: 10.1118/1.4826166 [DOI] [PMC free article] [PubMed] [Google Scholar]
- 64.Kry SF, Molineu A, Kerns JR, Faught AM, Huang JY, Pulliam KB, et al. Institutional patient-specific IMRT QA does not predict unacceptable plan delivery. Int J Radiat Oncol Biol Phys 2014; 90: 1195–201. doi: 10.1016/j.ijrobp.2014.08.334 [DOI] [PMC free article] [PubMed] [Google Scholar]
- 65.Fredh A, Scherman JB, Fog LS. Munck AF Rosenschöld P. patient QA systems for rotational radiation therapy: a comparative experimental study with intentional errors: QA system performance evaluated using radiation plan errors. Med Phys 2013; 40: 031716. [DOI] [PubMed] [Google Scholar]
- 66.Zhen H, Nelms BE, Tomé WA. Moving from gamma passing rates to patient DVH-based QA metrics in pretreatment dose QA: from passing rates to DVH-based QA metrics. Med Phys 2011; 38: 5477–89. [DOI] [PubMed] [Google Scholar]
- 67.Meyer P, Noblet V, Mazzara C, Lallement A. Survey on deep learning for radiotherapy. Comput Biol Med 2018; 98: 126–46. doi: 10.1016/j.compbiomed.2018.05.018 [DOI] [PubMed] [Google Scholar]
- 68.Valdes G, Chan MF, Lim SB, Scheuermann R, Deasy JO, Solberg TD. Imrt QA using machine learning: a multi-institutional validation. J Appl Clin Med Phys 2017; 18: 279–84. doi: 10.1002/acm2.12161 [DOI] [PMC free article] [PubMed] [Google Scholar]
- 69.Interian Y, Rideout V, Kearney VP, Gennatas E, Morin O, Cheung J, et al. Deep nets vs expert designed features in medical physics: an IMRT QA case study. Med Phys 2018; 45: 2672–80. doi: 10.1002/mp.12890 [DOI] [PubMed] [Google Scholar]
- 70.Tomori S, Kadoya N, Takayama Y, Kajikawa T, Shima K, Narazaki K, et al. A deep learning-based prediction model for gamma evaluation in patient-specific quality assurance. Med Phys 2018; 45: 4055–65. doi: 10.1002/mp.13112 [DOI] [PubMed] [Google Scholar]
- 71.Crijns W, Defraene G, Van Herck H, Depuydt T, Haustermans K, Maes F, et al. Online adaptation and verification of VMAT. Med Phys 2015; 42: 3877–91. doi: 10.1118/1.4921615 [DOI] [PubMed] [Google Scholar]
- 72.Lee MT, Purdie TG, Eccles CL, Sharpe MB, Dawson LA. Comparison of simple and complex liver intensity modulated radiotherapy. Radiat Oncol 2010; 5: 115. doi: 10.1186/1748-717X-5-115 [DOI] [PMC free article] [PubMed] [Google Scholar]
- 73.Edouard M, Anthonipillai V, Guemnie-Tafo A, Bessieres I. 33. Comparative study of modulation for VMAT treatments planned on eclipse and Raystation: complexity index and experimental correlation. Physica Medica 2017; 44: 16–27. doi: 10.1016/j.ejmp.2017.10.058 [DOI] [Google Scholar]
- 74.Broderick M, Leech M, Coffey M. Direct aperture optimization as a means of reducing the complexity of intensity modulated radiation therapy plans. Radiat Oncol 2009; 4: 8. doi: 10.1186/1748-717X-4-8 [DOI] [PMC free article] [PubMed] [Google Scholar]
- 75.McGarry CK, Chinneck CD, O’Toole MM, O’Sullivan JM, Prise KM, Hounsell AR, et al. Plan properties and patient geometry using intensity modulated radiation therapy (IMRT) complexity metrics: complexity metrics in IMRT. Med Phys 2011; 38: 2027–34. [DOI] [PubMed] [Google Scholar]
- 76.Binny D, Kairn T, Lancaster CM, Trapp JV, Crowe SB. Photon optimizer (PO) vs progressive resolution optimizer (pro): a conformality- and complexity-based comparison for intensity-modulated Arc therapy plans. Med Dosim 2018; 43: 267–75. doi: 10.1016/j.meddos.2017.10.003 [DOI] [PubMed] [Google Scholar]
- 77.Li M-H HS-F, Chang C-C, Lin J-C, Tsai J-T. Variations in dosimetric distribution and plan complexity with collimator angles in hypofractionated volumetric Arc radiotherapy for treating prostate cancer. J of Applied Clin Med Phys 2018; 19: 93–102. [DOI] [PMC free article] [PubMed] [Google Scholar]
- 78.Ohira S, Ueda Y, Akino Y, Hashimoto M, Masaoka A, Hirata T, et al. HyperArc VMAT planning for single and multiple brain metastases stereotactic radiosurgery: a new treatment planning approach. Radiat Oncol 2018; 13: 13. doi: 10.1186/s13014-017-0948-z [DOI] [PMC free article] [PubMed] [Google Scholar]
- 79.Kantz S, Söhn M, Troeller A, Reiner M, Weingandt H, Alber M, et al. Impact of Mlc properties and IMRT technique in meningioma and head-and-neck treatments. Radiation Oncology 2015; 10. doi: 10.1186/s13014-015-0447-z [DOI] [PMC free article] [PubMed] [Google Scholar]
- 80.Russo S, Esposito M, Hernandez V, Saez J, Rossi F, Paoletti L, et al. Does deep inspiration breath hold reduce plan complexity? multicentric experience of left breast cancer radiotherapy with volumetric modulated Arc therapy. Phys Med 2019; 59: 79–85. doi: 10.1016/j.ejmp.2019.02.018 [DOI] [PubMed] [Google Scholar]
- 81.Hussein M, Heijmen BJM, Verellen D, Nisbet A. Automation in intensity modulated radiotherapy treatment planning-a review of recent innovations. Br J Radiol 2018; 91: 20180270. doi: 10.1259/bjr.20180270 [DOI] [PMC free article] [PubMed] [Google Scholar]
- 82.Tamura M, Monzen H, Matsumoto K, Kubo K, Otsuka M, Inada M, et al. Mechanical performance of a commercial knowledge-based VMAT planning for prostate cancer. Radiat Oncol 2018; 13: 163. doi: 10.1186/s13014-018-1114-y [DOI] [PMC free article] [PubMed] [Google Scholar]
- 83.Marrazzo L, Meattini I, Arilli C, Calusi S, Casati M, Talamonti C, et al. Auto-planning for VMAT accelerated partial breast irradiation. Radiother Oncol 2019; 132: 85–92. doi: 10.1016/j.radonc.2018.11.006 [DOI] [PubMed] [Google Scholar]
- 84.Clark CH, Hussein M, Tsang Y, Thomas R, Wilkinson D, Bass G, et al. A multi-institutional dosimetry audit of rotational intensity-modulated radiotherapy. Radiother Oncol 2014; 113: 272–8. doi: 10.1016/j.radonc.2014.11.015 [DOI] [PubMed] [Google Scholar]