Abstract
This paper evaluated the repeatability and reproducibility (R&R) of quantitative ultrasound (QUS) biomarkers attenuation coefficient (AC) and backscatter coefficient (BSC) in transvaginal QUS reference phantoms for obstetric applications. Five phantoms were scanned by three sonographers according to the scanning protocol. Each sonographer scanned each phantom with four transvaginal transducers of the same model (MC9–4) and three probe cover types (latex cover, nonlatex cover, and no cover). The AC and BSC were estimated by using a reference phantom method. The R&R analysis was performed for the frequency-averaged AC and logBSC (=10log10BSC) (5.4–5.8 MHz) by using three-factor random effects Analysis of Variance with interaction. The total R&R variabilities for AC and logBSC are small (AC: 0.042 ∼ 0.065 dB/cm-MHz; logBSC: 0.50 ∼ 0.68 dB), indicating high measurement precision. These values are small compared to the ranges of AC (0.28 ∼ 0.99 dB/cm-MHz) and logBSC (−33.16 ∼ −20.35 dB) of the five phantoms. The AC and logBSC biomarkers measured on transvaginal QUS phantoms using the reference phantom method are repeatable, and reproducible between sonographers, transducers, and probe covers.
Keywords: Attenuation coefficient, backscatter coefficient, quantitative ultrasound, repeatability, reproducibility
I. Introduction
The Quantitative Imaging Biomarkers Alliance (QIBA) defines a quantitative imaging biomarker as an “objective characteristic derived from an in vivo image measured on a ratio or interval scale as an indicator of normal biological processes, pathogenic processes or a response to a therapeutic intervention” [1]. The attenuation coefficient (AC, dB/cm-MHz) and the backscatter coefficient (BSC, 1/cm-sr) are two common biomarkers used in quantitative ultrasound (QUS). AC is an objective measure of the spatial rate of ultrasonic energy loss in tissue, and BSC is an objective measure of the fraction of ultrasonic energy returned from tissue. AC and BSC provide quantitative information of tissue microstructures; e.g. [2]. In recent years, AC and BSC have shown promise in hepatic fat quantification [3]–[5] and early prediction of preterm birth [6], [7].
For AC and BSC biomarkers to be useful clinically, their precision needs to be evaluated rigorously. Precision deals with measurement variability, which is present whether the measurement conditions remain unchanged or vary between replicate measurements. It is necessary to demonstrate that the biomarkers can not only be used to repeat a measurement reliably, but also be used with a more general set of conditions. Therefore, two types of precision are considered: repeatability and reproducibility (R&R). Repeatability is “the measurement precision with conditions that remain unchanged between replicate measurements (repeatability conditions)” [8]. Reproducibility is “the measurement precision with conditions that vary between replicate measurements (reproducibility conditions)” [8]. Rigorous R&R studies allow us to evaluate separately the components contributing to variability.
In previous studies, the R&R of AC and BSC biomarkers have been determined in both phantoms [9] and human liver in adults with known or suspected nonalcoholic fatty liver disease (NAFLD) [10]–[12]. The phantom study [9] assessed the repeatability, between-transducer reproducibility and between-sonographers reproducibility in liver-tissue mimicking reference phantoms. The first human liver study [10] evaluated the repeatability and between-transducer reproducibility of AC and BSC. The second human liver study [11] assessed inter-sonographer reproducibility of AC and BSC. The third human liver study [12] assessed the inter-platform reproducibility of AC and BSC. All data acquisitions for these previous four studies [9]–[12] were obtained from a single site (UCSD) and the frequency ranges used to analyze R&R were around the center frequency of 3.0 MHz, typical for ultrasound liver studies.
This study examined the fundamental R&R for an obstetric application of transvaginal QUS using five reference phantoms and four transvaginal transducers for QUS biomarkers (frequency range 5.4–5.8 MHz) that were being developed to assess preterm birth in pregnant human subjects. The R&R phantom data were acquired at the University of Illinois at Chicago (UIC) Medical Center by three sonographers using the same research protocol that is being used to acquire the IRB-approved, HIPPA compliant human subjects QUS data [6], [7]. The study focused on repeatability, between-sonographer reproducibility, between-transducer reproducibility, and between-probe cover reproducibility of AC and BSC biomarkers in phantoms.
II. Methodology
A. Study Design
The study design’s purpose was to assess base-line repeatability as well as sonographer, transducer and transducer probe cover reproducibility of AC and BSC biomarkers using the well-established reference phantom method [13]. There were three sonographers (denoted S1, S2, and S3), four same-model ultrasonic transducers (denoted blue, green, orange, and red), and three probe covers (denoted latex cover, LC; nonlatex cover, NLC; and no cover, NC). Each sonographer scanned five phantoms (denoted UIC1, UIC2, UIC3, UIC4, and UIC5) according to the scanning protocol with each of the four transducers.
The reference phantoms’ membrane surface has a recess at the midline that closely matches the contour of a Siemens MC9–4 transvaginal ultrasonic transducer. Specifically, the MC9–4 active element lens surface has a 1.1-cm radius of curvature and each reference phantom (CIRS, Inc., Norfolk, VA) has a slot that is approximately 1.5-cm inside diameter and 1.1-cm deep (Fig. 1). The reference phantom slot allows for acquisition of the B-mode images (as well as the raw RF data) over much of the 176° array angle.
Fig. 1.
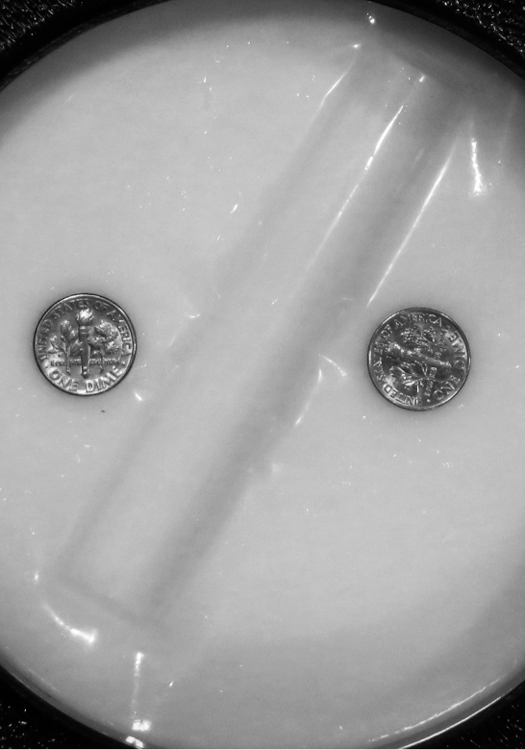
One of the reference phantom surfaces showing the slot in which one of the transvaginal transducer probes is positioned in order to obtain a full-field B-mode image (as well as the raw RF data). Scale: a US coin (dime) has a diameter of 1.8 cm.
The three sonographers each used four Siemens MC9–4 transvaginal ultrasound transducers (4–9 MHz nominally) to scan the phantoms with a clinical ultrasonic imaging system (Siemens S2000, Issaquah, WA) with the Axius Direct Ultrasound Research Interface to acquire the RF data [14]. Specifically (see Fig. 2), one sonographer scanned one of the UIC phantoms (e.g., UIC1) three times with the same latex cover (LC, Civco, Coralville, IA), three times with the same nonlatex cover (NLC, Parker Laboratories, Fairfield, NJ), three times with no probe cover (NC) and then one of the other phantoms (e.g., UIC2) with no cover (NC); for this sequence of scans, the last phantom scanned (e.g., UIC2) served as the reference phantom. 3 RF data frames were acquired during each scan. The same sonographer repeated the same scanning protocol using each of the other four phantoms separately as reference. Then the same sonographer repeated the same scanning protocol for each of the other three transducers plus respective probe covers.
Fig. 2.

The sequence of data acquisitions conducted by the same sonographer using the same transducer probe for which all three probe covers are used, and all five reference phantoms are scanned. The asterisk * denotes the reference phantom scan in each of the five sequence sets.
Figure 2 represents 50 scans performed by one sonographer using the same transducer probe. Without considering the reference phantom scan (denoted by the asterisk *) for each of the five sequence sets, 45 [50 – 5] QUS scans were performed from which QUS biomarker outcomes were estimated. For three sonographers and four transducer probes, a total of 540 [45 × 3 × 4] QUS scans were performed. Viewed differently, with three sonographers, four transducer probes and 45 [15 LC + 15 NLC + (20–5) NC] (5 NCs deleted because they are the reference phantom scans) transducer probe cover combinations, a total of 540 [3 × 4 × 45] QUS scans were performed. Each QUS scan yielded data from which two QUS biomarkers (AC and BSC) were estimated.
B. AC and BSC Processing
AC and BSC were calculated within a field of interest (FOI) rather than the whole image region for simplicity and comparability; the FOI is the largest FOI across all images. To segment the FOI, the B-mode image of each scan was generated using the corresponding RF data. The same region shown in Fig. 3 (axial: 30 mm; lateral: 92.5 degrees or 245 scan lines) for each of the 540 B-mode images was used as the FOI to estimate AC and BSC. Important parameters used in processing AC and BSC included the −6-dB bandwidth (3.7–7.5 MHz), the center frequency (5.6 MHz), and the pulse length (0.4 mm).
Fig. 3.
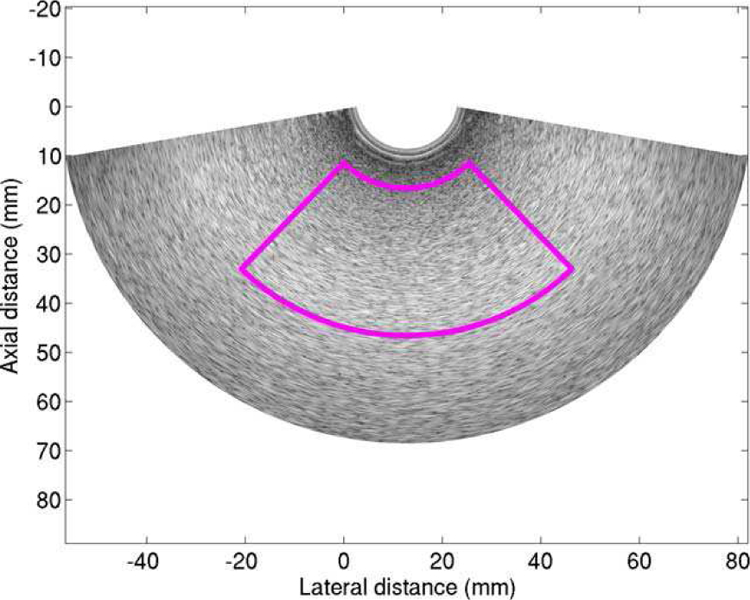
The FOI used for calculating AC and BSC.
AC was calculated by the spectral difference reference phantom technique [13] using the RF data. The QUS processing methodologies, described in detail in [9], were used to calculate the AC of one phantom.
For BSC computation, the attenuation of the phantom and the transmission loss of the probe cover were both compensated. The attenuation loss was compensated by using the estimated attenuation coefficient of that phantom. The probe cover’s transmission loss was compensated by using the roundtrip pressure transmission coefficient (Fig. 4) of that transducer cover type. Because the latex (LC) and nonlatex covers (NLC) have different acoustic properties, different transmission loss values were used for LCs and NLCs, determined as follows.
Fig. 4.
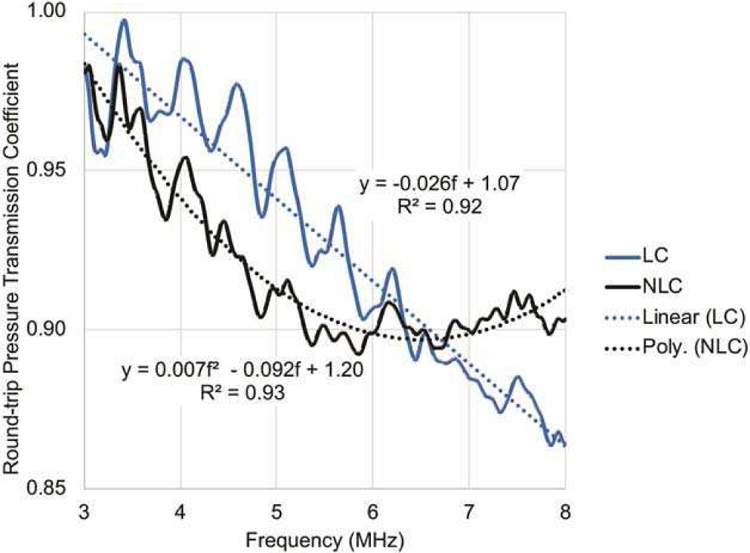
The round-trip pressure transmission coefficients (%) for both the latex probe covers (LC) and nonlatex probe covers (NLC) relative to the 100% no cover (NC).
The round-trip pressure transmission coefficients (Fig. 4) were estimated using a subset of the acquired data described in Fig. 2. Specifically, the transmission coefficients of LC and NLC shown in Fig. 4 were estimated by averaging the transmission coefficients of 60 LC samples and 60 NLC samples, respectively. The sample size of 60 [1 × 5 × 3 × 4] LC samples was a result of one LC sample in each box of Fig. 2 times 5 boxes times 3 sonographers times 4 transducers. 60 NLC samples were similarly obtained. Each LC sample was used in three scans (first row in each box of Fig. 2), and so was each NLC sample (second row in each box of Fig. 2). The transmission coefficient of each LC sample was estimated by
| (1) |
where PSLC,i is the power spectrum of the echo data acquired by the i -th scan of the 3 scans shown in the first row of Fig. 2, and PSNC,i is the power spectrum of the echo data acquired by the i -th scan of the three scans shown in the third row of Fig. 2. Similarly, the transmission coefficient of each NLC sample was estimated by
| (2) |
where PSNLC,i is the power spectrum of the echo data acquired by the i -th scan of the three scans shown in the second row of Fig. 2, and PSNC,i is the power spectrum of the echo data acquired by the i -th scan of the three scans shown in the third row of Fig. 2. A linear equation was fitted to the average transmission coefficient estimated from 60 LC samples, and a quadratic equation was fitted to the average transmission coefficient estimated from 60 NLC samples (Fig. 2). These equations were found to provide adequate fit to the data over the frequency range of the experiment. The linear and quadratic fitted values were used to correct for the transmission loss of LC and NLC samples, respectively, during the BSC estimation process.
After compensating the attenuation loss and the transmission loss, the BSC was calculated by the reference phantom technique [13] with the QUS processing methodologies described in detail in [9].
C. R&R Methodology
The study’s purpose was to estimate the repeatability and reproducibility of AC and BSC biomarkers using the reference phantom methodology. Repeatability means the closeness of measurements obtained by the same method under the same conditions, that is, the closeness of results by the same sonographer, same transducer probe and the same probe cover. The reproducibility means the closeness of measurements obtained by the same method under different conditions, that is, the closeness of results by different sonographers, the different transducer probes, and different probe covers.
A balanced analysis of variance (ANOVA) approach was used to analyze various components of the R&R. This study includes three effects: the sonographer effect, the transducer effect, and the probe cover effect. The interactions between these three effects were unknown. Therefore, a three-factor model with interactions was used. Random effects were assumed because the sonographers, transducers, and probe covers were considered random samples of a larger pool of sonographers, transducers, and probe covers. The three-factor random model was used to calculate repeatability, reproducibility, and interactions between factors [15].
The R&R analysis was performed separately for each of the five phantoms. Also, AC and logBSC (defined as 10log10BSC) were separately assessed; the log transformation was performed to normalize the distribution. The p-values of Shapiro-Wilk test for logBSC of five phantoms are 0.027, 0.075, 0.078, 0.099 and 0.513. After Bonferroni-Holm adjustment for multiple testing, none of these five tests is significant at level α=0.10. Frequency-averaged AC and logBSC values (5.4–5.8 MHz), rather than AC and logBSC versus frequency spectra in the entire bandwidth (3.7–7.5 MHz), were used for the R&R analysis, because R&R analysis over the entire bandwidth would have required functional ANOVA [16] as logBSC is correlated with the frequency. Therefore, the bandwidth of frequencies for analysis was selected around the RF data center frequency in order to utilize the less complex ANOVA approach.
The three-factor random effects with interaction [15] was modeled as
| (3) |
where Yijkl is the measured AC or log-BSC of a phantom, µY is a constant, and Ai , Bj , Ck ,( AB)ij ,( AC)ik ,(BC) jk,( ABC)ijk , and εijk are jointly independent normal random variables with means of zero and variances , and respectively. The terms Ai , Bj , Ck ,( AB)ij ,( AC)ik ,(BC) jk,( ABC)ijk and εijk represent the effects of factor A, factor B, factor C (e.g. A=sonographer, B=transducer, and C=probe cover), the interaction between factors A and B, the interaction between factors A and C, the interaction between factors B and C, the interaction between the three factors, and the error term (repeatability effect). The terms nA, nB , and nC represent the number of conditions for factors A, B, and C, respectively (e.g., nA =3 sonographers, nB =4 transducers, and nC =3 probe covers), and nacquisition represents the number of measurements made with each combination of factors A, B, and C.
III. Results
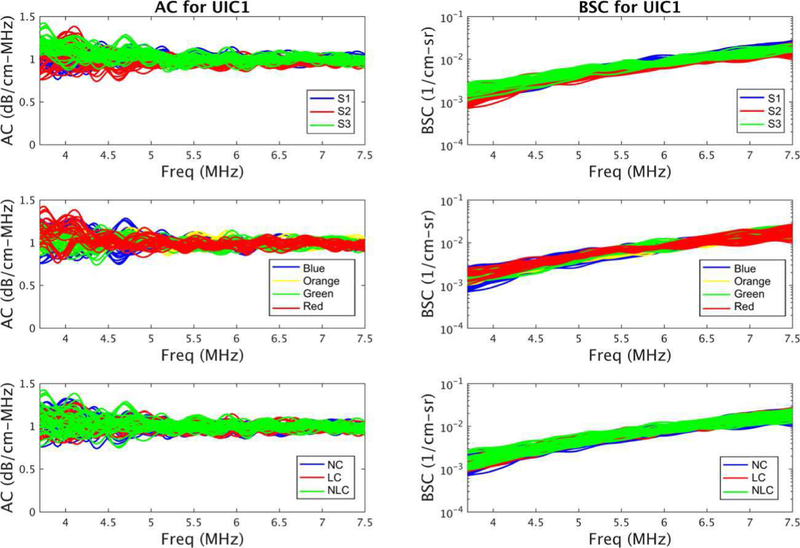
The estimated AC and BSC curves show good agreements among 108 measurements for each phantom. The frequency-dependent (3.7–7.5 MHz) AC and BSC curves of phantom UIC1 are shown in Fig. 5. The AC variances are slightly larger than the BSC variances because the AC estimation requires a calculation that the BSC estimation does not require, that is, the AC estimation uses a slope of a straight line that fits the natural log ratio of the sample power spectrum to the reference power spectrum at different depths [13]. Due to different scales of measurement the variances of the AC and BSC measurements are on different scales, thus the factor variances were compared with response variances separately for the two types of measurements.
Fig. 5.
The frequency-dependent (3.7–7.5 MHz) AC and BSC curves from 108 measurements of phantom UIC1. Top row) AC and BSC curves color coded by sonographers. Middle row) AC and BSC curves color coded by transducers. Bottom row): AC and BSC curves color coded by probe covers denoted by the probe cover (LC or NLC) or no probe cover (NC).
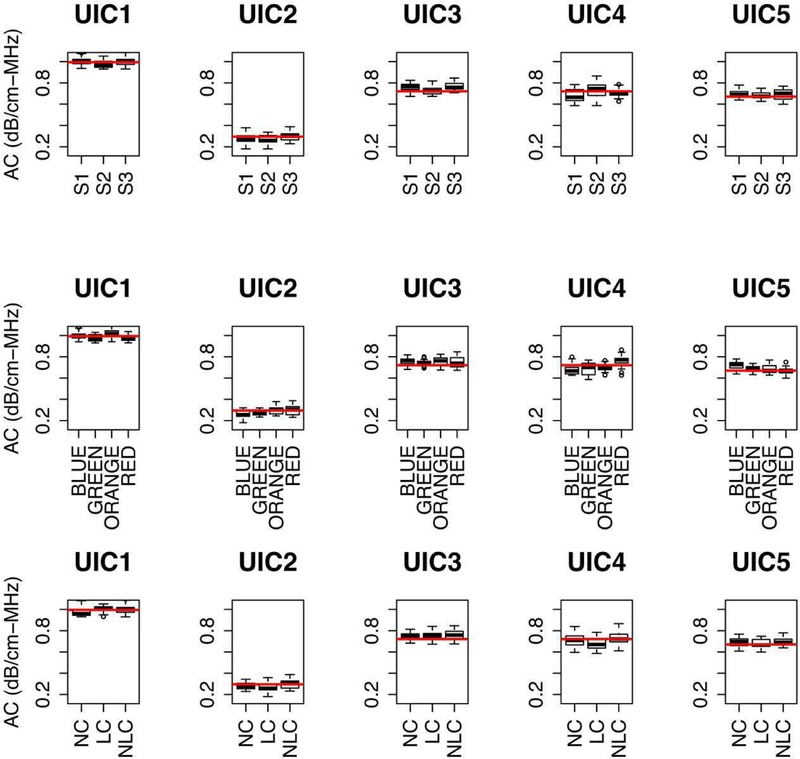
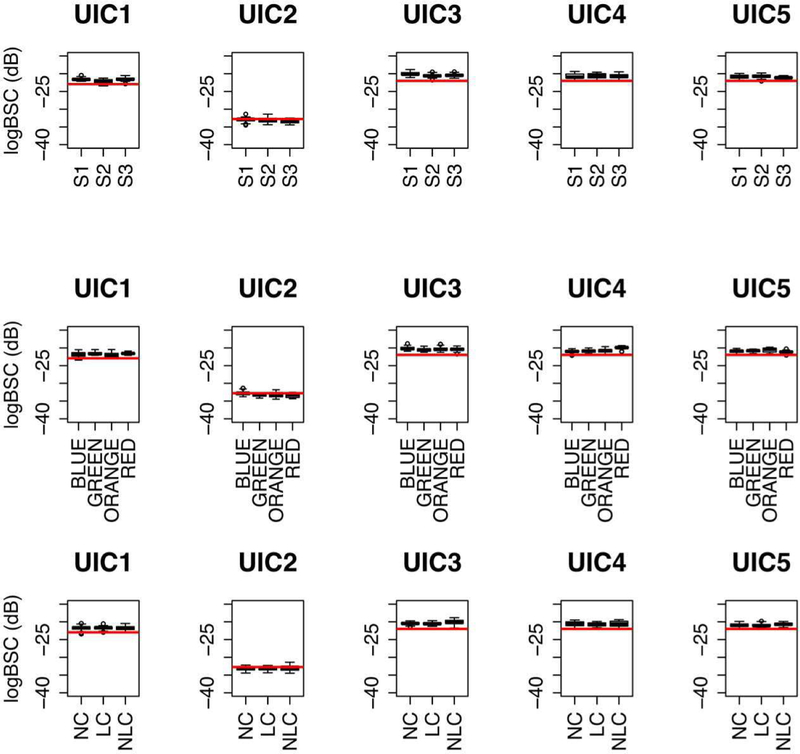
The boxplots of AC and logBSC for each phantom over the 5.4–5.8 MHz bandwidth are shown in Fig. 6 and Fig. 7, respectively. The red horizontal lines in Figs. 6 and 7 are the calibrated values of AC and logBSC, respectively, for each phantom. The estimated AC and logBSC values (in Figs. 6 and 7, respectively) are close to the calibrated AC and logBSC for each phantom (see Fig. A1). Overall, the AC and logBSC values within the small bandwidth are consistent and agree with calibrated values.
Fig. 6.
Boxplots of AC of each phantom. The plots in the top row are drawn with respect to sonographers, the plots in the middle row are drawn with respect to transducers, and plots in the bottom row are drawn with respect to transducer probe covers. The red horizontal lines are the calibrated values of AC (see Fig. A1) for each phantom. The size of the box indicates the upper quartile and lower quartile. The inner lines are the median of estimated AC, the top whiskers are the maximum value except the outliers, and the low whiskers are the minimum value except the outliers, and open circles (if any) represent outliers.
Fig. 7.
Boxplots of logBSC of each phantom. The plots in the top row are drawn with respect to sonographers, the plots in the middle row are drawn with respect to transducers, and plots in the bottom row are drawn with respect to transducer probe covers. The red horizontal lines are the calibrated values of logBSC (see Fig. A1) for each phantom. The size of the box indicates the upper quartile and lower quartile. The inner lines are the median of estimated logBSC, the top whiskers are the maximum value except the outliers, and the low whiskers are the minimum value except the outliers, and open circles (if any) represent outliers.
The R&R results of AC and logBSC of all phantoms are shown in Fig. 8 and Fig. 9, respectively, and are expressed in terms of the standard deviation. For R&R estimates of AC, the repeatability shows no correlation with phantoms and is consistent for each phantom. Except for the reproducibility of phantom UIC4, the reproducibility shows no correlation with phantoms and is consistent for the other four phantoms. In general, the repeatability (0.020 to 0.023 dB/cm-MHz) is smaller than the reproducibility (0.035 to 0.061 dB/cm-MHz) for each phantom. There are interaction effects between different factors for each phantom. The AC uncertainty caused by the transducer probe effect (0.028 ∼ 0.053 dB/cm-MHz) is larger than the uncertainty caused by the sonographer effect by 1% ∼ 23% or the probe cover effect by 2% ∼ 111%.
Fig. 8.
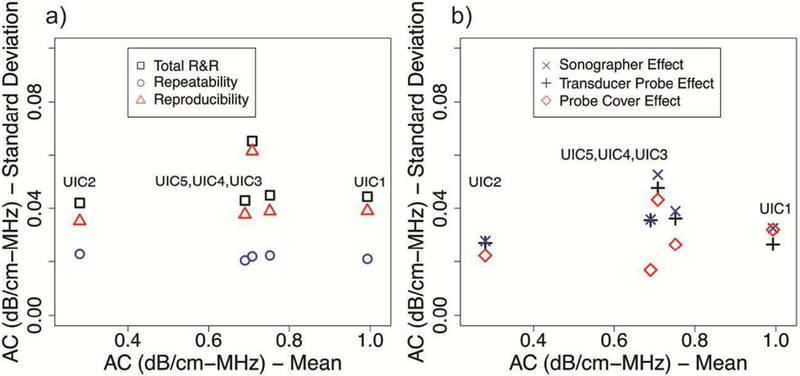
R&R summary of AC of all phantoms: a) Total R&R, repeatability, and reproducibility; b) sonographer effect, transducer probe effect and probe cover effect.
Fig. 9.
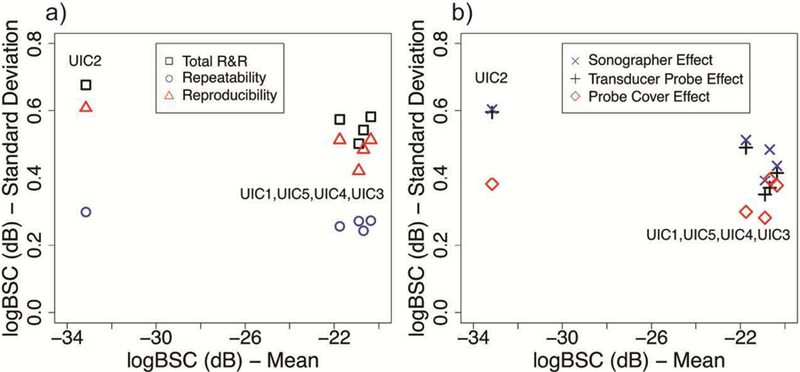
R&R summary of logBSC of all phantoms: a) Total R&R, repeatability, and reproducibility; b) sonographer effect, transducer probe effect and probe cover effect.
For R&R estimates of logBSC, the repeatability and the reproducibility also show no correlation with phantoms and are consistent for each of phantom. The repeatability (0.23 to 0.30 dB) is better than the reproducibility (0.42 to 0.61 dB) for each phantom. The logBSC uncertainty caused by the transducer probe effect (0.39 ∼ 0.60 dB) is larger than the uncertainty caused by the sonographer effect by 2% ∼ 31% or the probe cover effect by 16% ∼ 72%.
The R&R results show that the total R&Rs are consistent among all phantoms. For each phantom, the total R&R of AC and logBSC is much smaller compared to the mean value for that phantom. The total R&R of AC and logBSC is small (AC: 0.042 ∼ 0.065 dB/cm-MHz; logBSC: 0.50 ∼ 0.68 dB) compared to the ranges of AC (0.28 ∼ 0.99 dB/cm-MHz) and logBSC (−33.16 ∼ −20.35 dB). The ratio of the highest total R&R to the AC range is 9.8% and the ratio of the highest total R&R to the logBSC range is 7.6%.
IV. Discussion
This study examined the repeatability and reproducibility of AC and BSC biomarkers in transvaginal QUS phantoms for obstetric applications. The total R&R variabilities are low for both AC and logBSC for all five phantoms and indicate high precisions of AC and logBSC results using the reference phantom technique. The total R&R variabilities of AC and logBSC are 0.042 ∼ 0.065 dB/cm-MHz and 0.50 ∼ 0.68 dB, respectively, and are small compared to the AC range (0.28 to 0.99 dB/cm-MHz) and the logBSC range (−33.16 ∼ −20.36 dB). The repeatability of AC (0.020 ∼ 0.023 dB/cm-MHz) and logBSC (0.23 ∼ 0.30 dB) is smaller than the reproducibility of AC (0.035 ∼ 0.061 dB/cm-MHz) and logBSC (0.42 to 0.61 dB), respectively. The variabilities of AC (0.001 ∼ 0.003 dB/cm-MHz) and logBSC (0.35 ∼ 0.52 dB) measured in the calibration are smaller than the total R&R variability for AC and logBSC.
Compared to the results of a previous liver-mimicking phantom study [9], the repeatability of AC and logBSC in this study are close to the repeatability of AC and logBSC in the previous study [9]. The reproducibility of AC and logBSC is higher than the reproducibility of AC and logBSC in the previous liver-mimicking study due to several reasons. The first reason is that this study has an additional probe cover effect which the previous study did not have [9]. Compared to the two factors (sonographers and transducer) in the previous liver-mimicking study, there were three factors (sonographers, transducers, and probe covers) in this study that resulted in increased reproducibility variability. The second reason is that the sample variations of probe covers introduced additional variability in the measurements. In this study, the same set of transmission coefficients was used to compensate the loss of all probe covers for each type. However, the same type probe covers might physically differ from each other and have slightly different transmission losses. Therefore, using the same set of transmission coefficients for all probe cover types led to larger reproducibility variability for both AC and logBSC.
There are some other factors which contribute to the differences in reproducibility between the two phantom-based studies. For example, the type of transducer used in the study can influence reproducibility differently. The transducers used in this study were transvaginal probes with a small foot print (31 mm) and a wide field of view (176°), while the transducers used in [9] were larger curvilinear arrays (e.g., foot print of 4C1 = 61 mm) with a narrower field of view (66°). The frequency can also be a factor influencing the reproducibility. The center frequency used in this study (5.6 MHz) was greater than that in the previous study (2.8 MHz) [9]. However, the study was not designed to determine how the transducer type and the frequency range influenced reproducibility of AC and logBSC.
This study shows good repeatability and reproducibility of AC and logBSC in phantoms and suggests good QUS precision in obstetric applications. Further studies should determine the precision of QUS parameters in vivo. From the previous liver studies [10]–[12], the R&R in vivo are lower than the R&R in phantoms due to additional variability caused by biological tissues. The required precision ranges of AC and logBSC will depend on their clinical use in obstetric ultrasound.
There were some limitations in this phantom-based study. We only considered effects of sonographers, probes and probe covers. There were other factors that could have contributed to the reproducibility that were not considered here such as the transducer type, the operating frequency, the imaging platform, and the FOI size. Future studies may evaluate the effects of these factors on reproducibility of AC and BSC. Also, we used the spectrum difference method for AC calculations and reference phantom method for BSC calculations. Other AC and BSC computing algorithms exist but were not evaluated [17], [18].
V. Conclusion
The AC and logBSC biomarkers measured with transvaginal QUS phantoms using the reference phantom method are repeatable, and reproducible among sonographers, transducer probes, and probe covers.
Acknowledgment
The authors are grateful for the dedicated contributions for the phantom calibration expertise of Rita J. Miller, Aalishba Ahmad, Jamie Kelly and Jake Berndt.
This work was supported in part by the National Institutes of Health Grant R01 HD089935.
Appendix A
Phantom Calibration Results
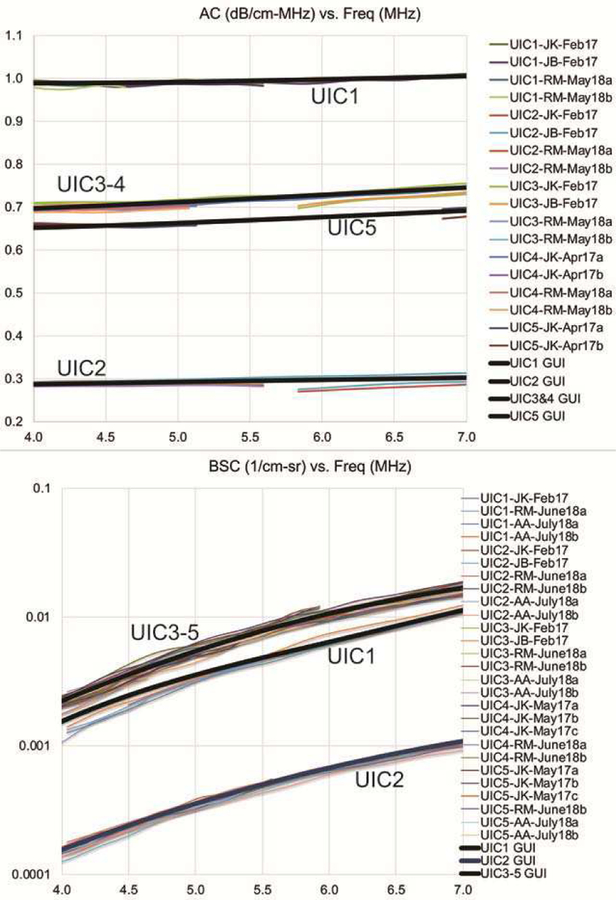
The five Zerdine® Hydrogel phantoms (CIRS, Inc., Norfolk, VA) were calibrated multiple times before and after the R&R phantom data acquisition by the three sonographers. The detailed QUS calibration procedures are discussed in [9]. The AC and BSC calibration results are shown in Fig. A1. The sound speeds we measured for all phantoms were 1538±4 m/s at 20±1 °C. Multiple additional calibration results were averaged to yield the phantom calibrations. The precision of each of the phantom’s calibrations around the 5.6-MHz center frequency is represented as the ratio of the frequency-averaged (5.4–5.8 MHz) standard deviation to the frequency-averaged mean, yielding 0.087–1.41% for AC and 1.36–2.49% for BSC. Additionally, coded into the QUS processing methodologies were the respective round-trip pressure transmission coefficients (Fig. 4) for both the latex (LC) and nonlatex (NLC) probe covers.
Fig. A1.
Calibrated AC (top) and BSC (bottom) versus frequency for the five UIC reference phantoms along with each calibration curve (denoted by GUI). The calibration data were acquired between February 2017 and July 2018 and bracketed the dates of the R&R phantom study that was conducted with the five phantoms and three sonographers during April and May 2018.
Contributor Information
Shi Chen, Bioacoustics Research Laboratory, Department of Electrical and Computer Engineering, University of Illinois at Urbana-Champaign, Urbana, IL 61801.
Barbara L. McFarlin, Department of Women Children and Family Health Science, UIC College of Nursing, University of Illinois at Chicago, Chicago, IL 60612.
Barbara T. Meagher, Department of Women Children and Family Health Science, UIC College of Nursing, University of Illinois at Chicago, Chicago, IL 60612.
Tara A. Peters, Department of Women Children and Family Health Science, UIC College of Nursing, University of Illinois at Chicago, Chicago, IL 60612.
Douglas G. Simpson, Department of Statistics, University of Illinois at Urbana-Champaign, Champaign, IL 61820..
William D. O’Brien, Jr., Bioacoustics Research Laboratory, Department of Electrical and Computer Engineering, University of Illinois at Urbana-Champaign, Urbana, IL 61801.
Aiguo Han, Bioacoustics Research Laboratory, Department of Electrical and Computer Engineering, University of Illinois at Urbana-Champaign, Urbana, IL 61801.
References
- [1].Kessler LG, Barnhart HX, Buckler AJ, Choudhury KR, Kondratovich MV, Toledano A, Guimaraes AR, Filice R, Zhang Z, Sullivan DC, and QIBA Terminology Working Group, “The emerging science of quantitative imaging biomarkers terminology and definitions for scientific studies and regulatory submissions,” Stat. Methods Med. Res, vol. 24, no. 1, pp. 9–26, 2015. [DOI] [PubMed] [Google Scholar]
- [2].Wirtzfeld LA, Nam K, Labyed Y, Ghoshal G, Haak A, Sen-Gupta E, He Z, Hirtz NR, Miller RJ, Sarwate S, Simpson DG, Zagzebski JA, Bigelow TA, Oelze ML, Hall TJ, O’Brien WD Jr. “Techniques and evaluation from a cross-platform imaging comparison of quantitative ultrasound parameters in an in vivo rodent fibroadenoma model,” IEEE Trans. Ultrason., Ferroelect., Freq. Control, vol. 60, no. 7, pp. 1386–1400, July 2013. [DOI] [PMC free article] [PubMed] [Google Scholar]
- [3].Andre MP, Han A, Heba E, Hooker J, Loomba R, Sirlin CB, Erdman JW Jr., and O’Brien WD Jr., “Accurate diagnosis of nonalcoholic fatty liver disease in human participants via quantitative ultrasound,” in 2014 IEEE International Ultrasonics Symposium, 2014, pp. 2375–2377. [Google Scholar]
- [4].Lin SC, Heba E, Wolfson T, Ang B, Gamst A, Han A, Erdman JW Jr., O’Brien WD Jr., Andre MP, Sirlin CB, and Loomba R, “Noninvasive diagnosis of nonalcoholic fatty liver disease and quantification of liver fat using a new quantitative ultrasound technique,” Clin. Gastroenterol. Hepatol, vol. 13, no. 7, pp. 1337–1345, 2015. [DOI] [PMC free article] [PubMed] [Google Scholar]
- [5].Paige JS, Bernstein GS, Heba E, Costa EAC, Fereirra M, Wolfson T, Gamst AC, Valasek MA, Lin GY, Han A, Erdman JW Jr., O’Brien WD Jr., Andre MP, Loomba R, and Sirlin CB, “A Pilot Comparative Study of Quantitative Ultrasound, Conventional Ultrasound, and MRI for Predicting Histology-Determined Steatosis Grade in Adult Nonalcoholic Fatty Liver Disease,” Am. J. Roentgenol, vol. 208, no. 5, pp. W168–W177, 2017. [DOI] [PMC free article] [PubMed] [Google Scholar]
- [6].McFarlin BL, Kumar V, Bigelow TA, Simpson DG, White-Traut RC, Abramowicz JS, and O’Brien WD Jr., “Beyond cervical length: A pilot study of ultrasonic attenuation for early detection of preterm birth risk,” Ultrasound Med. Biol, vol. 41, no. 11, pp. 3023–3029, 2015. [DOI] [PMC free article] [PubMed] [Google Scholar]
- [7].McFarlin BL, Balash J, Kumar V, Bigelow TA, Pombar X, Abramowicz JS, and O’Brien WD Jr., “Development of an ultrasonic method to detect cervical remodeling in vivo in full-term pregnant women,” Ultrasound Med. Biol, vol. 41, no. 9, pp. 2533–2539, 2015. [DOI] [PMC free article] [PubMed] [Google Scholar]
- [8].Sullivan DC, Obuchowski NA, Kessler LG, Raunig DL, Gatsonis C, Huang EP, Kondratovich M, McShane LM, Reeves AP, Barboriak DP, Guimaraes AR, Wahl RL, and RSNA-QIBA Metrology Working Group, “Metrology standards for quantitative imaging biomarkers,” Radiology, vol. 277, no. 3, pp. 813–825, 2015. [DOI] [PMC free article] [PubMed] [Google Scholar]
- [9].Han A, Andre MP, Erdman JW Jr., Loomba R, Sirlin CB, and O’Brien WD Jr., “Repeatability and reproducibility of a clinically based QUS phantom study and methodologies,” IEEE Trans. Ultrason. Ferroelectr. Freq. Control, vol. 64, no. 1, pp. 218–231, 2017. [DOI] [PMC free article] [PubMed] [Google Scholar]
- [10].Han A, Andre MP, Deiranieh L, Housman E, Erdman JW Jr., Loomba R, Sirlin CB, and O’Brien WD Jr., “Repeatability and reproducibility of the ultrasonic attenuation coefficient and backscatter coefficient measured in the right lobe of the liver in adults with known or suspected nonalcoholic fatty liver disease,” J. Ultrasound Med, vol. 37, no. 8, pp. 1913–1927, 2018. [DOI] [PMC free article] [PubMed] [Google Scholar]
- [11].Han A, Labyed Y, Sy EZ, Boehringer AS, Andre MP, Erdman JW Jr., Loomba R, Sirlin CB, and O’Brien WD Jr., “Inter-sonographer reproducibility of quantitative ultrasound outcomes and shear wave speed measured in the right lobe of the liver in adults with known or suspected non-alcoholic fatty liver disease,” Eur. Radiol, vol. 28, no. 12, pp. 4992–5000, 2018. [DOI] [PMC free article] [PubMed] [Google Scholar]
- [12].Han A, Zhang YN, Boehringer AS, Andre MP, Erdman JW Jr., Loomba R, Sirlin CB, and O’Brien WD Jr., “Inter-platform reproducibility of ultrasonic attenuation and backscatter coefficients in assessing NAFLD,” Eur. Radiol, accepted. [DOI] [PMC free article] [PubMed] [Google Scholar]
- [13].Yao LX, Zagzebski JA, and Madsen EL, “Backscatter coefficient measurements using a reference phantom to extract depth-dependent instrumentation factors,” Ultrason. Imaging, vol. 12, no. 1, pp. 58–70, 1990. [DOI] [PubMed] [Google Scholar]
- [14].Brunke SS, Insana MF, Dahl JJ, Hansen C, Ashfaq M and Ermert H. “An ultrasound research interface for a clinical system. IEEE Trans. Ultrason. Ferroelectr. Freq. Control, vol 54, no. 1, pp. 198–210, 2007. [DOI] [PubMed] [Google Scholar]
- [15].Burdick RK, Borror CM, and Montgomery DC, Design and Analysis of Gauge R&R Studies: Making Decisions with Confidence Intervals in Random and Mixed ANOVA Models, ASA-SIAM Series on Statistics and Applied Probability Philadelphia, PA, USA: SIAM, 2005. [Google Scholar]
- [16].Park Y and Simpson DG, “Robust probabilistic classification applicable to irregularly sampled functional data,” Comput. Stat. Data Anal, vol. 131, pp. 37–49, 2019. [DOI] [PMC free article] [PubMed] [Google Scholar]
- [17].Haak A, Hafez ZT, Anderson JJ, Herd M-T, Nam K, Madsen EL, Bigelow TA, Hall TJ and O’Brien WD Jr. “Algorithm for estimating the attenuation slope from backscattered ultrasonic signals,” 2009 IEEE International Ultrasonics Symposium, pp. 1946–1949, 2009. [Google Scholar]
- [18].Kim H and Varghese T, “Hybrid Spectral Domain Method for Attenuation Slope Estimation,” Ultrasound Med. Biol, vol. 34, no. 11, pp. 1808–1819, 2008. [DOI] [PubMed] [Google Scholar]


