Abstract
The mechanism by which the human primary motor cortex (M1) encodes upper extremity movement kinematics is not fully understood. For example, human electrocorticogram (ECoG) signals have been shown to modulate with upper extremity movements, however this relationship has not been explicitly characterized. To address this issue, we recorded high-density ECoG signals from patients undergoing epilepsy surgery evaluation as they performed elementary upper extremity movements while systematically varying movement speed and duration. Specifically, subjects performed intermittent pincer grasp/release, elbow flexion/extension, and shoulder flexion/extension at slow, moderate, and fast speeds. In all movements, bursts of power in the high-γ band (80–160 Hz) were observed in M1. In addition, the amplitude of these power bursts and the area of M1 with elevated high-γ activity were directly proportional to the movement speed. Likewise, the duration of elevated high-γ activity increased with movement duration. Based on linear regression, M1 high-γ power amplitude and duration covaried with movement speed and duration, respectively, with an average r2 of 0.75±0.10 and 0.68±0.21. These findings indicate that the encoding of upper extremity movement speed by M1 high-γ activity is primarily linear. Also, the fact that this activity remained elevated throughout a movement suggests that M1 does not merely generate transient instructions for a specific movement duration, but instead is responsible for the entirety of the movement. Finally, the spatial distribution of high-γ activity suggests the presence of a recruitment phenomenon in which higher speeds or increased muscle activity involve activation of larger M1 areas.
Keywords: Electrocorticography, Motor cortex, Kinematic, Movement speed, Movement duration
1. Introduction
Subdurally-recorded electrocorticogram (ECoG) signals, particularly in the γ band (>30 Hz), are known to be modulated with movements. For example, event-related synchronization (ERS) of the ECoG γ band has been observed in response to both upper (Crone et al, 1998a; Pfurtscheller et al, 2003; Miller et al, 2007; Fujiwara et al, 2016) and lower (Fujiwara et al, 2016) extremity movements. Early studies from Crone et al (1998a) reported on transient ERS in the high-γ band during fist clenching. Similar findings have been reported by Pfurtscheller et al (2003) and Miller et al (2007). More recently, Anderson et al (2012) demonstrated that ECoG high-γ signals were linearly modulated by arm speed during center-out reaching and circle drawing tasks. Hammer et al (2016) also showed that ECoG power in the 50–1000 Hz band is modulated with arm movement speed during steering wheel and joystick movements with different speeds. Despite these findings, the explicit relationship between ECoG and upper extremity kinematics at individual degrees of freedom (DOFs) remains incompletely understood. For example, the studies by Crone et al (1998a), Pfurtscheller et al (2003), and Miller et al (2007) were limited to fist clenching movements, and so it is unclear if their findings generalize to other upper extremity DOFs. On the other hand, Anderson et al (2012) and Hammer et al (2016) studied complex movements that involve dynamic interaction of multiple DOFs, which makes it difficult to understand the control of elementary upper extremity movements. In addition, these studies did not systematically vary the movement speed and duration. Meanwhile, many studies reported on the decoding of movement trajectories from ECoG high-γ signals (Schalk et al, 2007; Pistohl et al, 2008; Kubánek et al, 2009; Acharya et al, 2010; Wang et al, 2011b, 2013d). However, these “black box” approaches are focused on maximizing the correlation between the actual and decoded trajectories, which does not necessarily contribute to the physiological understanding of ECoG signals underlying upper extremity kinematics. In addition, relatively modest decoding results (correlation coefficients ranging from 0.43 to 0.69) indicate that these models could significantly benefit from better understanding of the underlying physiological processes.
Neuroimaging approaches, including functional magnetic resonance imaging (fMRI) and positron emission tomography (PET), have also found a relationship between movement velocities and M1 metabolic activity (Turner et al, 1998; Jäncke et al, 1999; Lutz et al, 2004). However, due to the susceptibility to motion artifacts and limited space in the MRI and PET scanners, these studies only examined movements at small joints such as fingers. In addition, the lack of temporal resolution in these techniques precludes the examination of the precise timing between movements and the underlying brain activity. Finally, similar to the existing ECoG-based studies, these neuroimaging studies did not employ a systematic variation of velocity and movement duration.
Motivated by this knowledge gap, we performed preliminary studies where we identified a high degree of correlation between the waveforms of ECoG high-γ (80–160 Hz) power and the waveforms of arm movement velocity (Wang et al, 2013a,b). Furthermore, the duration of elevated ECoG high-γ power seemed to match the duration of elementary upper extremity movements at six individual DOFs. A systematic variation of arm movement speed and duration in a single subject corroborated this observation (Wang et al, 2014). However, given the limited sample size, it remains unclear whether high-γ represents the primary motor cortex (M1) activity necessary to drive a movement throughout its entire duration, or if these power bursts last only a brief time to provide instructions for a specific movement duration and intensity while other neural centers are responsible for activating the muscles accordingly. To address this issue and to better understand the role of M1 in motor control of the arm and hand, this study systematically varied the velocity (speed and direction) and duration of three elementary upper extremity movements in a population of subjects undergoing ECoG electrode implantation.
2. Methods
2.1. Overview
Patients undergoing epilepsy surgery evaluation with ECoG electrodes implanted over the arm motor cortex were recruited for the study. They performed three elementary types of movements with the arm contralateral to the ECoG implant. The movements consisted of flexions and extensions, each intervened by a brief idling period, and were performed at three different speeds (fast, moderate, and slow). The ECoG signals and trajectories underlying each movement were simultaneously recorded. The ECoG high-γ power underlying each flexion and extension event was then analyzed, and its relationship to the movement velocity and duration was characterized.
2.2. Subjects
This study was approved by the Institutional Review Boards of the University of California, Irvine and the Rancho Los Amigos National Rehabilitation Center. Subjects were recruited from a population of individuals temporarily implanted with subdural ECoG electrodes for epilepsy surgery evaluation. Subject selection was limited to those with high-density (HD) electrode grids (electrode diameter: 2 mm, inter-electrode distance: 4 mm) covering the M1 upper extremity representation area. Note that HD grids have been shown to encode arm movement parameters with a higher resolution than standard ECoG grids (Wang et al, 2016).
2.3. Signal Acquisition and Experimental Task
Up to 64 channels of ECoG data were recorded using a pair of linked NeXus-32 bioamplifiers (Mind Media, Roermond-Herten, The Netherlands). The signals were acquired at 2048 Hz with common average referencing and a built-in 553 Hz low-pass filter. Subjects performed the following elementary upper extremity movements on the side contralateral to the ECoG electrode implant: 1. pincer grasp and release (PG); 2. elbow flexion and extension (E); and 3. shoulder forward flexion and extension (SFE). Prior to data collection, a motion sensor was mounted on the joint of interest. Specifically, the trajectory of PG movements was measured by a custom-made electrogoniometer (Wang et al, 2011a) placed over the metacarpophalangeal joint of the index finger. The trajectories of E and SFE movements were measured by a gyroscope (Subjects 1–4: Wii Motion Plus, Nintendo, Kyoto, Japan; Subjects 5–7: L3GD20 three-axis gyroscope, STMicroelectronics, Geneva, Switzerland) placed at the distal forearm and distal upper arm, respectively. Both devices were calibrated using conventional goniometry. The trajectory measurements were acquired using an Arduino microcontroller unit (Smart Projects, Turin, Italy). ECoG data were synchronized with the trajectory signals using a common pulse train sent to both acquisition systems.
Each type of movement was performed at fast, moderate, and slow speeds (see Table 1 for details) as guided by a computer animation (a pair of moving sticks) representing the moving joint (see Fig. 1). Subjects were familiarized with each movement task by previewing the corresponding animation and performing a brief practice run. The animation cued the subjects to fully flex the limb segment of interest at the specified speed and subsequently hold this position isometrically for a specific time. The subject was then cued to fully extend at the same speed, followed by holding this position isometrically for a specific time period. These isometric (iso) flexion and extension periods were introduced to prevent potential temporal overlap of ECoG features underlying flexion and extension. The isometric period was set to 3–5 s based on our previous observations (Wang et al, 2014). For each elementary movement type, the above procedure was repeated to generate 40 flexions and 40 extensions. An exception was the slow SFE movement, in which only 20 flexions and 20 extensions were performed in order to prevent subject fatigue. To establish a baseline, subjects were instructed to idle with the joint of interest resting at a neutral position for 30 s before and after these animation- guided movements.
Table 1.
Summary of movement types and speeds. Subjects were cued to 1) perform maximum flexion for the specified duration, 2) hold position for 3–5 s, 3) perform maximum extension for the specified duration, and 4) hold position for 3–5 s. This sequence is repeated 20 or 40 times depending on the movement type
| Movement type | Duration (s) |
||
|---|---|---|---|
| Fast | Moderate | Slow | |
| PG | 0.35 | 0.70 | 1.40 |
| E | 0.65 | 1.30 | 2.60 |
| SFE | 0.75 | 1.50 | 3.00 |
Fig. 1.
Screen shots of the computer animations that guide each movement task. The green segments, which represent the moving limb, rotate around the articulation point within the range of motion defined by the gray segments (not shown in the actual animation). The blue segments remain stationary and represent the forearm, upper arm, and torso in PG, E, and SFE movements, respectively.
2.4. Analysis
2.4.1. Identification of M1 Channels
Only electrodes placed over M1 were used in the analysis. First, MRI and computed tomography (CT) scans of the head were co-registered as described in (Wang et al, 2013c), and all ECoG electrode locations were determined. Subsequently, M1 was defined as the anatomical region between the central and pre-central sulci, and electrodes overlying this area were identified.
2.4.2. High-γ Power Calculation
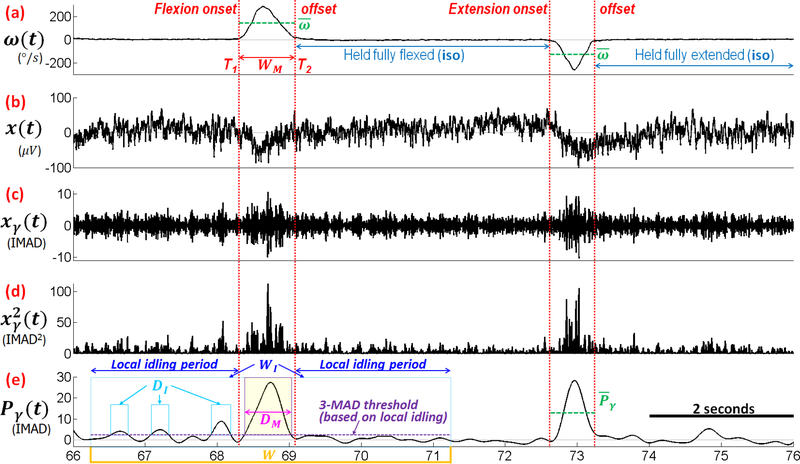
Since the high-γ band has been shown to be strongly modulated with motor behavior (Crone et al, 1998a,b; Pfurtscheller et al, 2003; Wang et al, 2013a), the analysis focused on determining the relationship of high-γ power in M1 with movement speed and duration. For each channel, the ECoG signal, denoted by x(t) (see Fig. 2b), was processed by a cascade of two Butterworth filters (4th order, zero-phase, band-pass: 80–160 Hz). The resulting signal (Fig. 2c) was then squared to obtain the instantaneous high-γ band power, (Fig. 2d). The signal was low-pass filtered (≤2.5 Hz, 4th order, zero-phase, Butterworth filter) to create the envelope signal, denoted by Pγ (see Fig. 2e). Note that this step also significantly reduces the noise in .
Fig. 2.
Description of signal segmentation method illustrated on a segment of ECoG and trajectory data from Subject 1. (a): the movement velocity obtained from electrogoniometer/gyroscope measurements; (b): the underlying ECoG signal at a single channel; (c): ECoG signal in the high-γ band (80–160 Hz); (d): the instantaneous power of the high-γ band; (e): the envelope (2.5 Hz low pass filter) of the instantaneous power of high-γ. The segment of data between the red-dotted lines represents an individual movement event. IMAD: idling median absolute deviation (MAD). DI: duration in the idling period where Pγ > threshold. Dm : duration in the movement period where Pγ > threshold. W: 5-s window centered around each movement event. WI: W excluding movement. and : average velocity and average gamma power envelope, respectively. Note that the units of Pγ and xγ are different since Pγ has been re-normalized.
2.4.3. Signal Segmentation
Since high-γ power is expected to be elevated during movement, the first step is to segment the movement trajectories into individual flexion and extension movement events. To this end, the movement velocity, ω, was derived from the electrogoniometer or gyroscope measurements, and time segments where |ω| > 5°/s were identified (Fig. 2a). The onset (T1) and offset (T2) of each movement event were defined as endpoints of these segments. The average velocity during each movement event was characterized by temporal averaging:
| (1) |
Similarly, the average amplitude of the high-γ power envelope during each movement event was characterized (Fig. 2e):
| (2) |
The duration of each flexion and extension event, denoted as WM, was simply calculated as WM = T2 – T1. These quantities are illustrated in Fig. 2a. To determine the duration of a period with an elevated high-γ power during a movement event (DM), a 5-s window (W) was first centered around each movement event. Subsequently, idling periods (WI) were defined by excluding WM from W, and local idling MAD (LMAD) of Pγ were calculated over WI. For each movement event, DM was defined as a duration of the movement period where Pγ > 3 × LMAD. Conversely, DI was defined as a duration of the idling period where Pγ > 3 × LMAD. These quantities are illustrated in Fig. 2e. The values of , , WM, DM, WI, and DI were then used in subsequent spatial, speed class, and regression-based analyses as described further below.
2.4.4. Movement Speed Relabeling
To account for the subjects’ occasional deviations from the animation-guided movements, movement events from all speeds were relabeled based on the statistics of or WM, depending on whether the analysis examined the high-γ power (Section 2.4.5) or duration (Section 2.4.6), respectively. For example, if the subject was instructed to make fast movements but could not keep up with the animation, such movements may need to be relabeled according to derived from the motion sensor data. Similarly, if the subject did not complete a movement across the full range of motion even if the assigned speed was achieved, WM would be expected to be shorter and would therefore require relabeling. To this end, either or WM across movement events were modeled as a mixture of three Gaussian distributions (one for each speed class) and a uniform distribution to model outliers (Fraley and Raftery, 1998; Nenadic and Burdick, 2006). The parameters of this mixture were estimated using the expectation-maximization algorithm (Dempster et al, 1977). A movement event was assigned to a speed class if its membership probability to the corresponding Gaussian component was greater than 0.75. Note that this corresponds to the Bayes factor >3, thus providing substantial evidence for class assignment (Kass and Raftery, 1995). The remaining events were classified as outliers.
2.4.5. Determining Spatial Characteristics of M1 High-γ Activity
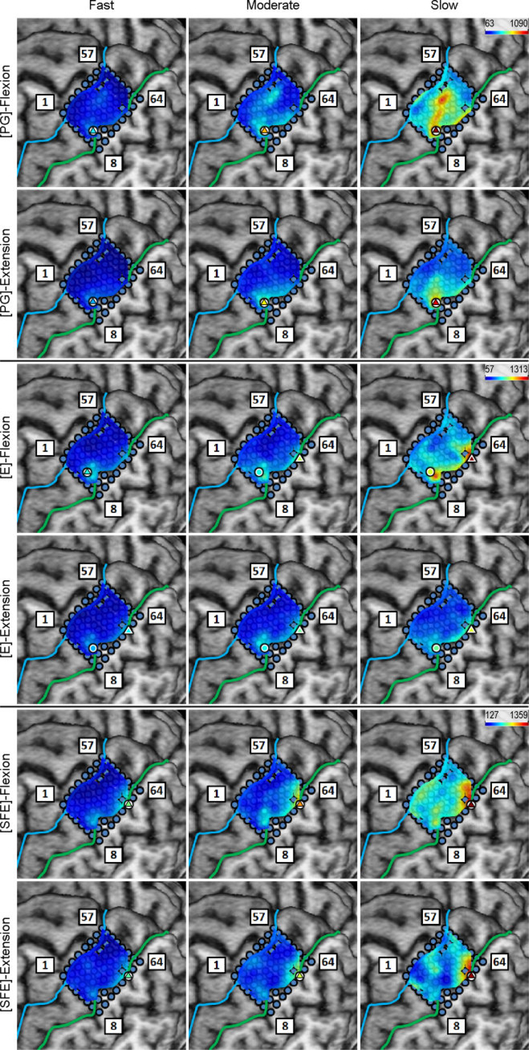
Since ECoG grid placement is guided by clinical needs, the extent of M1 coverage is expected to vary among subjects. Therefore, to determine which movements’ representation areas were covered, a brain map of was generated. First, for each movement type and speed, the average across all flexion and extension movements was overlaid onto the brain image. This helped localize the involvement of high-γ activity in each movement type. Based on somatotopy, the brain is expected to exhibit strong high-γ signals for PG, E, and SFE in a lateral to medial distribution. To ascertain the presence of such a distribution, the maps for each movement type were summed over the three speeds, and the electrode with the maximum value was designated as the “core electrode.” The locations of the core electrodes across movement types were qualitatively compared to determine if they exhibit a somatotopic distribution. For additional comparison, the during periods of isometrically flexed and extended states (Fig. 2a) were calculated, and their averages were mapped onto the brain image in the same manner.
2.4.6. Determining Spatial Characteristics of M1 High-γ Duration
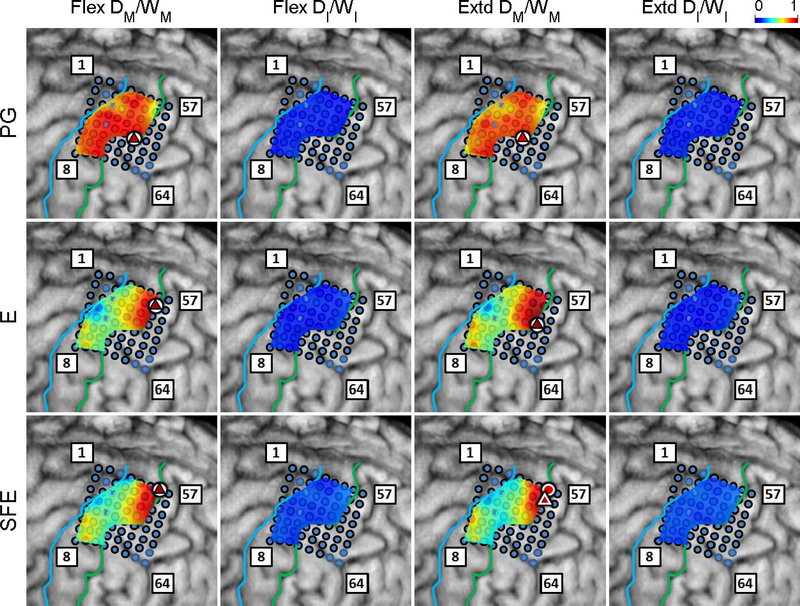
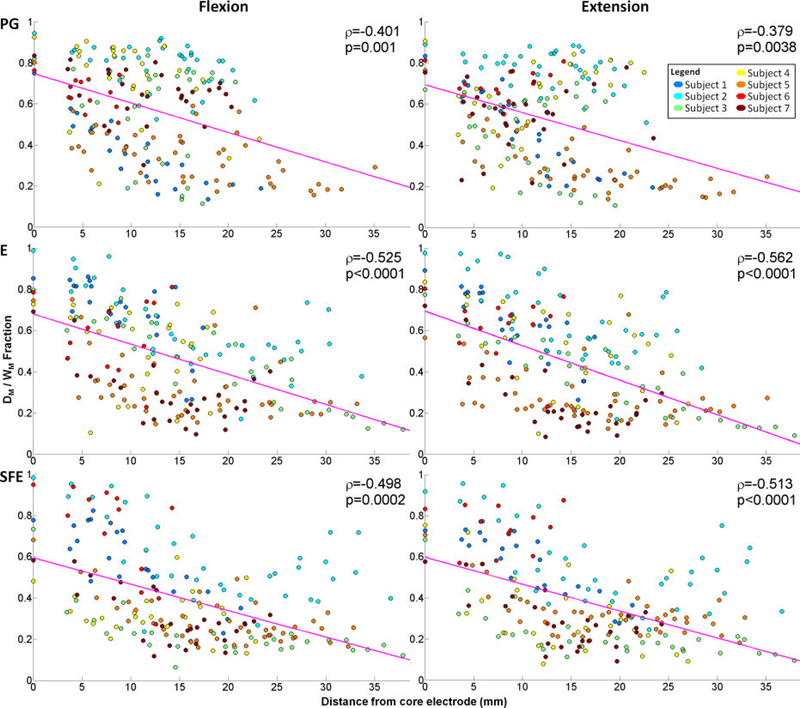
To determine whether high-γ activity persists for the entire duration of a movement event, a map of DM/WM was generated. Note that this normalization also facilitates a meaningful comparison of duration across subjects and speeds. To this end, the ratio DM/WM was averaged across all movement events for each movement type and direction. These values were then projected on to the brain image. Furthermore, to quantify the spatial changes of DM/WM, the maps were aggregated across subjects and represented as scatter plots of DM/WM vs. distance to core electrodes. Correlations were calculated to check whether DM/WM decreased with increasing distance to core electrodes.
To verify that the threshold for the definition of DM (see Section 2.4.3) is appropriate, similar analysis was performed on the idling periods immediately before and after each corresponding movement event (see Fig. 2e). More specifically, the duration of a period with Pγ above the threshold (DI) was divided by the duration of these idling periods (WI). These idling fractions (DI/WI) were then averaged across movement events and mapped onto the brain image. Note that if the threshold was chosen appropriately, Pγ would not be expected to exceed this threshold during idling periods.
2.4.7. Speed Class Comparisons
To determine how high-γ activity varies with movement velocity, for each subject, movement type, speed, and direction, the mean M1 power was first derived by averaging across all M1 channels during each movement event. For comparison, the underlying idling epochs as well as the isometric flexion and extension epochs were also included in the analysis. Note that the baseline idling epochs were derived by dividing the 30-s baseline idling periods into 3-s long segments. To account for varying electrode impedances across subjects and facilitate population level comparison, were standardized. Specifically, for each subject and movement type, was transformed so that its median and MAD during idling were 0 and 1, respectively. Then, for each movement type, speed, and direction, these values were aggregated across all events and subjects. Finally, a Mann-Whitney U test was used to compare the mean M1 power at all pairwise combinations of movement speeds within each movement type and direction.
A similar analysis was used to determine how DM changes with movement velocity. Specifically, for each subject, movement type, speed, and direction, the mean duration was found by averaging DM across those M1 channels where Pγ exceeded the defined threshold (see Section 2.4.3). These values were then aggregated across all detectable movement events (movement events where there was a threshold crossing for at least one M1 channel) and subjects for each movement type, speed, and direction. Likewise, all pairwise combinations of average DM were compared using a Mann-Whitney U test. Note that unlike above, there was no need to standardize the average duration.
2.4.8. Regression-based Analyses
To measure the strength of the linear relationship between and as well as between DM and WM, the coefficients of determination (r2) were calculated, and their spatial distributions were investigated. More specifically, for each subject, movement type, direction, and M1 channel, the values of and were aggregated across all movement events and speed classes. The values of and underlying the fully-flexed and fully-extended isometric epochs were also included in the analysis. From these data, the following linear regression models were estimated:
| (3) |
| (4) |
and the r2 was calculated as the square of the Pearson product-moment correlation coefficient between the variables in each regression model. The r2 values were then projected onto the brain maps.
For each subject, movement, and direction, the distances between the core electrodes and the electrodes with the highest r2 were calculated.
2.4.9. Control Experiment
To determine if viewing the computer animations alone caused any modulation in M1 high-γ signals, two subjects watched the animations for the PG movement at all speeds without making any movements. The underlying ECoG signals were subjected to the same speed class comparisons. Note that for this control analysis, the ω signal was derived from the animations.
3. Results
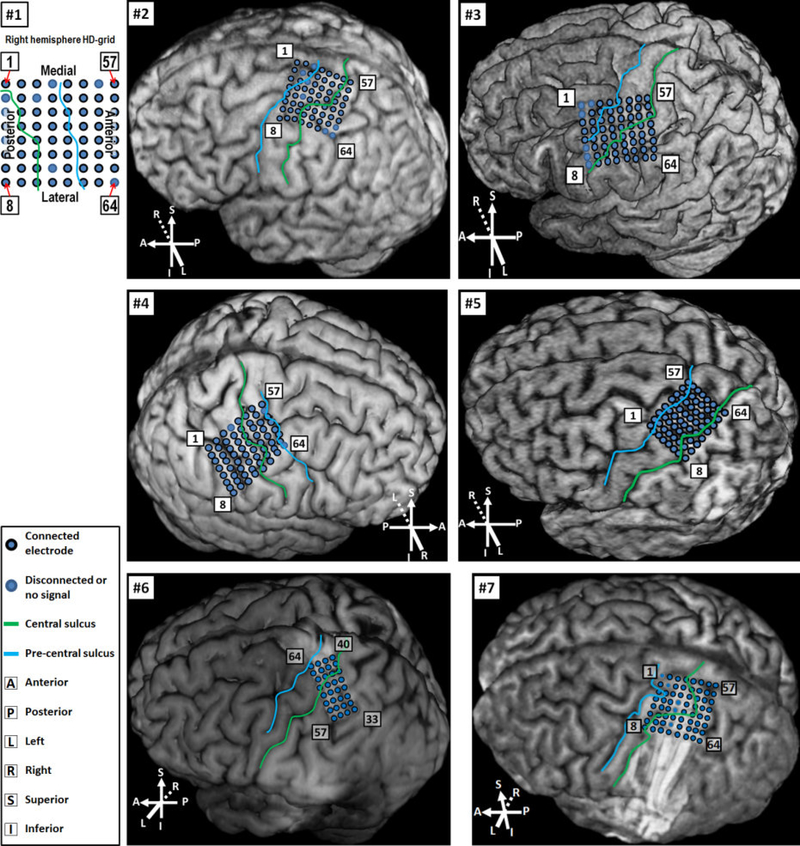
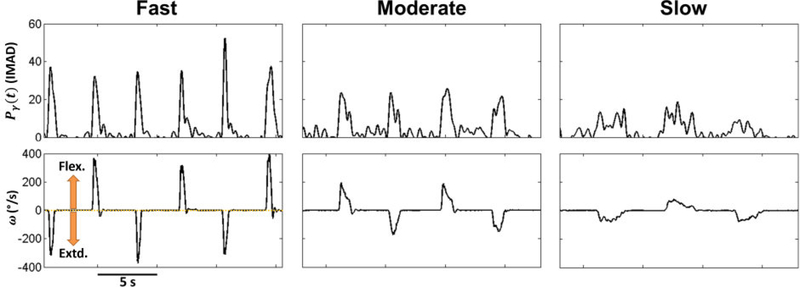
Seven patients implanted with HD-ECoG electrode grids were recruited and gave their informed consent to participate in the study. Their demographic data are presented in Table 2 and their grid locations are shown in Fig. 3. All subjects were able to complete the experiments as described in Section 2.3. The ECoG signals were pre-processed as explained in Section 2.4.2. Representative time series of the resulting Pγ signals are shown in Fig. 4.
Table 2.
Demographic data and the size of ECoG grids used in the study. Subjects may have had additional grids that were implanted outside the area of interest.
| Subject | Age/Sex | Grid Size |
|---|---|---|
| 1 | 38/M | 8×8 |
| 2 | 26/M | 8×8 |
| 3 | 58/F | 8×8 |
| 4 | 33/F | 8×8 |
| 5 | 53/M | 8×8 |
| 6 | 32/F | 4×8 |
| 7 | 24/M | 8×8 |
Fig. 3.
Location of HD-ECoG grids. For Subjects 2–5, locations were determined by the MRI-CT co-registration approach (see Section 2.4.1). For Subjects 6 and 7, grids could be visualized on MRI alone, thus co-registration with CT was not necessary. For Subject 1, MRI scan was not available due to the presence of metal inside his body. Thus, localization was performed by identifying the central sulcus location using pre- and post-implantation CT scans, and the electrode locations relative to the central sulcus and other anatomical landmarks are portrayed here.
Fig. 4.
Top: Representative Pγ time series (Subject 2, electrode #50, see Fig. 3) underlying elbow movements at three different. Bottom: Corresponding ω times series.
3.1. Spatial Coverage
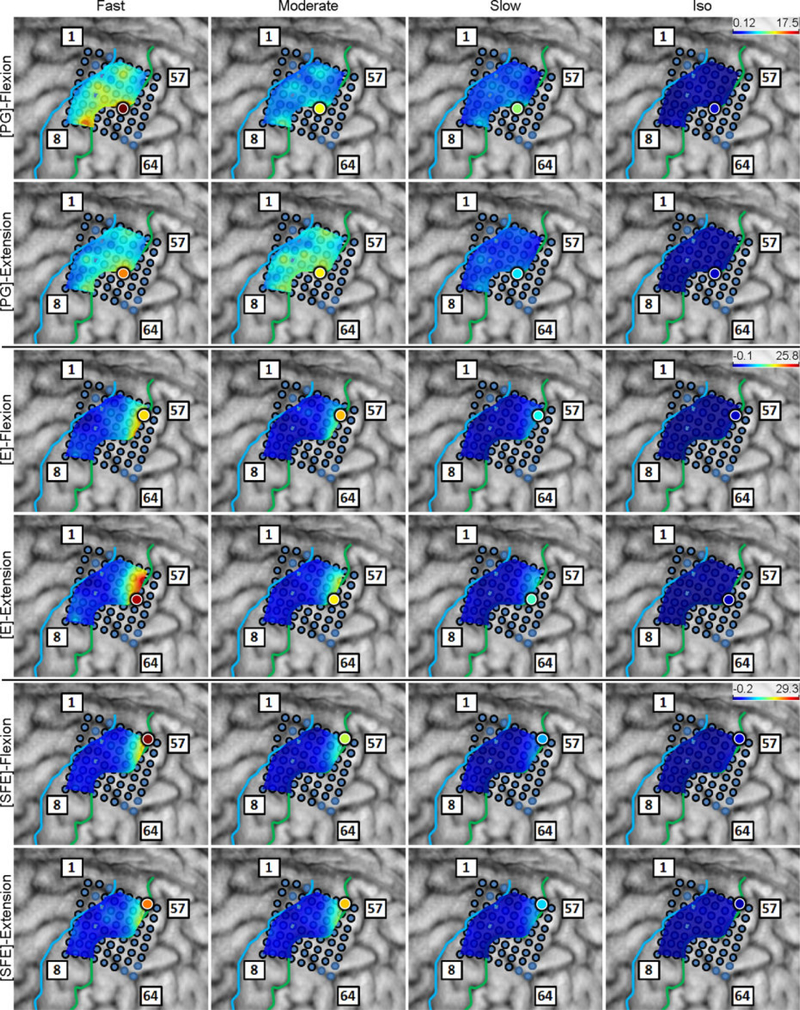
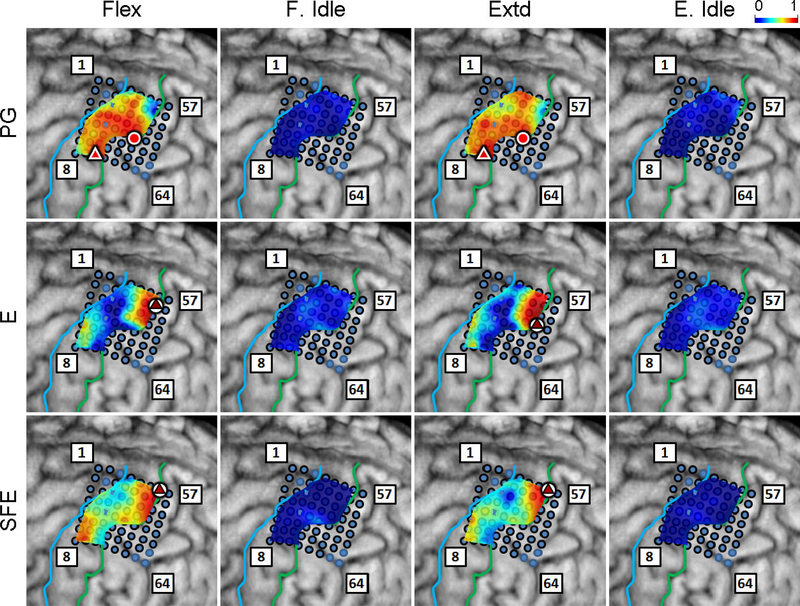
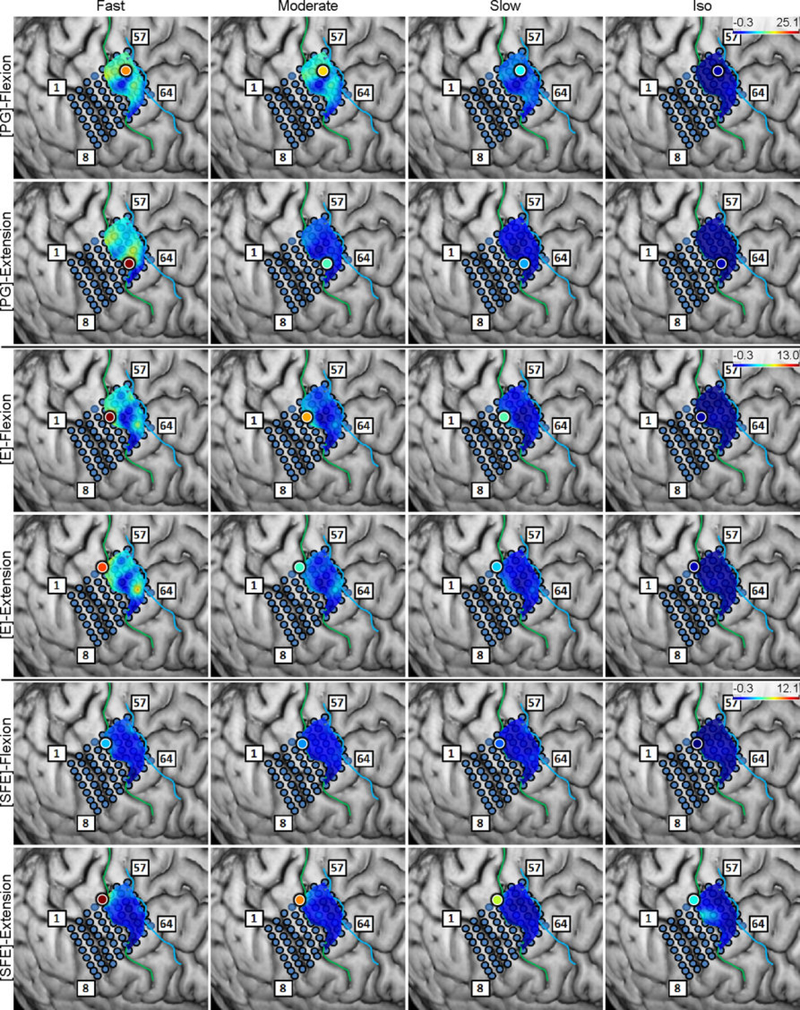
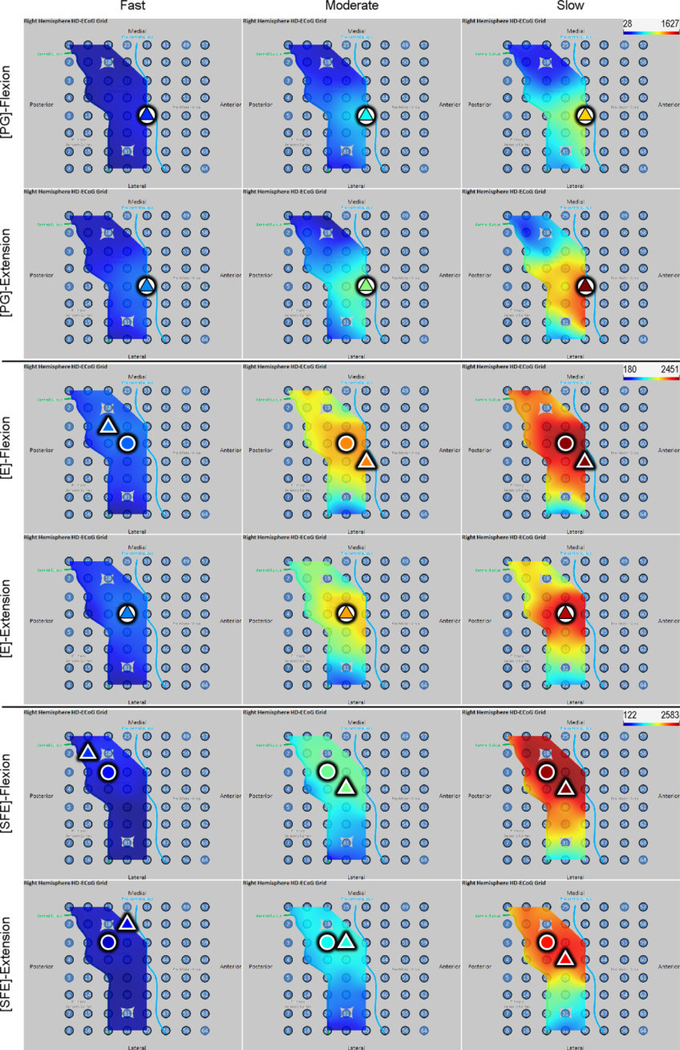
Inspection of the high-γ activity maps confirmed that ECoG grids were placed over the M1 arm area and were able to sense signal modulations for all movement types. The spatial distribution of high-γ power (eq. 2) across all M1 electrodes is shown in Fig. 5 for a representative subject. These spatial maps demonstrated that there were clusters of electrodes exhibiting elevated high-γ activity for all movement types and speeds. These relevant electrodes typically clustered near the core electrode (as defined in Section 2.4.5), and as the movement speed increased, these clusters tended to expand. Moreover, these clusters corresponding to PG, E, and SFE movements were typically spatially organized in a somatotopic lateral-to-medial distribution. Conversely, the activity maps during idling periods showed no high-γ power elevation.
Fig. 5.
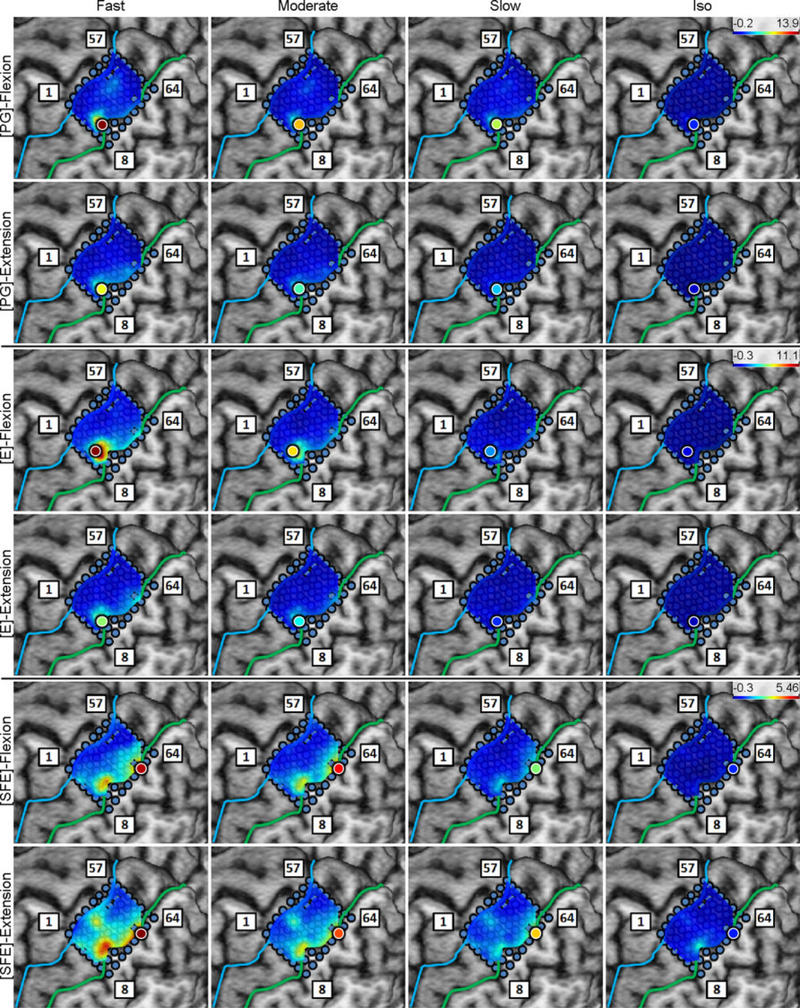
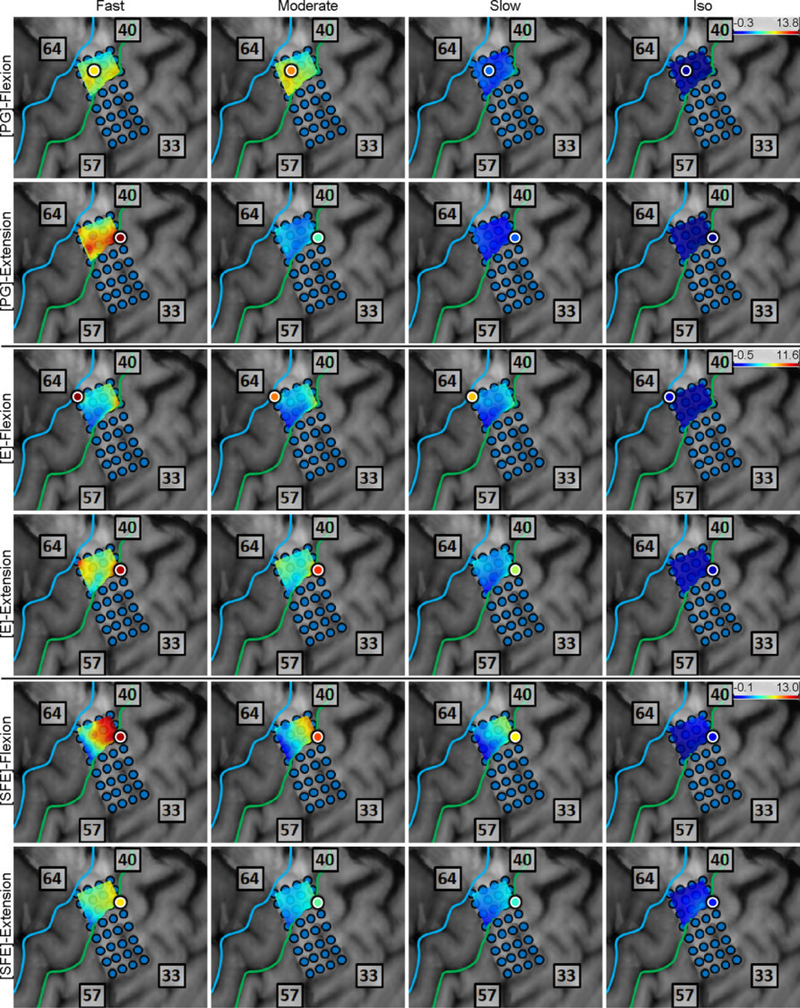
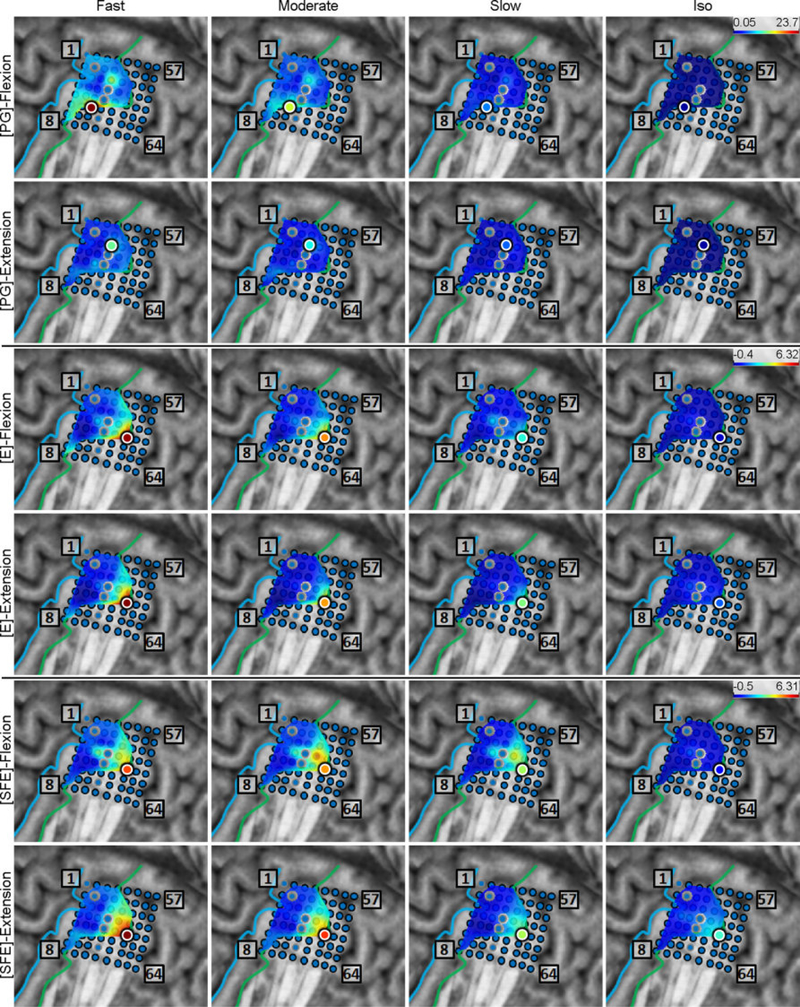
Spatial map of the M1 high-γ power underlying each movement speed-direction combination as well as the isometric (iso) flexion and extension epochs for Subject 2. Note that this is a close-up image of the map seen in Fig. 3. The clusters of relevant electrodes expanded with movement speed. Circles denote the core electrodes (Section 2.4.5). Equivalent figures for the remaining subjects are provided in Appendix A.
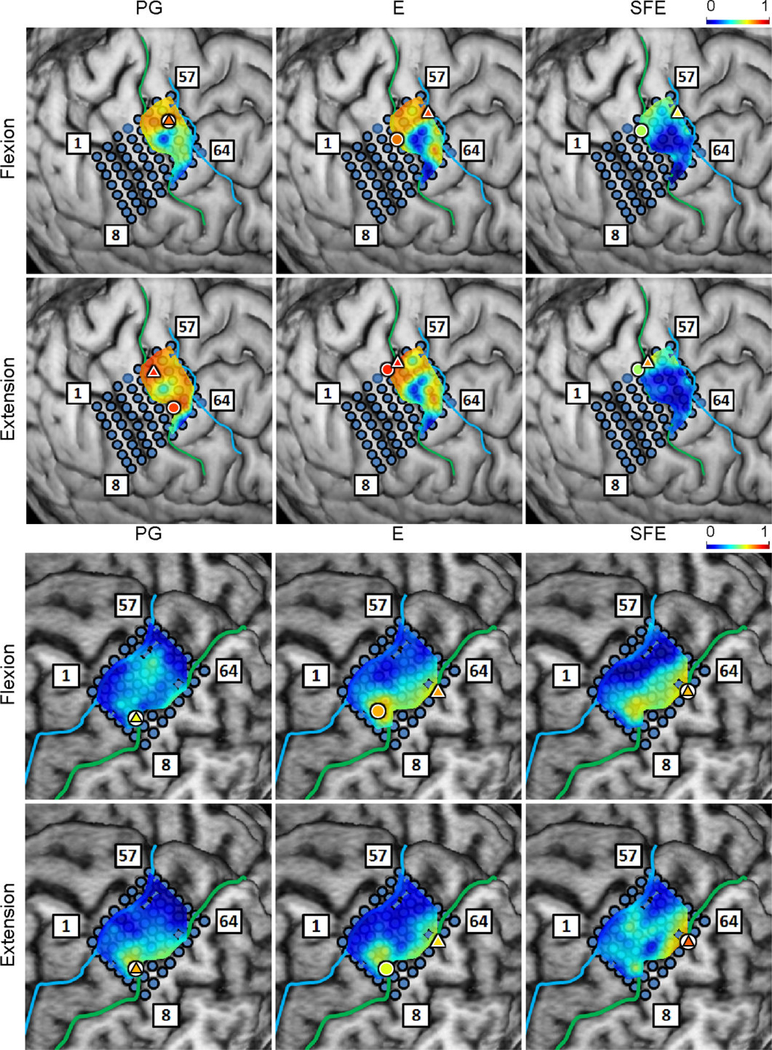
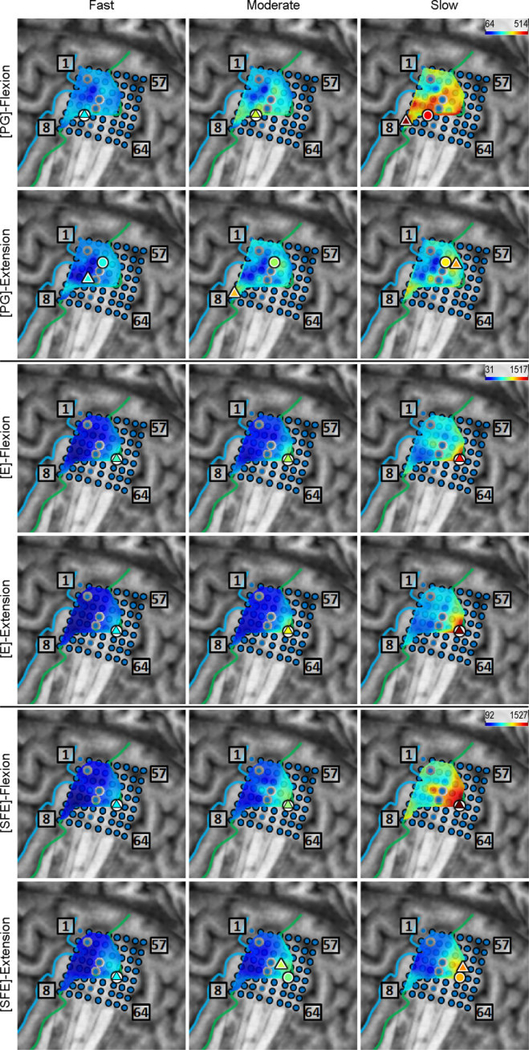
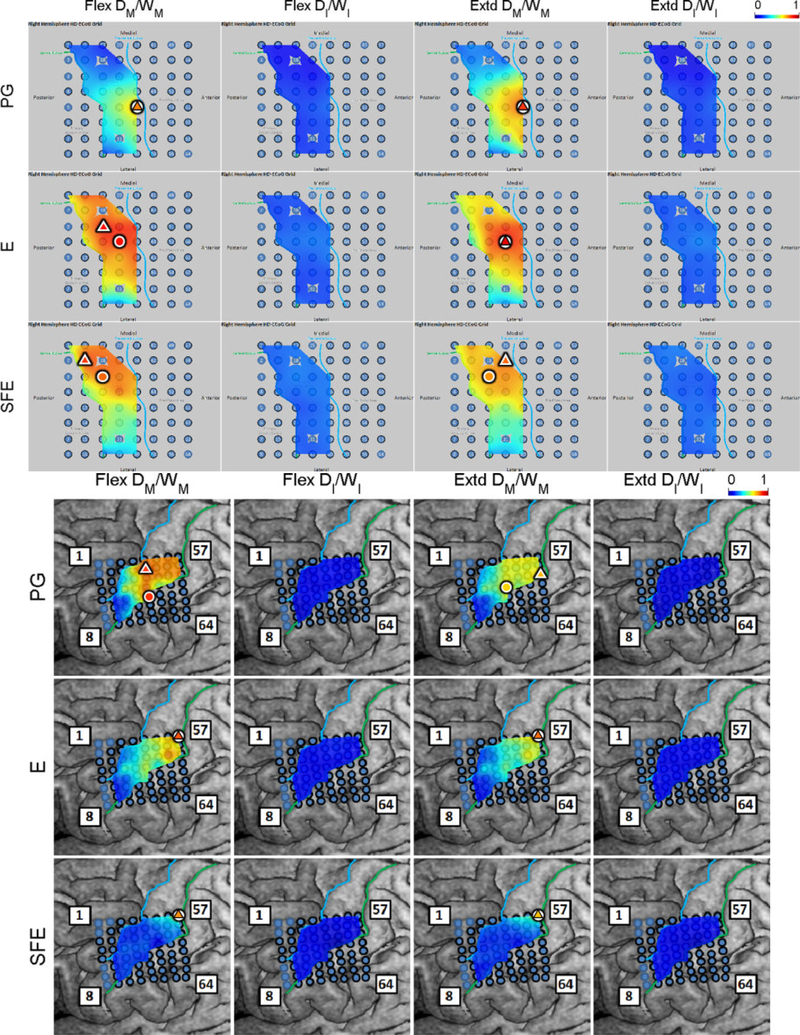
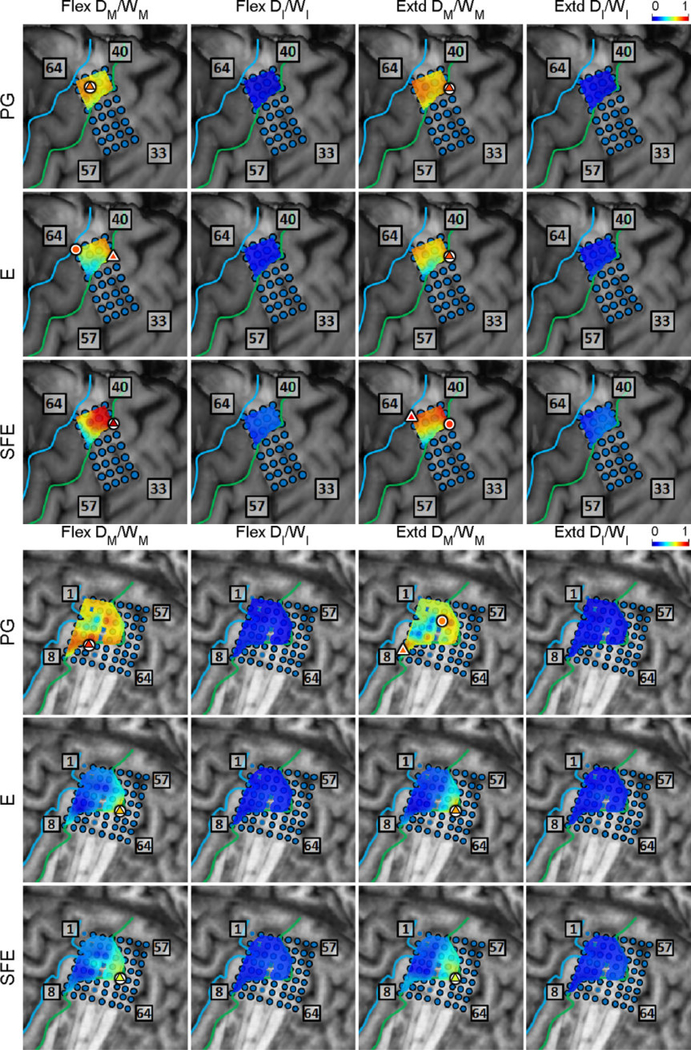
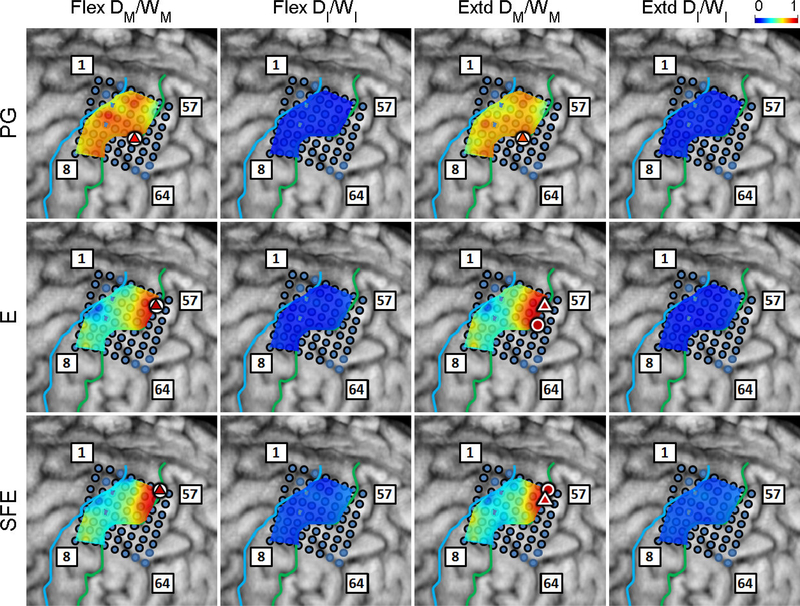
The DM/WM and DI/WI proportions were determined as explained in Section 2.4.6 and are shown in Fig. 6 for a representative subject. Generally, these maps indicate that there are clusters of channels that exhibit higher values of DM/WM, and this proportion drops with distance from the core electrode. Conversely, the values DI/WI are predominantly zero during idling epochs.
Fig. 6.
Spatial map of the per-channel ratios DM/WM and DI/WI averaged across all movement speeds and events for Subject 2. Circle: core electrodes. Triangle: electrodes with the highest averaged DM/WM for each specific movement and direction. The color of each symbol indicates the electrode’s DM/WM value. Spatial maps for the other subjects as well as the raw DM values can be found in Appendix B.
The scatter plots of DM/WM fraction versus the distance from the core electrode were generated as explained in Section 2.4.6 and are shown in Fig. 7. For each movement type and direction, DM/WM was inversely correlated with the distance from the core electrode (average correlation coefficient: −0.480). All of the correlation coefficients were statistically significant, with the highest (worst-case) p-value being 0.0038, as ascertained by Monte Carlo simulations.
Fig. 7.
The ration DM/Wm averaged across all movement speeds and events at each electrode vs. the distance of the electrode from the core electrode. Data is pooled across all subjects for each movement type and direction. Magenta line: best linear fit; ρ: correlation coefficient; p: empirically determined p-value using auto-regressive model and 10000 Monte Carlo iterations.
3.2. Speed Class Comparison Results
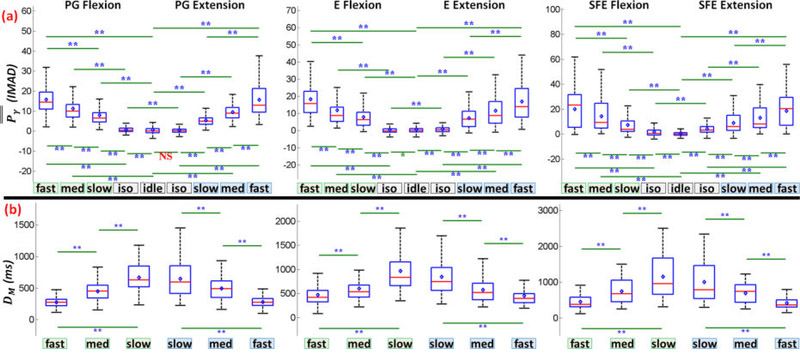
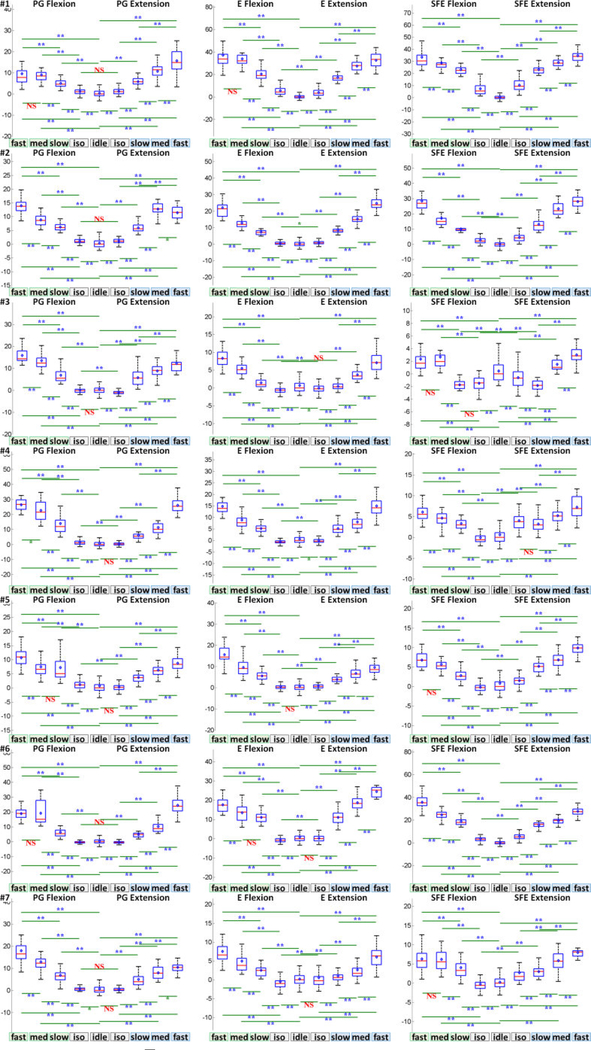
The speed class comparison analysis was performed as described in Section 2.4.7 and the results are summarized in Fig. 8a. Note that a total of 23.6% and 27.7% of movement events were relabeled to another speed class based on the statistics of and WM, respectively, to account for deviations described in 2.4.4. Fig. 8a demonstrates that the mean and variance of M1 high-γ power, , increased with movement speed for all movement types and directions. In addition, the values of were significantly different across all pairwise combinations of movement speeds, idling epochs, and isometric epochs. The only exception was the combination of idling and isometric PG extension. A similar analysis was performed for the high-γ duration (DM), and the results are summarized (Fig. 8b). Unlike , the mean and variance of DM decreased with movement speed for all movement types and directions. Similarly, the values of DM were significantly different across all pairwise combinations of movement speeds.
Fig. 8.
(a) Box and whisker graphs of for each movement type, speed, and direction, aggregated across all subjects and movement events (Section 2.4.7). Each box and whisker population has a sample size of n = # subjects × # movement events. (b) Box and whisker graphs of DM averaged across M1 channels under each movement type, speed, and direction, aggregated across all subjects and movement events. Each box and whisker population has a sample size of n = # subjects × # detectable movement events. Red line: median; blue diamond: mean; box: first and third quartiles of data; bottom whisker: 1st quartile - 1.5 × interquartile range (IQR); top whisker: 3rd quartile + 1.5 × IQR; *: p<0.05; **: p<0.01. Equivalent graphs for individual subjects are shown in Figs. 21 and 35 in the Appendix.
3.3. Regression-based Analyses
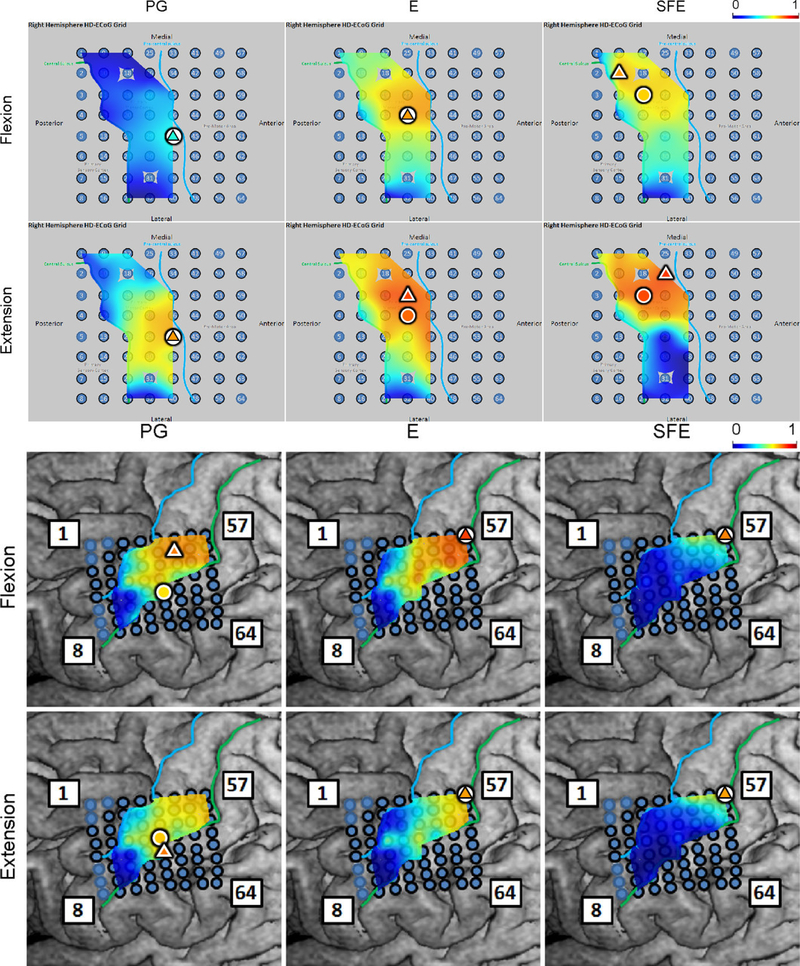
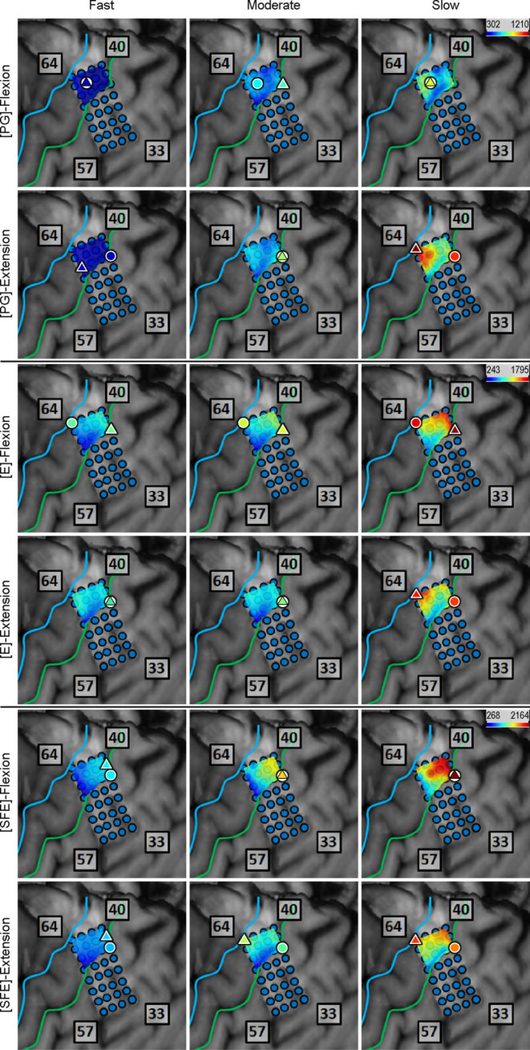
Regression analyses were performed for vs. and for DM vs. WM, and the coefficient of determination, r2, was calculated on a per-electrode basis for each subject, movement type, and direction (see Section 2.4.8). The resulting r2 values were mapped onto the brain image. A representative map of the r2 between and is shown in Fig. 9. From these maps, clusters of electrodes “relevant” for encoding movement velocity are identified as those exhibiting elevated r2 values, nominally defined as electrodes with r2 > 0.5. The maximum r2 values over channels were categorized into movement types and directions and are presented in Table 3. Interestingly, the electrodes with the highest r2 were not always the core electrodes. However, they were often close to each other. The distances between them are also summarized in the table. The per-subject r2 values and distances are provided in Tables A1 and A2.
Fig. 9.
Spatial maps of the per-channel coefficient of determination (r2) between and aggregated across all movement events and speeds for Subject 2. Circle: core electrode. Triangle: electrode with the highest r2 for each panel. The color of each symbol indicates the electrode’s r2 value. Maps for the remaining subjects can be found in Appendix A.
Table 3.
Summary of the maximum r2 values averaged across subjects (n=7) and the distances (in mm) between the core electrode and the electrode with the highest r2 (Pdist for vs. , and Ddist for DM vs. WM). The averages for r2 and distances are derived from means and medians, respectively
| Movement | vs. | DM vs. WM | Pdist | Ddist |
|---|---|---|---|---|
| PG Flex. | 0.68±0.13 | 0.69±0.19 | 5.7±8.5 | 0.0±0.0 |
| PG Extd. | 0.76±0.07 | 0.70±0.20 | 3.8±5.6 | 4.5±6.6 |
| E Flex. | 0.79±0.06 | 0.72±0.20 | 7.9±11.6 | 0.0±0.0 |
| E Extd. | 0.78±0.09 | 0.67±0.25 | 4.0±6.0 | 0.0±0.0 |
| SFE Flex. | 0.75±0.11 | 0.69±0.23 | 0.0±0.0 | 4.3±6.4 |
| SFE Extd. | 0.75±0.14 | 0.63±0.24 | 4.0±2.5 | 4.3±6.4 |
| Overall Avg. | 0.75±0.10 | 0.68±0.21 | 4.0±5.9 | 0.0±0.0 |
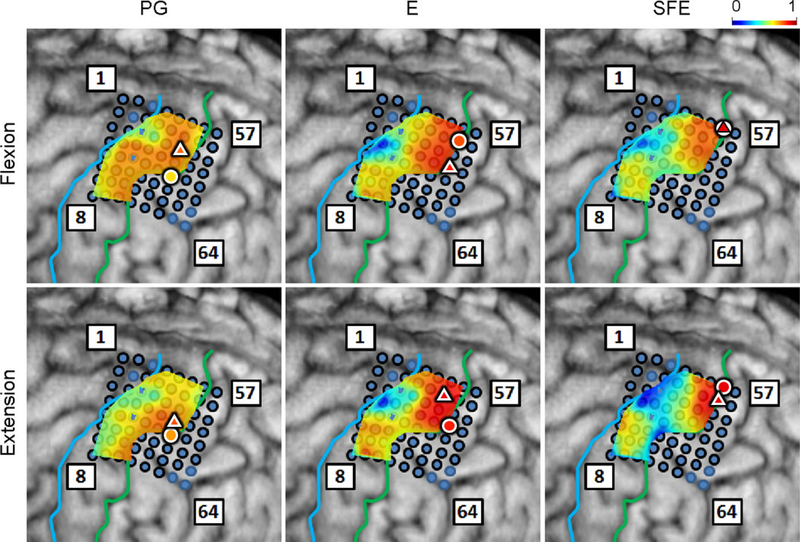
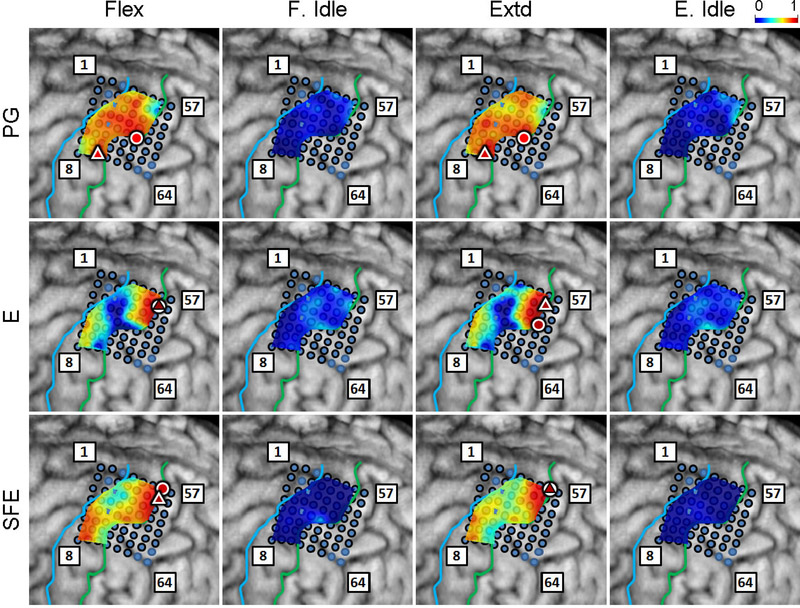
Similarly, the maps of r2 values between DM and WM are shown in Fig. 10 for a representative subject. Likewise, the clusters of electrodes with r2 > 0.5 were considered “relevant” for the encoding of movement duration. Note that the two sets of relevant electrodes (velocity and duration) generally overlapped (details further below). In addition, these clusters typically included the core electrodes. As above, the maximum r2 values and distances were averaged and the results are summarized in Table 3, and the per-subject values are provided in Table A1.
Fig. 10.
Spatial maps of the per-channel coefficient of determination (r2) between DM and WM aggregated across all movement events and speeds for Subject 2. Circle: core electrode. Triangle: electrode with the highest r2 for each panel. The color of each symbol indicates the electrode’s r2 value. Maps for the remaining subjects are provided in Appendix B.
3.4. Control Experiment
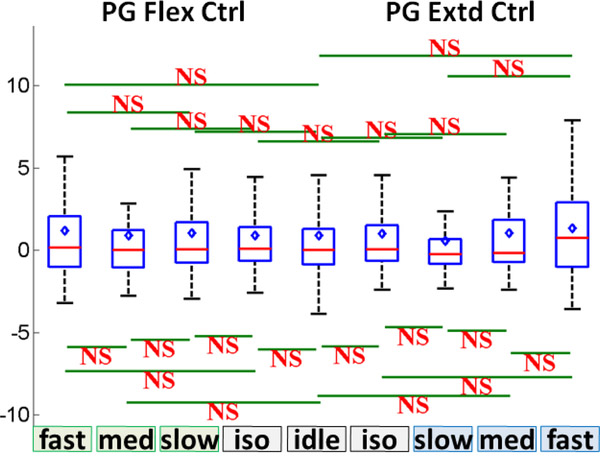
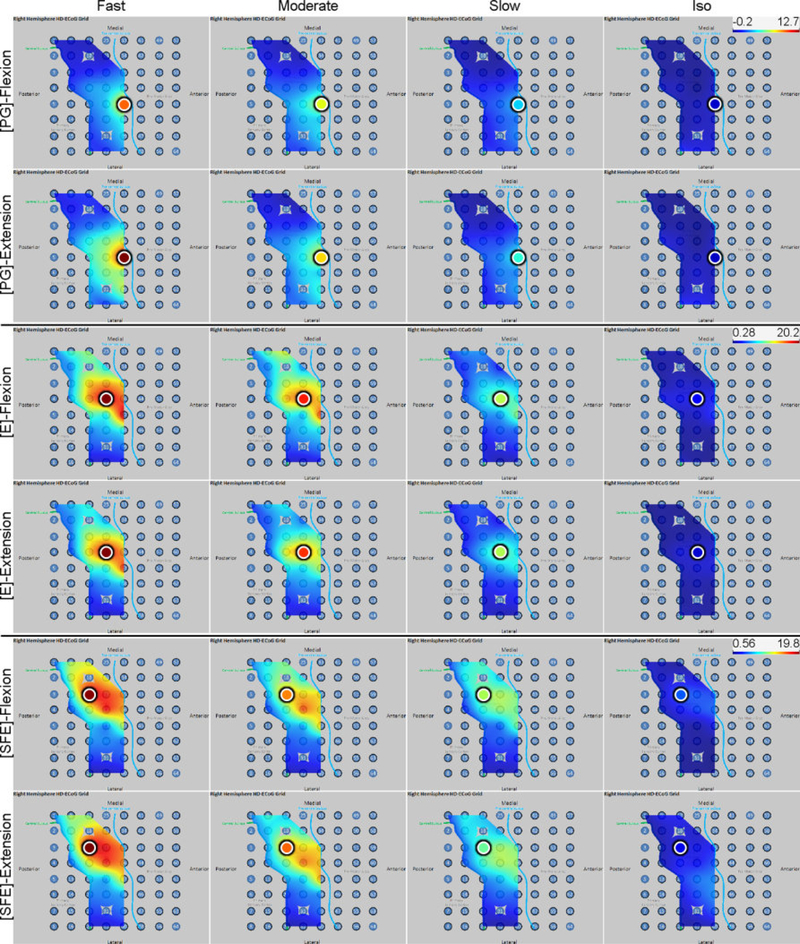
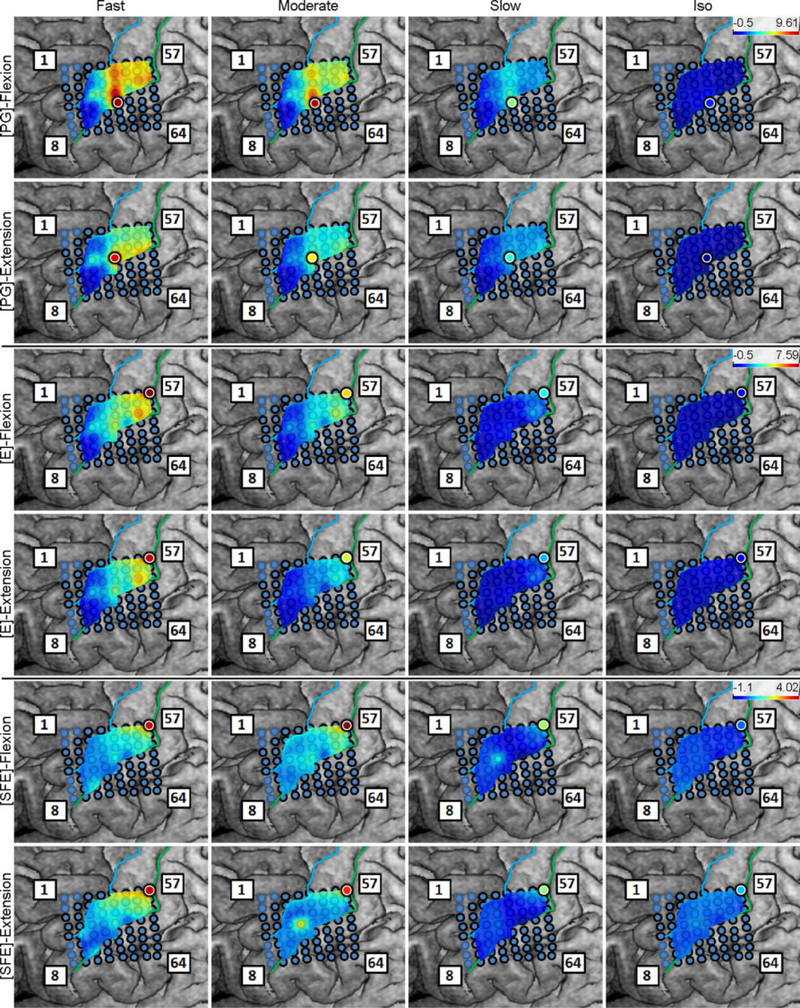
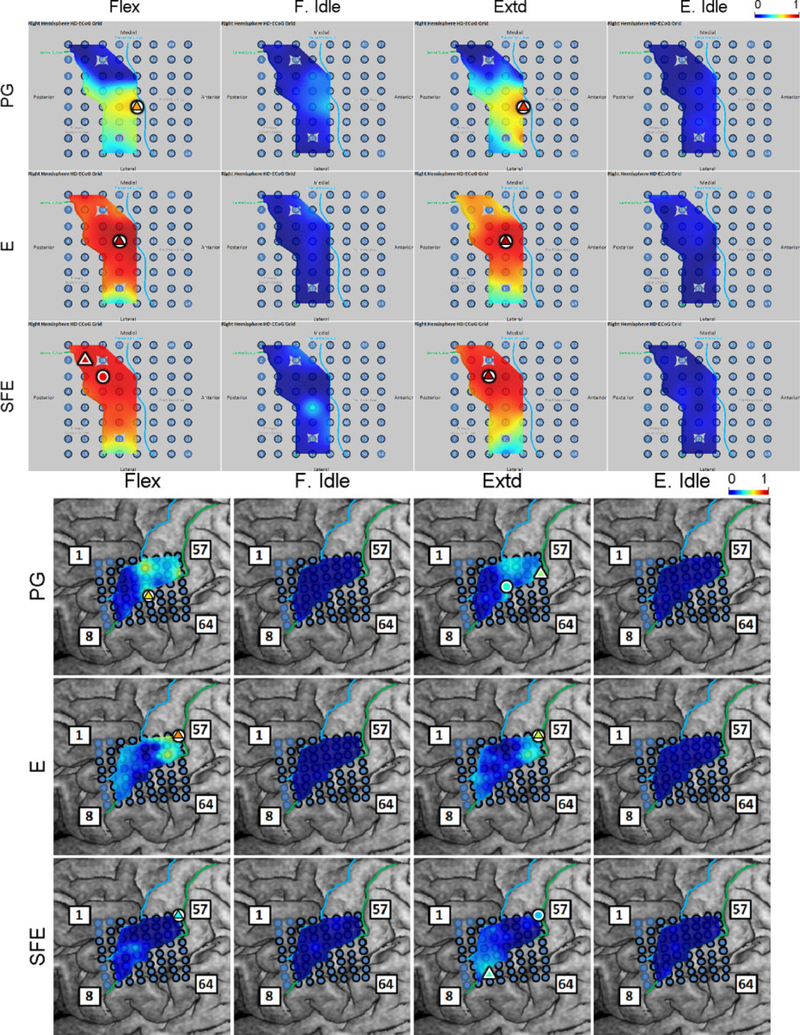
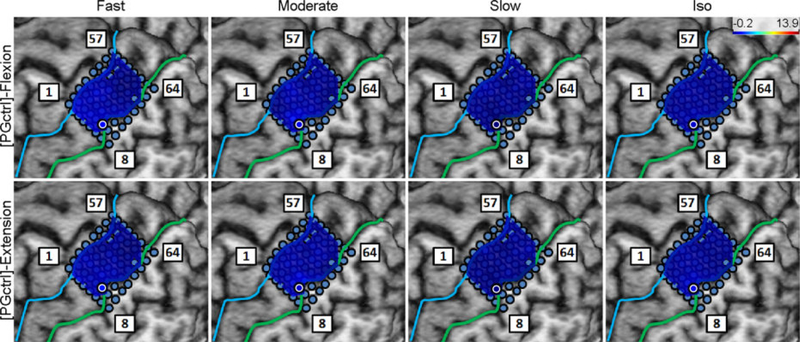
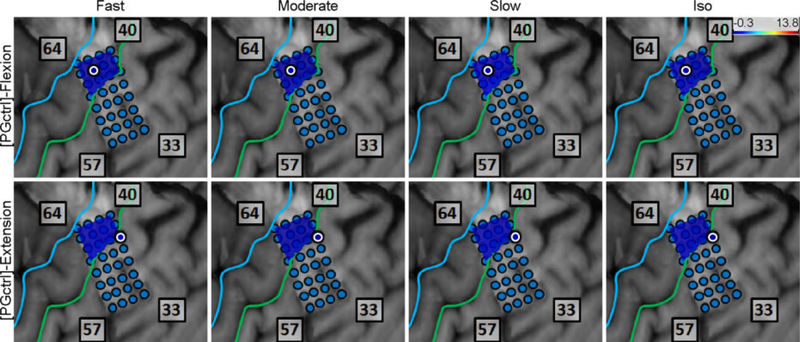
Subjects 5 and 6 watched the computer animations for PG movement at all speeds without making actual movements. The speed class comparison was performed as described in Section 2.4.7, and the results showed no difference in the between all speed classes and idling (see Fig. 11). In addition, the spatial distribution of high-γ power across M1 electrodes exhibited no activity compared to actual movements (see Fig. 36–37). These findings indicate that watching the animations alone did not cause any elevation in M1 high-γ activity as compared to the idling state.
Fig. 11.
Box and whisker graphs of aggregated across Subjects 5 and 6 for the observation of PG movement animations (compare to Fig. 8a). NS: non-significant (p>0.05).
4. Discussion
The main findings of this study are two-fold. First, there are clusters of M1 channels that exhibit high-γ power amplitudes proportional to the speed of three elementary movement types. Second, the duration of the elevated M1 high-γ activity is proportional to the duration of the movement. These findings will be discussed in context of the speed class comparisons and regression analyses below.
4.1. Movement Velocity Encoding
The results in Table 3, Fig. 2, Fig. 8, and Fig. 9 demonstrate that M1 high-γ activity modulates with movement speeds. In addition, the somatotopic features of the high-γ power maps (Fig. 5) and r2 maps (Fig. 9) across most subjects and movement types make the above results anatomically plausible. A straightforward interpretation of these results is that M1 high-γ activity directly encodes movement speeds. An alternative physiological interpretation is that M1 high-γ activity may directly encode for muscle activity, since faster movements require quicker muscle contractions and recruitment of more muscle fibers. This hypothesis is further supported by the fact that high-γ activity during isometric contractions is higher than during the idling state, despite speed being zero under both conditions (see Fig. 8A). However, resolving these competing hypotheses would require repeating this study with the addition of electromyogram (EMG) recordings.
Faster movement speeds were associated with a greater number of channels with increased high-γ power (Fig. 5). This suggests that a spatial recruitment phenomenon may be occurring, in which additional M1 areas become active when a higher movement speed is required. These recruited areas were typically centered around core electrodes, suggesting that there are core M1 areas responsible for slower movements while surrounding peripheral areas are activated with faster movements. It is noteworthy that this recruitment phenomenon bears resemblance to the spatial recruitment process in neuromuscular motor units (Person, 1974), which raises the possibility that spatial recruitment of M1 areas drives motor unit recruitment.
4.2. Movement Duration Encoding
The results in Table 3, Figs. 8 and 10 indicate that M1 controls the duration of movement by continuously generating elevated high-γ activity for a period of time that is proportional to the intended movement duration. Furthermore, Fig. 6 and 7 show that this observation is most pronounced in core channels and those nearby, and less so in channels that are further away. More specifically, the period of elevated high-γ activity in peripheral areas is shorter compared to those of the core areas. Consistent with the above hypothesis, it is possible that these peripheral areas are “recruited” only briefly, i.e. when ω reaches its peak values during each movement event.
4.3. Comparison to Prior Findings
To the best of our knowledge, a comprehensive investigation of ECoG signals underlying systematic variations in the speed and duration of elementary upper extremity movements has not been performed. Nevertheless, the results observed in this study are consistent with a number of prior studies examining neuronal encoding of upper extremity movements. At the same time, the current study reports on physiological phenomena not described elsewhere.
Crone et al (1998a) showed that the high-γ band (75–100 Hz) exhibited a transient event-related synchronization in response to fist clenching movements. A generalization of this phenomenon was observed in this study at 3 upper extremity joints, albeit with a different high-γ definition. In addition, they observed movement-related high-γ modulation in only 3 out of 5 subjects and only for a single movement type. In contrast, the present study found this to be true in all 7 subjects and across 3 movement types. Also, the lack of movement trajectory or force data in (Crone et al, 1998a) makes it difficult to draw further comparisons. Similarly, both Anderson et al (2012) and Hammer et al (2016) have demonstrated that hand speed is proportional to ECoG high-γ power during natural hand/arm movement tasks. However, they did not vary movement speed or duration in a systematic manner, which may have been responsible for the modest degree of high-γ modulation. Furthermore, executing these tasks requires a combination of two or more elementary arm movements, which may confound the interpretation of their findings. In addition, the lack of MRI/CT data in (Anderson et al, 2012) precludes interpretation of their results in a spatial context. In contrast, the current study focused on elementary movements as well as the spatial distribution of high-γ activity, which revealed that individual joints not only have somatotopic representation, but that each of these representation areas exhibit a spatial recruitment phenomenon as the movement speed increases.
Microelectrode recordings from M1 of non-human primates have also indicated that increasing the upper extremity movement force is associated with higher neuronal firing rates (Cheney and Fetz, 1980; Evarts, 1968; Humphrey et al, 1970). However, these findings are limited to only a very focal area of the brain due to the narrow spatial coverage of microelectrodes. On the other hand, despite lower temporal resolution, the increased ECoG spatial coverage allowed us to observe that M1 recruitment occurs as force/speed increases. Note that testing the “recruitment hypothesis” with microelectrodes will require surgical implantation of multiple spatially distributed microelectrode arrays and will likely limit such a study to non-human primates only.
Human upper extremity movements have also been studied using functional neuroimaging approaches, such as fMRI and PET. For example, Turner et al (1998) used PET to show that M1 regional cerebral blood flow (rCBF) is correlated with the velocity of shoulder rotation. Similarly, fMRI studies showed that finger movement velocity is correlated with the M1 BOLD signal (Jäncke et al, 1999; Lutz et al, 2004). However, the limited temporal resolution of these neuroimaging techniques precludes analysis on time scales of individual movements as performed in the present study. Furthermore, since movements within PET and MRI scanners are constrained by limited space and susceptibility to motion artifacts, these methods are not conducive to comprehensive examination of upper extremity movements as done in the present study.
4.4. Limitations
Since ECoG grid placement was guided by clinical needs, it is unlikely that optimal M1 coverage was achieved for all subjects and movement types. This may have been exacerbated by the small size of the HD-ECoG grids (compared to standard ECoG grids), which makes it less likely to cover the entire motor representation area of the arm with a single grid. In addition, many core channels were found along the central sulcus, which may indicate that intrasulcal areas could play a significant role in the encoding of movement velocity. Testing of this hypothesis would require implanting electrodes into the intrasulcal areas, which cannot be achieved with typical ECoG implantation techniques.
Given that subject selection was limited to those with ECoG grids over the M1 upper extremity representation area, other motor-relevant areas, such as the supplementary motor cortex and premotor cortex, were not consistently covered. This precluded systematic examination of the role of these areas in the encoding of upper extremity movement speed and duration.
The experimental design required subjects to follow pacing animations on a computer screen, which presumably involved a higher level of attention. Prior neuroimaging studies suggest that execution of complex and simple finger movements involve different neural control mechanisms (Wiestler and Diedrichsen, 2013). However, the reports on M1’s role in these tasks are conflicting (Wexler et al, 1997; Shibasaki et al, 1993). Therefore, it is unclear if the M1 electrophysiological patterns observed in the current study will generalize to situations where subjects are performing motor tasks requiring less attentional demand. Answering this question would require a new set of experiments.
Finally, the study was limited to 3 elementary upper extremity movement types, and so it is not known whether the patterns observed here generalize to other types of elementary arm movements. However, given the fact that these 3 movement types span the breadth of the arm motor cortex, yet show consistent encoding patterns, it can be expected that other movement types not studied here are also encoded in a similar manner.
5. Conclusion
For each type of elementary arm movement, there are M1 areas that generate high-γ activity with the power proportional to movement speed and over a time period proportional to movement duration. These observations provide evidence that M1 plays an important role in encoding of both movement velocity and duration. In addition, faster movements cause high-γ activation over larger M1 areas, suggesting a phenomenon similar to the spatial recruitment process in neuromuscular motor units. Finally, channels that are relevant for encoding movement velocity and duration generally follow somatotopic arrangement. These findings deepen our understanding of the role of M1 in the arm motor control. From a practical standpoint, they may be exploited to extract highly informative features in future brain-computer interface (BCI) applications.
Since moving at higher speeds is confounded by stronger muscle forces, there is a possibility that the observed gamma activity patterns encode muscle activity. Providing a definitive answer to this question requires a separate set of experiments that will be pursued in future studies. Additional studies could also be designed to characterize the physiological features underlying human upper extremity movements from other cortical areas, such as the supplementary motor cortex, premotor cortex, primary sensory cortex, or sensory association areas. These findings could help elucidate the way different cortical areas participate and interact in upper extremity control.
6. Acknowledgments
We thank Angelica Nguyen for her assistance in setting up the experiments and Michael Chen and Aydin Kazgachi for their assistance in fabricating the gyroscopic instruments. This study was supported by the National Science Foundation (Award #1134575).
APPENDIX
A Figures for
Fig. 12.
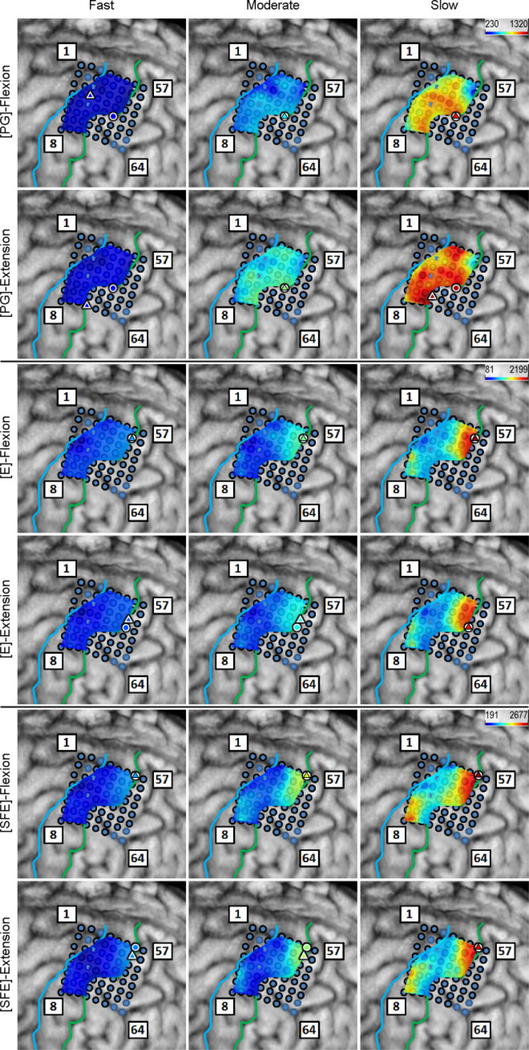
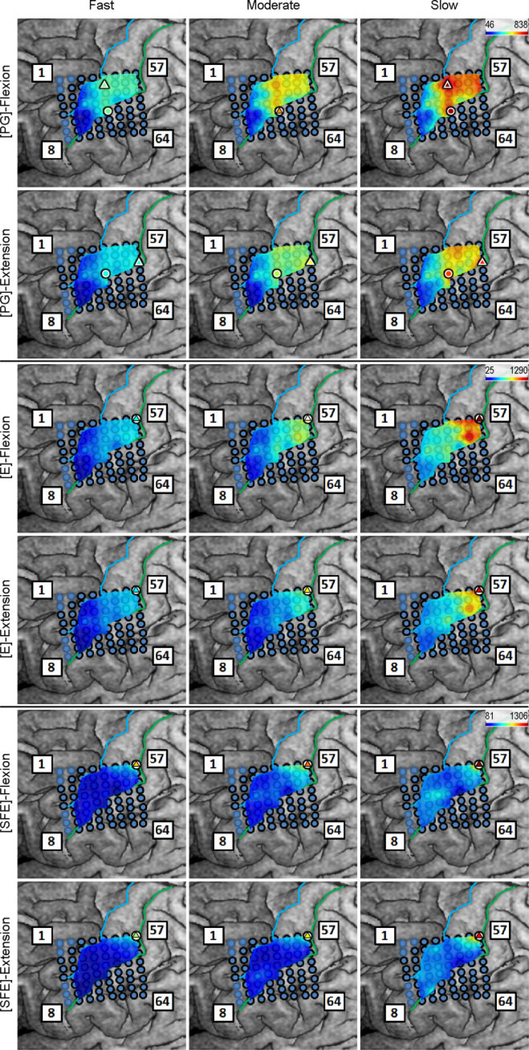
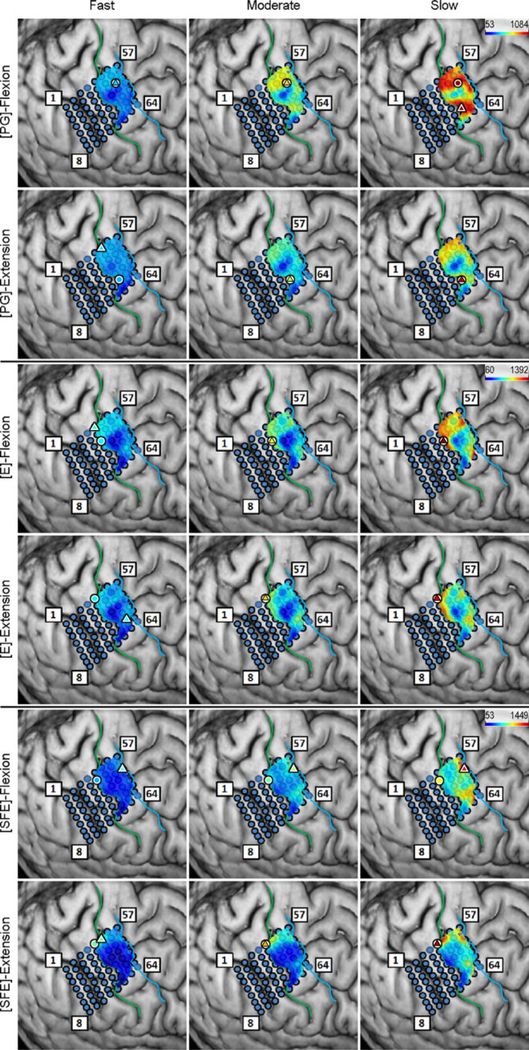
Spatial map of the M1 high-γ power underlying each movement speed-direction combination as well as the isometric flexion and extension epochs for Subject 1. Circles: core electrodes.
Fig. 13.
Spatial map of the M1 high-γ power underlying each movement speed-direction combination as well as the isometric flexion and extension epochs for Subject 3. Circles: core electrodes.
Fig. 14.
Spatial map of the M1 high-γ power underlying each movement speed-direction combination as well as the isometric flexion and extension epochs for Subject 4. Circles: core electrodes.
Fig. 15.
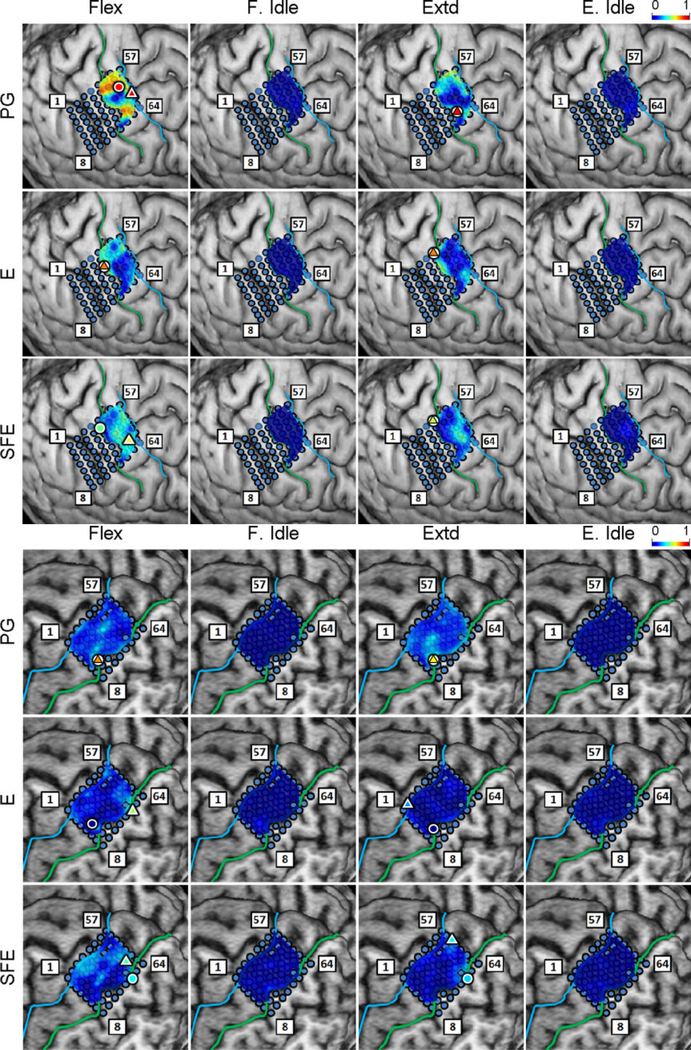
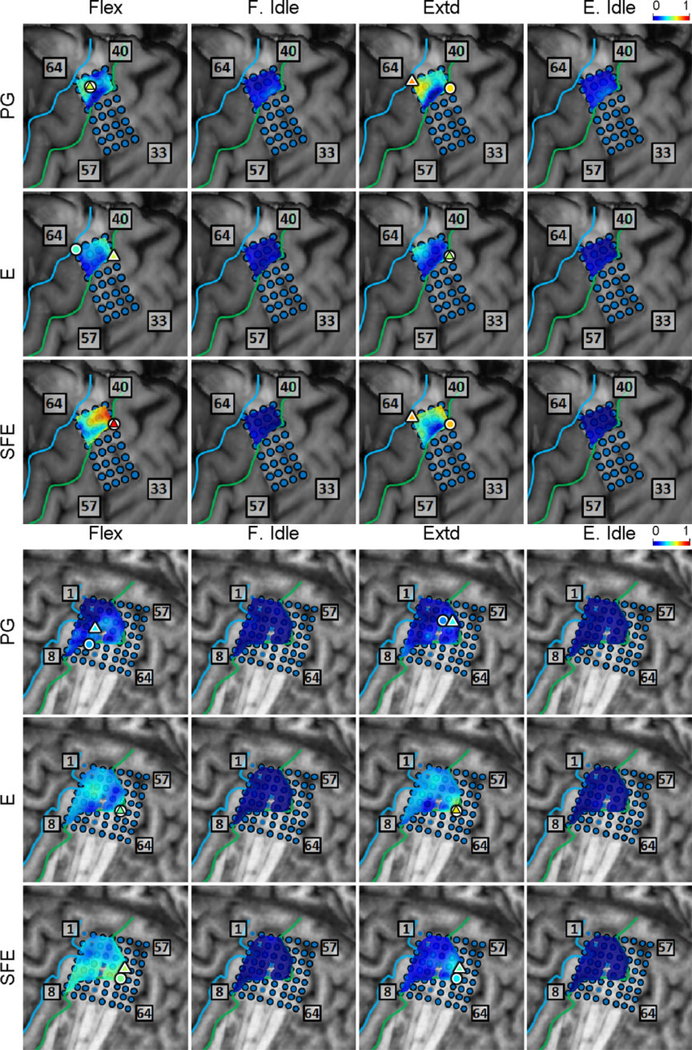
Spatial map of the M1 high-γ power underlying each movement speed-direction combination as well as the isometric flexion and extension epochs for Subject 5. Circles: core electrodes.
Fig. 16.
Spatial map of the M1 high-γ power underlying each movement speed-direction combination as well as the isometric flexion and extension epochs for Subject 6. Circles: core electrodes.
Fig. 17.
Spatial map of the M1 high-γ power underlying each movement speed-direction combination as well as the isometric flexion and extension epochs for Subject 7. Circles: core electrodes.
Fig. 18.
Spatial maps of the per-channel coefficient of determination (r2) between and aggregated across all movement events and speeds for Subjects 1 and 3. Circle: core electrode. Triangle: electrode with the highest r2 for each panel. The color of each symbol is consistent with the r2 value at the corresponding electrode.
Fig. 19.
r2 between and for Subjects 4 and 5. Circle: core electrode. Triangle: electrode with the highest r2 for each panel.
Fig. 20.
r2 between and for Subjects 6 and 7. Circle: core electrode. Triangle: electrode with the highest r2 for each panel.
Fig. 21.
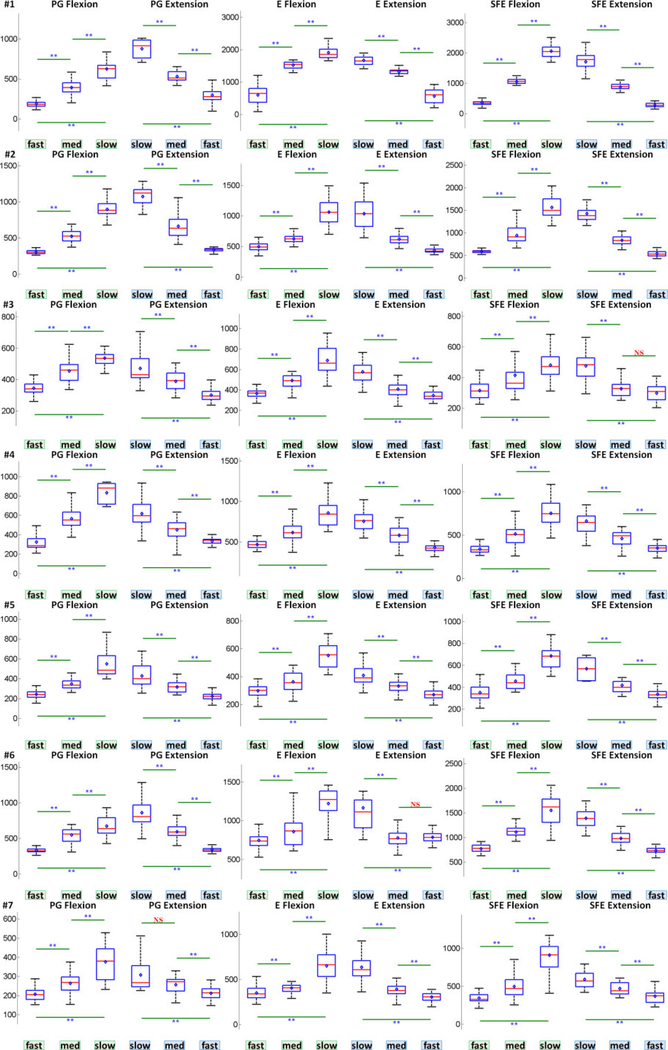
Box and whisker graphs of for individual subjects. The vertical axes are normalized amplitudes (IMAD). NS: nonsignificant (p>0.05); *: p<0.05; **: p<0.01.
B Figures for DM
Fig. 22.
The spatial distribution of DM (in ms) for Subject 1. See Fig. 2 for definition.
Fig. 23.
The spatial distribution of DM (in ms) for Subject 2.
Fig. 24.
The spatial distribution of DM (in ms) for Subject 3.
Fig. 25.
The spatial distribution of DM (in ms) for Subject 4.
Fig. 26.
The spatial distribution of DM (in ms) for Subject 5.
Fig. 27.
The spatial distribution of DM (in ms) for Subject 6.
Fig. 28.
The spatial distribution of DM (in ms) for Subject 7.
Fig. 29.
Spatial maps of the per-channel coefficient of determination (r2) between DM and WM aggregated across all movement events and speeds for Subjects 1 and 3. Circle: core electrode. Triangle: electrode with the highest r2 for each panel. The color of each symbol indicates the electrode’s r2 value.
Fig. 30.
Spatial maps of the per-channel coefficient of determination (r2) between DM and WM aggregated across all movement events and speeds for Subjects 4 and 5. Circle: core electrode. Triangle: electrode with the highest r2 for each panel.
Fig. 31.
Spatial maps of the per-channel coefficient of determination (r2) between DM and WM aggregated across all movement events and speeds for Subjects 6 and 7. Circle: core electrode. Triangle: electrode with the highest r2 for each panel.
Fig. 32.
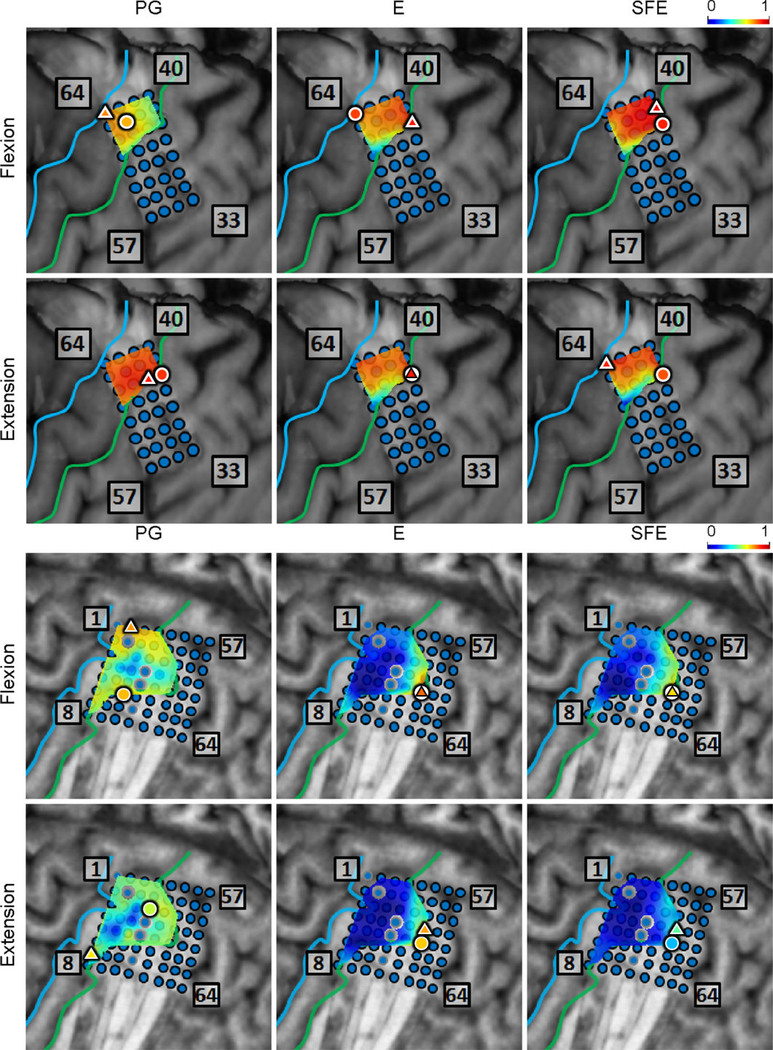
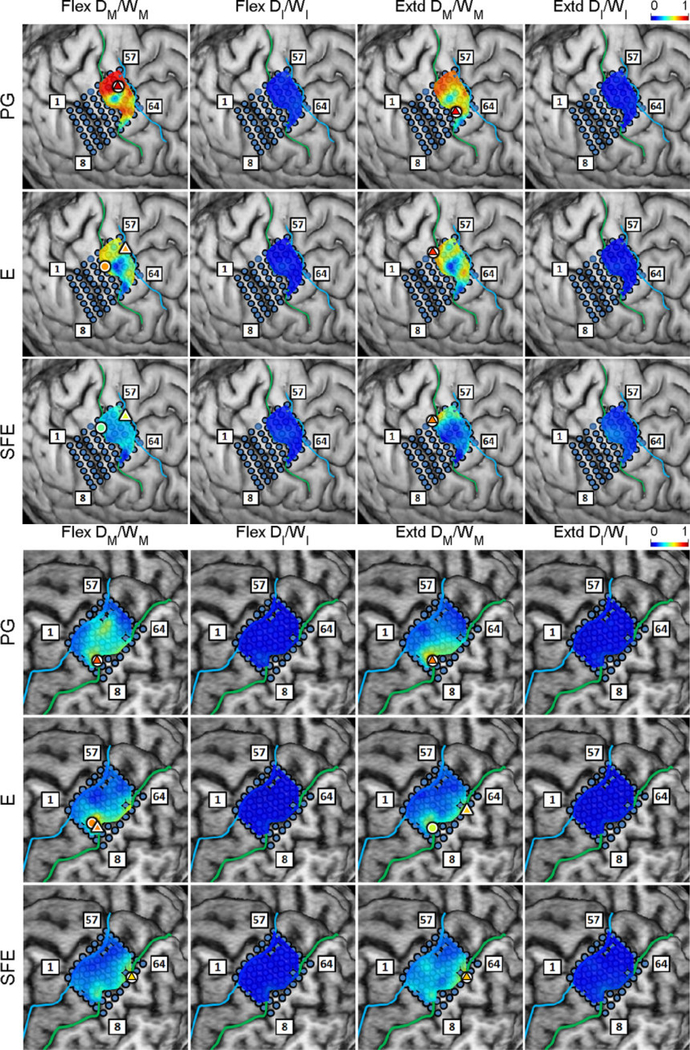
Spatial map of the per-channel ratios DM/WM and DI/WI averaged across all movement speeds and events for Subjects 1 and 3. Circle: core electrodes. Triangle: electrodes with the highest averaged DM/WM for each specific movement and direction. The color of each symbol indicates the electrode’s DM/WM value.
Fig. 33.
Spatial map of the per-channel ratios DM/WM and DI/WI averaged across all movement speeds and events for Subjects 4 and 5. Circle: core electrodes. Triangle: electrodes with the highest averaged DM/WM for each specific movement and direction.
Fig. 34.
Spatial map of the per-channel ratios DM/WM and DI/WI averaged across all movement speeds and events for Subjects 6 and 7. Circle: core electrodes. Triangle: electrodes with the highest averaged DM/WM for each specific movement and direction.
Fig. 35.
Box and whisker graphs of DM for individual subjects. The vertical axes are in ms.
C Figures for control experiments
Fig. 36.
Spatial map of the M1 high-γ power underlying each “speed-direction” combination as well as the isometric “flexion” and “extension” epochs for Subject 5 in the control experiment (no actual movement or exertion of force).
Fig. 37.
Spatial map of the M1 high-γ power underlying each “speed-direction” combination as well as the isometric “flexion” and “extension” epochs for Subject 6 in the control experiment (no actual movement or exertion of force).
D Tables for and DM
Table A1.
r2 values of the electrode with the highest r2 (denoted in parentheses) for every subject, movement, and direction. Average is mean ± 1 sd. The Amplitude r2 were derived from data of all speeds as well as the zero-speed holding epochs between the movements, whereas the Duration r2 were only derived from movement data
| Amplitude | PG | E | SFE | |||
| Subject | Flex | Extd | Flex | Extd | Flex | Extd |
| 1 | 0.41 (#37) | 0.72 (#37) | 0.72 (#28) | 0.81 (#27) | 0.72 (#10) | 0.82 (#26) |
| 2 | 0.77 (#43) | 0.80 (#44) | 0.85 (#52) | 0.89 (#42) | 0.90 (#49) | 0.90 (#50) |
| 3 | 0.75 (#42) | 0.75 (#37) | 0.81 (#57) | 0.72 (#57) | 0.75 (#57) | 0.71 (#57) |
| 4 | 0.77 (#51) | 0.83 (#42) | 0.81 (#59) | 0.85 (#41) | 0.64 (#59) | 0.73 (#41) |
| 5 | 0.61 (#14) | 0.70 (#14) | 0.72 (#48) | 0.66 (#48) | 0.69 (#48) | 0.78 (#48) |
| 6 | 0.74 (#64) | 0.85 (#46) | 0.85 (#38) | 0.86 (#38) | 0.90 (#39) | 0.85 (#64) |
| 7 | 0.72 (#9) | 0.65 (#7) | 0.77 (#45) | 0.71 (#44) | 0.66 (#45) | 0.47 (#44) |
| Average | 0.68±0.13 | 0.76±0.07 | 0.79±0.06 | 0.78±0.09 | 0.75±0.11 | 0.75±0.14 |
| Duration | PG | E | SFE | |||
| Subject | Flex | Extd | Flex | Extd | Flex | Extd |
| 1 | 0.71 (#37) | 0.82 (#37) | 0.95 (#28) | 0.95 (#28) | 0.92 (#10) | 0.94 (#19) |
| 2 | 0.89 (#24) | 0.91 (#24) | 0.99 (#50) | 0.98 (#52) | 0.96 (#49) | 0.96 (#49) |
| 3 | 0.65 (#37) | 0.52 (#59) | 0.73 (#57) | 0.57 (#57) | 0.40 (#57) | 0.44 (#23) |
| 4 | 0.90 (#61) | 0.89 (#46) | 0.76 (#35) | 0.74 (#33) | 0.66 (#54) | 0.55 (#33) |
| 5 | 0.75 (#14) | 0.62 (#14) | 0.53 (#48) | 0.26 (#9) | 0.45 (#54) | 0.36 (#59) |
| 6 | 0.57 (#55) | 0.74 (#64) | 0.58 (#38) | 0.54 (#38) | 0.88 (#38) | 0.71 (#64) |
| 7 | 0.36 (#20) | 0.40 (#35) | 0.48 (#45) | 0.62 (#45) | 0.54 (#44) | 0.46 (#44) |
| Average | 0.69±0.19 | 0.70±0.20 | 0.72±0.20 | 0.67±0.25 | 0.69±0.23 | 0.63±0.24 |
Table A2.
Distance (mm) between the core electrode and the electrode with the highest r2.
| Amplitude | PG | E | SFE | |||
| Subject | Flex | Extd | Flex | Extd | Flex | Extd |
| 1 | 0.0 | 0.0 | 0.0 | 3.7 | 6.0 | 5.7 |
| 2 | 7.5 | 3.9 | 7.9 | 8.6 | 0.0 | 3.9 |
| 3 | 11.6 | 3.8 | 0.0 | 0.0 | 0.0 | 0.0 |
| 4 | 0.0 | 13.7 | 13.6 | 4.0 | 13.6 | 4.0 |
| 5 | 0.0 | 0.0 | 21.0 | 19.3 | 0.0 | 0.0 |
| 6 | 5.7 | 3.6 | 14.5 | 0.0 | 4.2 | 14.5 |
| 7 | 19.8 | 21.4 | 0.0 | 4.3 | 0.0 | 4.3 |
| Median | 5.7±8.5 | 3.8±5.6 | 7.9± 11.6 | 4.0±6.0 | 0.0±0.0 | 4.0±2.5 |
| Duration | PG | E | SFE | |||
| Subject | Flex | Extd | Flex | Extd | Flex | Extd |
| 1 | 0.0 | 0.0 | 0.0 | 0.0 | 6.0 | 0.0 |
| 2 | 15.9 | 15.9 | 0.0 | 0.0 | 0.0 | 0.0 |
| 3 | 0.0 | 14.5 | 0.0 | 0.0 | 0.0 | 29.9 |
| 4 | 7.5 | 0.0 | 0.0 | 0.0 | 15.6 | 0.0 |
| 5 | 0.0 | 0.0 | 21.0 | 17.4 | 9.0 | 20.4 |
| 6 | 0.0 | 14.5 | 14.5 | 0.0 | 0.0 | 14.5 |
| 7 | 7.5 | 4.5 | 0.0 | 0.0 | 4.3 | 4.3 |
| Median | 0.0±0.0 | 4.5±6.6 | 0.0±0.0 | 0.0±0.0 | 4.3±6.4 | 4.3±6.4 |
E Determining envelope filter cutoffs
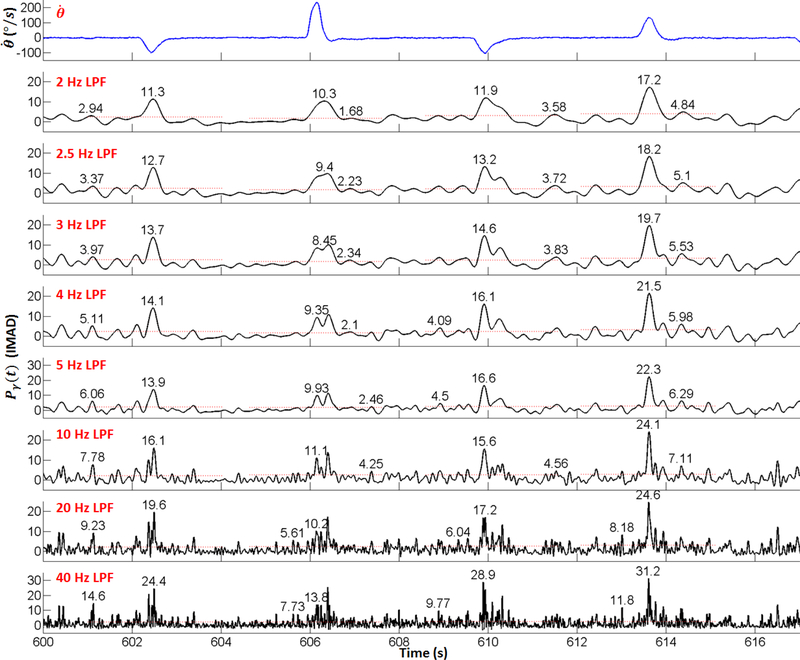
The corner frequency, fc = 2.5 Hz, of the low-pass Butterworth filter used for γ-power envelope calculations (see Section 2.4.2) was chosen based on several factors. Namely, its dominant time constant τd = 166 ms is well-matched to the duration of movements, as it takes 2–5 τd to complete the fastest movements, and >8 τd for slower ones (see Table 1). In addition, the main lobe of the filter’s impulse response is ~400 ms, which is consistent with a typical duration of an integration window in ECoG-based BCI studies (Wang et al, 2013e). Finally, its zero-phase (acausal) nature ensures that the temporal relationship between the trajectory and γ-power bursts remains preserved, as can be seen in Fig. 40.
To verify the robustness of our results, we reanalyzed Subject 2’s data while perturbing the parameter fc. Specifically, brain maps of DM/WM as well as r2 between DM and WM were recomputed while varying the value of fc from 2 to 5 Hz. Naturally, as fc increased, the time constant, τd, decreased, thereby reducing the value of DM, and consequently the ratio, DM/WM. However, this affected all electrodes is a similar manner and merely rescaled the DM/WM maps, as can be seen by comparing Fig. 38 and Fig. 6. On the other hand, the r2 maps remained essentially unchanged, as can be seen by comparing Fig. 39 and Fig. 10. This indicates that the goodness-of-fit of the linear model given by eq. (4) did not change and remained high in the relevant areas, especially near the core electrode. At the same time, the r2 values between Di and Wi remained low, suggesting an appropriate choice of thresholds for Pγ calculation (see Section 2.4.6).
Fig. 38.
Spatial map of the per-channel ratios DM/WM and DI/WI averaged across all movement speeds and events for Subject 2 with the high-γ envelope filter set to 5 Hz. Circle: core electrodes. Triangle: electrodes with the highest averaged DM/WM for each specific movement and direction. The color of each symbol indicates the electrode’s DM/WM value. Compare to Fig. 6.
Finally, Fig. 40 shows the evolution of Pγ as fc varies from 2 to 40 Hz. Starting from fc = 10 Hz, the period of elevated Pγ was no longer contiguous, which undermined the definition of DM (see Section 2.4.3). At the same time, the amplitude of high-γ power bursts outside of movement periods increased, resulting in a significant loss of signal-to-noise ratio. This is not surprising since at fc ≥ 10 Hz, the time constant of the filter (τd < 42 ms) no longer matches the characteristic time scale of ECoG signals and is therefore highly suboptimal for analysis.
Fig. 39.
Spatial maps of the per-channel coefficient of determination (r2) between DM and WM aggregated across all movement events and speeds for Subject 2 with the high-γ envelope filter set to 5 Hz. Circle: core electrode. Triangle: electrode with the highest r2 for each panel. The color of each symbol indicates the electrode’s r2 value. Compare to Fig. 10.
Fig. 40.
Time movement velocity ω and Pγ signal at electrode #24 during Subject 2’s PG experiment runs. Red dashed lines: The local MAD (LMAD) thresholds estimated from local idling periods around each flexion or extension. Numbers denote the peak amplitudes during movement and local idling periods.
Footnotes
Conflict of Interest
The authors have no conflict of interest to disclose.
Contributor Information
Po T. Wang, Department of Biomedical Engineering, University of California, Irvine, CA 92697, USA
Colin M. McCrimmon, Department of Biomedical Engineering, University of California, Irvine, CA 92697, USA
Christine E. King, Department of Biomedical Engineering, University of California, Irvine, CA 92697, USA
Susan J. Shaw, Department of Neurology, Rancho Los Amigos National Rehabilitation Center, 7601 East Imperial Highway, Downey, CA 90242, USA Department of Neurology, University of Southern California, Los Angeles, CA 90089, USA; Center for NeuroRestoration, University of Southern California, Los Angeles, CA 90089, USA.
David E. Millett, Department of Neurology, Rancho Los Amigos National Rehabilitation Center, 7601 East Imperial Highway, Downey, CA 90242, USA Center for NeuroRestoration, University of Southern California, Los Angeles, CA 90089, USA.
Hui Gong, Department of Neurology, Rancho Los Amigos National Rehabilitation Center, 7601 East Imperial Highway, Downey, CA 90242, USA; Center for NeuroRestoration, University of Southern California, Los Angeles, CA 90089, USA.
Luis A. Chui, Department of Neurology, University of California, Irvine, CA 92697, USA
Charles Y. Liu, Center for NeuroRestoration, University of Southern California, Los Angeles, CA 90089, USA Department of Neurosurgery, Rancho Los Amigos National Rehabilitation Center, 7601 East Imperial Highway, Downey, CA 90242, USA; Department of Neurosurgery, University of Southern California, Los Angeles, CA 90089, USA.
Zoran Nenadic, Department of Biomedical Engineering, University of California, Irvine, CA 92697, USA; Department of Electrical Engineering and Computer Science, University of California, Irvine, CA 92697, USA.
An H. Do, Department of Neurology, University of California, Irvine, CA 92697, USA
References
- Acharya S, Fifer MS, Benz HL, Crone NE, Thakor NV (2010) Electrocorticographic amplitude predicts finger positions during slow grasping motions of the hand. J Neural Eng 7(4): [DOI] [PMC free article] [PubMed] [Google Scholar]
- Anderson NR, Blakely T, Schalk G, Leuthardt EC, Moran DW (2012) Electrocorticographic (ECoG) correlates of human arm movements. Exp Brain Res 223(1):1–10 [DOI] [PubMed] [Google Scholar]
- Cheney PD, Fetz EE (1980) Functional classes of primate corticomotoneuronal cells and their relation to active force. J Neurophysiol 44(4):773–791 [DOI] [PubMed] [Google Scholar]
- Crone NE, Miglioretti DL, Gordon B, Lesser RP (1998a) Functional mapping of human sensorimotor cortex with electrocorticographic spectral analysis. II. event-related synchronization in the gamma band. Brain 121(12):2301–2315 [DOI] [PubMed] [Google Scholar]
- Crone NE, Miglioretti DL, Gordon B, Sieracki JM, Wilson MT, Uematsu S, Lesser RP (1998b) Functional mapping of human sensorimotor cortex with electrocorticographic spectral analysis. I. alpha and beta event-related desynchronization. Brain 121(12):2271–2299 [DOI] [PubMed] [Google Scholar]
- Dempster AP, Laird NM, Rubin DB (1977) Maximum likelihood from incomplete data via the EM algorithm. J R Stat Soc B 39(1):1–38 [Google Scholar]
- Evarts EV (1968) Relation of pyramidal tract activity to force exerted during voluntary movement. J Neurophysiol 31(1):14–27 [DOI] [PubMed] [Google Scholar]
- Fraley C, Raftery AE (1998) How many clusters? which clustering method? answers via model-based cluster analysis. Comput J 41(8):578–588 [Google Scholar]
- Fujiwara Y, Matsumoto R, Nakae T, Usami K, Matsuhashi M, Kikuchi T, Yoshida K, Kunieda T, Miyamoto S, Mima T, Ikeda A, Osu R (2016) Neural pattern similarity between contra- and ipsilateral movements in high-frequency band of human electrocorticograms. Neuroimage 147:302–313 [DOI] [PubMed] [Google Scholar]
- Hammer J, Pistohl T, Fischer J, Kršek P, Tomásek M, Marusič P, Schulze-Bonhage A, Aertsen A, Ball T (2016) Predominance of movement speed over direction in neuronal population signals of motor cortex: intracranial EEG data and a simple explanatory model. Cereb Cortex 26(6):2863–2881 [DOI] [PMC free article] [PubMed] [Google Scholar]
- Humphrey DR, Schmidt EM, Thompson WD (1970) Predicting measures of motor performance from multiple cortical spike trains. Science 170(959):758–762 [DOI] [PubMed] [Google Scholar]
- Jäncke L, Specht K, Mirzazade S, Peters M (1999) The effect of finger-movement speed of the dominant and the subdominant hand on cerebellar activation: A functional magnetic resonance imaging study. Neuroimage 9(5):497–507 [DOI] [PubMed] [Google Scholar]
- Kass RE, Raftery AE (1995) Bayes factors. J Am Stat Assoc 90(430):773–795 [Google Scholar]
- Kubánek J, Miller K, Ojemann J, Wolpaw J, Schalk G (2009) Decoding flexion of individual fingers using electrocorticographic signals in humans. J Neural Eng 6(6): [DOI] [PMC free article] [PubMed] [Google Scholar]
- Lutz K, Koeneke S, Wustenberg T, Jäncke L (2004) Asymmetry of cortical activation during maximum and convenient tapping speed. Neurosci Lett 373(1):61–66 [DOI] [PubMed] [Google Scholar]
- Miller K, Leuthardt E, Schalk G, Rao R, Anderson N, Moran D, Miller J, Ojemann J (2007) Spectral changes in cortical surface potentials during motor movement. J Neurosci 27(9):2424–2432 [DOI] [PMC free article] [PubMed] [Google Scholar]
- Nenadic Z, Burdick J (2006) A control algorithm for autonomous optimization of extracellular recordings. IEEE Trans Biomed Eng 53(5):941–955 [DOI] [PubMed] [Google Scholar]
- Person R (1974) Rhythmic activity of a group of human motoneurones during voluntary contraction of a muscle. Electroen Clin Neuro 36:585–595 [DOI] [PubMed] [Google Scholar]
- Pfurtscheller G, Graimann B, Huggins J, Levine S, Schuh L (2003) Spatiotemporal patterns of beta desynchronization and gamma synchronization in corticographic data during self-paced movement. Clin Neurophysiol 114(7):1226–1236 [DOI] [PubMed] [Google Scholar]
- Pistohl T, Ball T, Schulze-Bonhage A, Aertsen A, Mehring C (2008) Prediction of arm movement trajectories from ECoG-recordings in humans. J Neurosci Meth 167(1):105–114 [DOI] [PubMed] [Google Scholar]
- Schalk G, Kubánek J, Miller KJ, Anderson NR, Leuthardt EC, Ojemann JG, Limbrick D, Moran D, Gerhardt LA, Wolpaw JR (2007) Decoding two-dimensional movement trajectories using electrocorticographic signals in humans. J Neural Eng 4(3):264–275 [DOI] [PubMed] [Google Scholar]
- Shibasaki H, Sadato N, Lyshkow H, Yonekura Y, Honda M, Nagamine T, Suwazono S, Magata Y, Ikeda A, Miyazaki M, et al. (1993) Both primary motor cortex and supplementary motor area play an important role in complex finger movement. Brain 116(6):1387–1398 [DOI] [PubMed] [Google Scholar]
- Turner RS, Grafton ST, Votaw JR, Delong MR, Hoffman JM (1998) Motor subcircuits mediating the control of movement velocity: a pet study. J Neurophysiol 80(4):2162–2176 [DOI] [PubMed] [Google Scholar]
- Wang PT, King CE, Do AH, Nenadic Z (2011a) A durable, low-cost electrogoniometer for dynamic measurement of joint trajectories. Med Eng Phys 33(5):546–552 [DOI] [PubMed] [Google Scholar]
- Wang PT, King CE, Schombs A, Lin JJ, Sazgar M, Hsu FPK, Millett DE, Liu CY, Chui LA, Nenadic Z, Do AH (2013a) Electrocorticogram encoding of upper extremity movement trajectories. In: Proc. of the 6th International IEEE EMBS Conference on Neural Engineering, pp 1429–1432 [Google Scholar]
- Wang PT, King CE, Schombs A, Lin JJ, Sazgar M, Hsu FPK, Shaw SJ, Millett DE, Liu CY, Chui LA, Nenadic Z, Do AH (2013b) Electrocorticographic gamma band power encodes the velocity of upper extremity movements. In: Proc. of the 5th International Brain-Computer Interface Meeting, p 120 [Google Scholar]
- Wang PT, King CE, Shaw SJ, Millett DE, Liu CY, Chui LA, Nenadic Z, Do AH (2013c) A co-registration approach for electrocorticogram electrode localization using post-implantation MRI and CT of the head. In: Proc. of the 6th International IEEE EMBS Conference on Neural Engineering, pp 525–528 [Google Scholar]
- Wang PT, Puttock EJ, King CE, Schombs A, Lin JJ, Sazgar M, Hsu FPK, Shaw SJ, Millett DE, Liu CY, Chui LA, Do AH, Nenadic Z (2013d) State and trajectory decoding of upper extremity movements from electrocorticogram. In: Proc. of the 6th International IEEE EMBS Conference on Neural Engineering, pp 969–972 [DOI] [PubMed] [Google Scholar]
- Wang PT, King CE, Shaw SJ, Millett DE, Liu CY, Chui LA, Nenadic Z, Do AH (2014) Electrocorticogram encoding of upper extremity movement duration. In: Proc. of the 36th Annual International Conference of the IEEE Engineering in Medicine and Biology Society, pp 1243–1246 [DOI] [PMC free article] [PubMed] [Google Scholar]
- Wang PT, King CE, McCrimmon CM, Lin JJ, Sazgar M, Hsu FP, Shaw SJ, Millet DE, Chui LA, Liu CY, Do AH, Nenadic Z (2016) Comparison of decoding resolution of standard and high-density electrocorticogram electrodes. J Neural Eng 13(2): [DOI] [PMC free article] [PubMed] [Google Scholar]
- Wang W, Collinger JL, Degenhart AD, Tyler-Kabara EC, Schwartz AB, Moran DW, Weber DJ, Wodlinger B, Vinjamuri RK, Ashmore RC, et al. (2013e) An electrocorticographic brain interface in an individual with tetraplegia. PloS ONE 8(2): [DOI] [PMC free article] [PubMed] [Google Scholar]
- Wang Z, Ji Q, Miller K, Schalk G (2011b) Prior knowledge improves decoding of finger flexion from electro- corticographic signals. Front Neurosci 5:127. [DOI] [PMC free article] [PubMed] [Google Scholar]
- Wexler BE, Fulbright RK, Lacadie CM, Skudlarski P, Kelz MB, Constable RT, Gore JC (1997) An fMRI study of the human cortical motor system response to increasing functional demands. Magn Reson Imaging 15(4):385–396 [DOI] [PubMed] [Google Scholar]
- Wiestler T, Diedrichsen J (2013) Skill learning strengthens cortical representations of motor sequences. Elife 2: [DOI] [PMC free article] [PubMed] [Google Scholar]


