Abstract
To obtain a fundamental understanding of the various factors affecting pressure filtration performance, we developed a coupled computational fluid dynamics (CFD) and discrete element method (DEM) model for simulating the effect of solvent flow through the solid particle cake. The model was validated using data collected by filtering mixtures of spherical glass beads and deionized water through a dead-end cell over a range of applied pressures. Numerical experiments were performed to study the effects of particle properties, liquid properties and operating conditions on filtration performance. The model predicted that the filtrate flow rate could be strongly affected by the mean size of the particles, the presence of small particles (i.e. fines) in the particle distribution, the viscosity of the liquid, and particle deformation leading to cake compression. Our study demonstrated that CFD-DEM modeling is a powerful approach for understanding cake filtration processes and predicting filtration performance.
Keywords: Pressure filtration, Particle technology, Discrete element methods, Computational fluid dynamics
GRAPHICAL ABSTRACT
1. Introduction
Pressure filtration is an important solid-liquid separation operation in which a particle suspension is subjected to an applied pressure and the liquid is forced through a filter medium that is only permeable to the fluid phase. Common applications include separation of solid particles from a mother liquor in the pharmaceutical industry, recovering of microorganisms from fermentation broths in the biotechnology industry, and solids recovery from ores in the minerals industries (Bruckard and Woodcock, 2009; Foley, 2006; Macleod and Muller, 2012; Murugesan et al., 2010; Walzel, 2012). The porous cakes formed by different particle suspensions can exhibit widely different filtration behaviors including filtration times that vary from hours to weeks under similar operating conditions (Murugesan et al., 2012). The filtrate flow rate is dependent on operating conditions (e.g. applied pressure), liquid properties (e.g. viscosity) and cake properties (e.g. resistance) (Tien, 2002). Because pressure filtration is often one step in a larger batch processing plant, there is considerable motivation to improve filtration performance by reducing the filtration cycle time.
Process modeling represents a powerful tool for developing improved understanding and enhanced efficiency of pressure filtration processes. A conventional cake filtration model requires solution of the relevant continuity equations under certain simplifying assumptions (Tien and Bai, 2003). Although conventional models provide macroscopic predictions such as the time-dependent cake thickness and filtrate volumetric flow rate (Murugesan et al., 2010), this approach is unable to account for the effects of the particle size/shape distribution on cake structure and filtration performance. To better understand cake formation and particle effects on filtration performance, a study at the particle level is required. The discrete element method (DEM) provides means to resolve granular motions at the particle level, describe the dynamic cake formation process, and study the effects of size/shape distributions and other particle properties. Coupling DEM with computational fluid dynamics (CFD) allows solid-liquid interactions to be and offers means to study flow behavior in porous and granular media induced by particle geometry (Kloss et al., 2012; Qian et al., 2014; Yue et al., 2016).
Past CFD-DEM studies related to cake filtration have investigated the settling of monodisperse particles in sedimentation and filtration under various conditions (Dong et al., 2009) and filtration with and without flocculation in two-dimensional domains (Sören and Jürgen, 2012). In this work, we developed a coupled CFD-DEM model using the open source software OpenFOAM®, LIGGGHTS, (Kloss et al., 2012) and CFDEMcoupling (Goniva et al., 2012) to simulate three-dimensional cake filtration with polydisperse spherical particles. The ability of our model to predict filtration performance including cake resistance and filtrate volumetric flow rate was tested by comparing model predictions to experimental data for different applied pressures and for two mean particle sizes using spherical glass beads as the solid phase and deionized water as the liquid phase. Additional numerical studies were performed to investigate the effects of particle properties, liquid properties and operating conditions on filtration performance. The coupled CFD-DEM approach was shown to provide insights into particle effects on filtration performance and to offer opportunities to improve the pressure filtration process. More generally, CFD-DEM based simulation could benefit the pharmaceutical industry as a development tool by accounting for more complex particle size/shape distributions of non-spherical active pharmaceutical ingredients (APIs).
2. Materials and methods
2.1. Materials
The particles used in filtration experiments were soda-lime silica glass with measured Sauter mean diameters (SMD) of 48 μm (Vaniman, Fallbrook, CA) and 175 μm (Sigma-Aldrich, Saint Louis, MO). The size distribution of each particle sample was measured using a brightfield microscope (EVOS® XL Core Imaging System). The particles were counted automatically via an in-house computer vision script written in MATLAB® for image processing. Over 10,000 particles were measured for each sample with the script identifying each glass bead particle, determining its diameter and eliminating the possibility of counting the same particle multiple times. Simulation related solid properties provided by Sigma-Aldrich are listed in Table 1 (Sigma-Aldrich Inc.).
Table 1.
Operating conditions and relevant properties of glass beads and deionized water.
| Parameter | Value range |
|---|---|
| Measured Sauter mean diameter (μm), SMD | 48; 175 |
| Particle density (kg/m3), ρp | 2.5 × 10³ |
| Young’s modulus (Pa), E | 6.89 × 10¹⁰ |
| Poisson’s ratio, σ | 0.21 |
| Coefficient of restitution, e | 0.3 |
| Coefficient of friction, μcof | 0.9 |
| Liquid density (kg/m3), ρf | 1 × 10³ |
| Liquid kinematic viscosity (m2/s), vf | 1 × 10⁻⁶ |
| Applied pressure (psi), P | 5–20 |
| Liquid inlet velocity (cm/s), uf | 0.1–0.5; 0.8–2.3 |
2.2. Experimental procedures
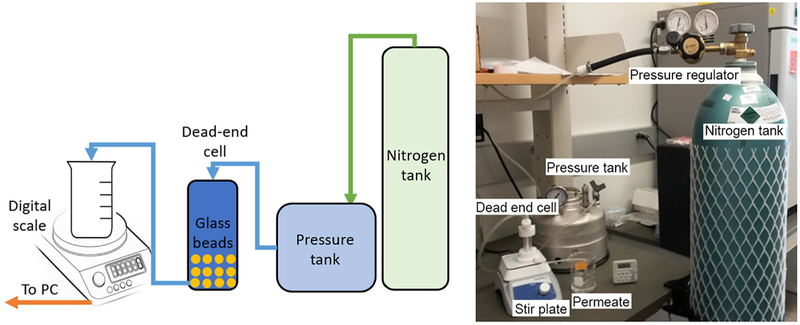
To validate the CFD-DEM model, simulation results were compared with experimental measurements collected from a dead-end cell apparatus (Fig. 1). A suspension was prepared by mixing 20 g of glass beads with 10 mL of deionized water and then placed in a dead-end cell (Sterlitech, Kent, WA) equipped with a circular acrylic spacer with inner diameter of 1.8 cm, rigid polypropylene support layer and polypropylene filter cloth with pore size of 11 μm (Sefar Inc., Depew, NY). The dead-end cell was then closed and checked for leaks. Deionized water was delivered from a pressure vessel on top of the cell at a desired applied pressure. Pressure was measured using digital pressure gauges (Cole-Parmer, Vernon Hills, IL) and applied via a nitrogen pressure tank. Experimental applied pressures ranged from 5 to 20 psi. Under these pressures, the inlet velocity ranged from 0.1–0.5 cm/s and 0.8–2.3 cm/s for glass beads with SMD of 48 μm and 175 μm, respectively. The filtrate was collected in a beaker placed on a digital balance (Mettler Toledo, Westfield, MA). The mass of filtrate was recorded every 0.125 sec using a data logger connected to a local serial port client PuTTY (www.putty.org). The specific cake resistance were calculated with the following equations (Murugesan et al., 2010),
| (1) |
| (2) |
where Vf is the filtrate volume collected, t is the time, P is the applied pressure, A is the cross-sectional area of the filter medium, μf is the liquid viscosity, C is solids concentration of the suspension,Rc is the cake resistance, α is the specific cake resistance and Rm is the resistance of filter medium. The filtrate mass flow rate was calculated when the cake was completely formed, at which time the cake resistanceRc remained constant. Using the same experimental setup without any solids present, the filter medium resistance Rm was calculated by running deionized water flow tests under different operating pressures.
Fig. 1.
(Left) Schematic illustration and (Right) digital photo of the experimental setup for model validation. The flow of deionized water was driven by a pressurized water tank and permeated water was collected in a beaker. The permeate mass was measured and recorded using a digital scale with data logger.
2.3. Model description
The coupled particle-fluid flow of the pressure filtration process was described using CFD-DEM coupling approach. Individual particle motions were resolved by discrete-particle equations of motion through DEM calculations. The liquid suspension was treated as a continuum phase and assumed to follow the mass and momentum conservation equations of an incompressible fluid (Kloss et al., 2012). The simulation domain was cylindrical and defined to have a filtration area of 5 cm2 and height of 5.5 cm consistent with the experimental apparatus. The simulations were performed using a Dell workstation with two Intel Xeon Gold 6140 CPUs, generating simulation times that varied between approximately 0.5–60 h depending on the step size used.
2.3.1. Discrete Element Method (DEM)
The DEM code applied a Lagrangian approach, where all particle trajectories were tracked explicitly by solving their force balances. Unlike conventional cake filtration models (Tien and Bai, 2003), the DEM method provided a first-principles approach to describe the motion of individual particles (Dong et al., 2009). The linear and angular motions of particle i were described by the following momentum conservation equations (Kloss et al., 2012),
| (3) |
| (4) |
where vi, wi, ri, miand Ii are the transitional and angular velocities, radius, mass and rotational inertia of the particle i, respectively, Fi,n is the normal particle-particle contact force, Fi,t is the tangential particle-particle contact force, Fi,f is the particle-fluid interaction force, Fi,b accounts for other non-contact body forces exerted on the particles such as gravity, van-der-Waals forces, liquid bridge forces and electrostatic forces, and Ti,r is an additional torque caused by rolling friction due to the elastic hysteresis losses and collision viscous dissipation (Brilliantov and Pöschel, 1998; Zhou et al., 1999). The particles were assumed to be spherical and only interact at contacts with other particles or other contact surfaces. The Hertz contact model, which consists of many known material parameters, was used to calculate particle-particle and particle-wall forces (Zhu et al., 2007). The DEM time step is chosen to be within 10% of Rayleigh and Hertz time (He and Wettlaufer, 2014; Luding, 1998). For each simulation, the total mass of the particles in the system remained fixed by specifying the total volume of particles inserted. Depending on the system parameters used, we investigated 1500–100,000 particles and produced a cake thickness of approximately 2.5 cm.
2.3.2. Computational Fluid Dynamics (CFD)
The modified volume-averaged Navier-Stokes equations for incompressible viscous flow were used to account for the effect of a secondary particulate phase mixed on the primary fluid phase (Kloss et al., 2012),
| (5) |
| (6) |
where ρf and uf are the density and velocity of the fluid, respectively, ε is the void space occupied by the liquid, the quantity εuf is the averaged macroscopic velocity (Sören and Jürgen, 2012), τ is the stress tensor for the fluid phase, and Rpf is the particle-fluid momentum exchange term calculated for each computational cell based on particle-based drag forces (Kloss et al., 2012). Many studies stress the importance of proper selection of the mesh scheme to improve accuracy (Peng et al., 2014; Volk et al., 2018; Zhang and Yin, 2018), the cell size was chosen between two to four times the particle Sauter mean diameter. Since the cell size used was larger compared to the particle size, this approach did not fully resolve flow around each individual particle and therefore did not provide insights into the intrinsic flow behavior around complex granular structures. Since such highly resolved predictions come with huge computational cost, the unresolved approach was used due to its ability to predict overall flow behavior and still resolve discrete particle motions at reasonable computational cost (Lichtenegger and Pirker, 2018).
2.3.3. Coupled DEM and CFD
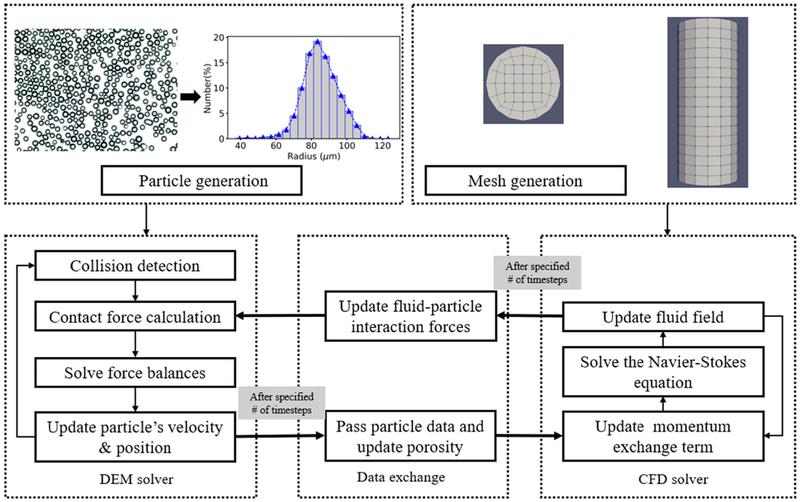
The coupled CFD-DEM model was realized in the open-source framework CFDEMcoupling (Goniva et al., 2012), which integrates the CFD solver OpenFOAM® (Open Source Field Operation and Manipulation) (www.openfoam.org) and LIGGGHTS (LAMMPS Improved For General Granular and Granular Heat Transfer Simulations) (Hager et al., 2014). LIGGGHTS generates particles and calculate their motions governed by Newton’s law of motion and OpenFOAM® applies the PISO (Pressure-Implicit with Splitting of Operators) scheme to solve mass and momentum conservation equations in Eulerian form (Zhang and Yin, 2018). CFDEMcoupling exchanges the particle-fluid interaction data between LIGGGHTS and OpenFOAM® at every 100 DEM time steps (Fig. 2). The interaction force on individual particles Fi,f and overall particle-fluid interactions Rpf were calculated via the drag laws (Kloss et al., 2012; Volk et al., 2017),
| (7) |
| (8) |
where Vi is the particle volume, vi is the particle velocity,ε is the porosity (the void fraction in the computational cell), Vj is the volume of computational cell j and xi,j is the volume fraction of particle i in cell j. The coefficient β depends on the selection of drag laws. We used the widely applied Gidaspow drag law, which is a combination of the Ergun equation when void fraction ε in the computational cell is below 0.8 (Ergun, 1952) and Wen and Yu equations for higher values of porosity ε ≥ 0.8 (Wen and Yu, 1966),
| (9) |
| (10) |
| (11) |
where Cd is the drag coefficient, dpis the particle diameter, Rep is the particle Reynolds number, and ρf and μf are the fluid density and viscosity, respectively.
Fig. 2.
Schematic representation of the coupling between the computational fluid dynamics (CFD) and discrete element method (DEM) codes showing initial particle and mesh generation steps. Adapted from Zhang and Yin (2018).
The dynamic filtration process was simulated by inserting the entire particle population into the simulation domain and then starting the combined CFD-DEM simulation. The cake thickness continuously increased as particles deposited at the bottom of the simulation domain, resulting in a continuous increase in the cake thickness and decrease in the filtrate flow rate, until the cake was completely formed. To compare the effects of different parameters on filtration performance, we calculated the specific cake resistance α and the corresponding filtrate flow rate Vf when the cake structure remained static following formation. For the model validation tests where the glass beads were experimentally observed to settle quickly due to gravity to form a dense cake, the DEM and CFD simulations were performed sequentially for simplicity.
3. Results and discussion
3.1. Model validation
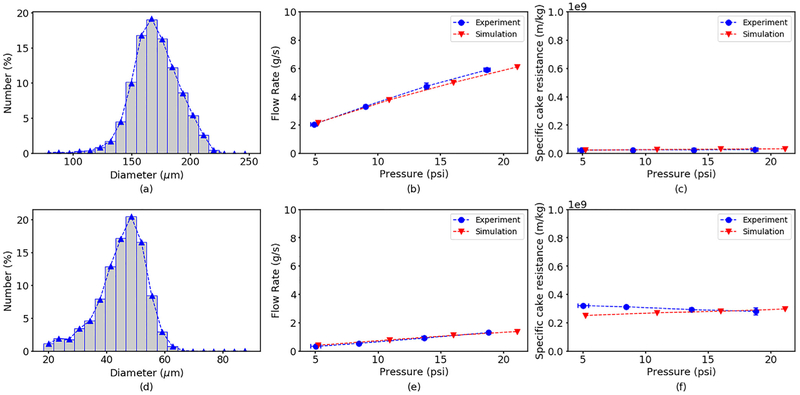
To validate the CFD-DEM model, simulations were performed to mimic the experiment conditions listed in Table 1. The DEM code was used to generate spherical particles with the measured size distributions (Fig. 3ad) under the assumption that particles were randomly distributed in the simulation domain without overlapping and with initial velocity v equal to 0. Due to the nature of the experimental setup, solid particles started sedimentation and cake formation before pressure induced fluid flow. The validation simulations were formulated accordingly, with the particles initially settling under gravity. Following this sedimentation process, a series of simulations were performed using applied pressures ranging from 5 to 20 psi. The fluid entered the simulation domain at the top of the filtration cylinder and exited the domain at the bottom of the cylinder, which was set to atmosphere pressure. As an output of the simulations, the filtrate mass flow rate was compared with experimentally measured values. Average specific cake resistance values calculated from (2) using simulation and experimental data also were compared. The applied pressure used in experiments was adjusted with a regulator on the nitrogen gas cylinder to be approximately 5 to 20 psi. We used a digital pressure gauge at the inlet of the dead-end cell to accurately measure the inlet pressure, which differed slightly from the applied pressure used in the corresponding simulation.
Fig. 3.
(Top) Comparison of experimental and simulation results for glass beads with SMD of 175 μm. (Bottom) Comparison of experimental and simulation results for glass beads with SMD of 48 μm, (a)(d) Particle size distributions by number percent measured using a brightfield microscope. (b)(e) Filtrate mass flow rate as a function of applied pressure. (c)(f) Specific cake resistance as a function of pressure. Error bars denote standard errors of three replicate experiments.
The simulation results and experimental measurements showed good agreement, demonstrating the applicability of the CFD-DEM model. The filtrate flow rate was predicted to increase linearly with increasing applied pressure while the cake resistance was approximately constant. These results indicate that the formed cakes followed incompressible cake behavior, which was in good agreement with present knowledge (Murugesan et al., 2010; Walzel, 2012). Noting that all experiments were performed with the same total mass of glass beads, cakes formed with the smaller diameter beads had much larger average cake resistances (Fig. 3cf), and therefore much smaller filtrate flow rates (Fig. 3be). This striking difference was caused by the particle-fluid interaction force being larger in the smaller particle case, which was directly accounted for in the CFD-DEM model. Also the smaller particles had more surface area for the same particle volume, which created more friction between the fluid and solids and therefore a higher resistance to flow (Lu et al., 2018).
3.2. Predicted effects of liquid and particle properties on filtration performance
Having achieved satisfactory model validation over a range of applied pressures, we performed numerical experiments to investigate the effects of different liquid and particle parameters on filtration performance. Each parameter was studied independently over the ranges listed in Table 2. In the calculations of filtrate flow rates, the mass of the cake and medium resistance were assumed to be 0.1 kg and 1 × 10⁸ m−1 respectively.
Table 2.
Particle and liquid properties used in parametric simulation studies.
| Parameter | Base value | Value range |
|---|---|---|
| Particle diameter (μm), dp | 800 | 150–2000 |
| Particle density (kg/m3), ρp | 1.3 × 10³ | 1.3 × 10³ |
| Young’s modulus (Pa), E | 1 × 10⁶ | 106–109 |
| Poisson’s ratio, σ | 0.45 | 0.45 |
| Coefficient of restitution, e | 0.3 | 0.3 |
| Coefficient of friction, μcof | 0.5 | 0.5 |
| Liquid density (kg/m3), ρf | 1 × 10³ | 0.4 × 10³–1.4 × 10³ |
| Liquid kinematic viscosity (m2/s), vf | 1 × 10⁻⁶ | 0.5 × 10⁻⁶−1 × 10⁻⁵ |
| Applied pressure (psi), P | 1.75 | 1.75–10 |
| Approximate cake thickness (cm), hc | 2.5 | 2.5 |
| DEM time step (s), t | 1 × 10⁻⁶ | 1 × 10⁻⁸−1 × 10⁻⁶ |
3.2.1. Cake compressibility
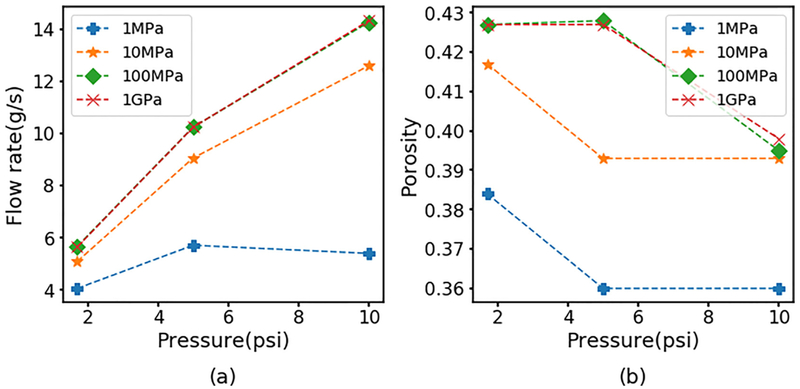
In the DEM framework, the stiffness of simulated particles is specified through the Young’s modulus. To model cake compressibility, we performed simulations with comparably smaller values of the Young’s modulus compared to the validation case such that particles could exhibit deformation like behavior, alter the overall cake structure and allow compressibility under applied pressure. More specifically, the contact stiffness factors into the calculation of contact forces between particles and determines particle movement and position. As the Young’s modulus was decreased, the model predicted reduced cake porosity and filtrate mass flow at a given applied pressure (Fig. 4). This trend was rationalized by noting that increasing Young’s modulus results in higher particle stiffness, shorter contact times and larger forces between colliding particles, which in turn increases cake porosity, reduces cake resistance and increases filtrate flow. At the lowest Young’s modulus of 1 MPa, the filtrate mass flow rate was predicted to exhibit a maximum at an intermediate applied pressure consistent with a highly compressible cake (Murugesan et al., 2010).
Fig. 4.
Predicted effect of particle stiffness on filtrate performance achieved by varying the Young’s modulus value of polydisperse particles with diameter of 800 μm and standard deviation of 80 μm. Model predictions of (a) filtrate flow mass rate and (b) average cake porosity as a function of applied pressure and Young’s modulus.
3.2.2. Liquid properties
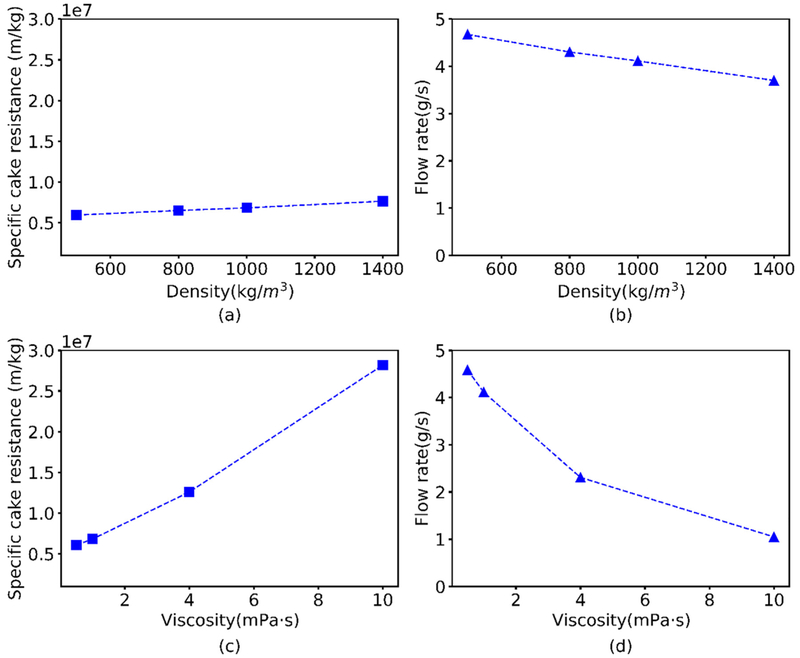
Darcy’s law indicates the filtrate flow rate should be inversely proportional to the liquid viscosity. Several studies have investigated the effect of liquid properties such as density ρf and viscosity μf on cake structure (Dong et al., 2009). We varied these two parameters within the range of common solvents used for pharmaceutical filtration (see Table 2). Our CFD-DEM model predicted that increasing liquid density or viscosity would result in increased cake resistance and decrease filtrate flow rates (Fig. 5). These predicted behaviors were attributable to the drag force increasing with increasing density and viscosity (Dong et al., 2009) (see Eq. (9)) as both liquid-phase properties have a weighted proportion in the calculation of particle-fluid interaction term. Importantly, the model predicted that the filtrate flow rate would more strongly affected by changes in liquid viscosity than density over the range of parameter values explored.
Fig. 5.
Predicted effects of liquid properties on filtration performance evaluated for monodisperse spherical particles diameter of 800 μm and applied pressure of 1.75 psi. (a) Specific cake resistance and (b) filtrate mass flow rate as a function of the liquid density; (c) specific cake resistance and (d) filtrate mass flow rate as a function of the liquid viscosity.
3.2.3. Particle size distribution
The particle size distribution affects the porous structure of the filter cake, which in turn largely determines the cake resistance (Tien, 2002). While microscopic cake structure information is difficult to determine experimentally (Bürger et al., 2001), the particle-level detail of the CFD-DEM model provided a means to explore these relationships computationally. To investigate the effect of mean particle size, we performed simulations with monodisperse spherical particles with radii in the range 400–1000 μm (Fig. 6). As the particle size decreased, the specific cake resistance increased and the filtrate mass flow rate decreased even though the cake porosity remained approximately constant. More specifically, the cake resistance increased quadratically with decreasing particle size according to the first term in Eq. (9) that accounts for the particle-fluid force (Ergun, 1952). The model prediction that the cake porosity should be approximately 0.36 independent of the particle size agreed with theoretical values reported for close random packing of monodisperse spheres (Farr, 2013).
Fig. 6.
Predicted effect of particle size on filtration performance for monodisperse spheres with different radii. Model predictions of (a) specific cake resistance (b) filtrate mass flow rate and (c) average cake porosity as a function of particle radius.
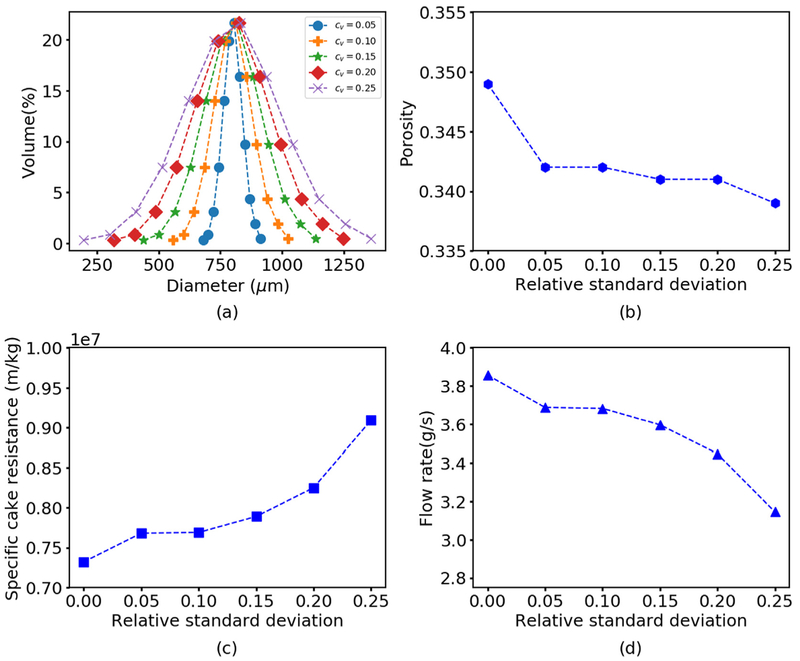
Because real particle populations are rarely monodispersed, we performed several types of simulations to investigate the impact of the polydisperse spheres on filtration performance. First a series of simulations were performed by varying the standard deviation of the particle distribution from 40 to 200 μm with a fixed mean particle diameter of 800 μm assuming the particle size was normally distributed (Fig. 7). This approach allowed the polydispersity to be varied while maintaining the total mass of particles constant across the simulations. The cake porosity was predicted to be a weak decreasing function of increasing polydispersity, suggesting that particle packing was not strongly affected by the presence of different size particles over the size ranges tested. Interestingly, the cake resistance and filtrate flow rate were not strongly impacted until the standard deviation reached its largest value. At this point, the resistance increased and the flow rate decreased as the presence of smaller particles allowed the formation of a denser cake with fewer channels for fluid flow.
Fig. 7.
Predicted effect of the particle size distribution on filtration performance for polydisperse spheres. (a) Varying particle size distributions by volume percent with the same mean diameter and different standard deviation. Corresponding model predictions of (b) average cake porosity (c) specific cake resistance and (d) filtrate flow rate as a function of the relative standard deviation cv , defined as standard deviation divided by the mean particle diameter.
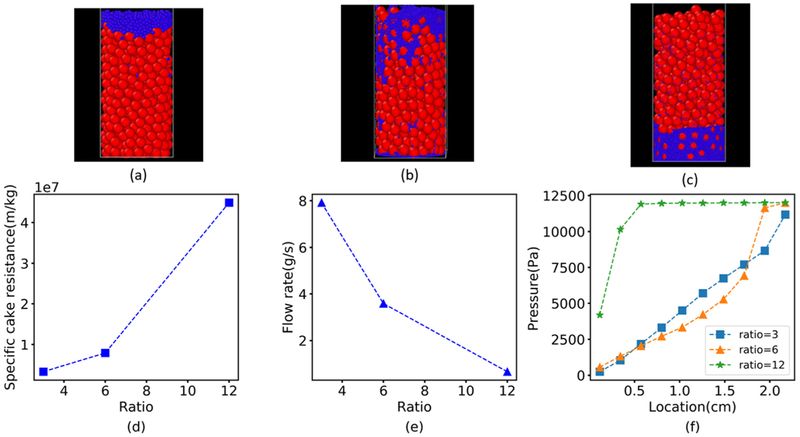
Cakes formed by pressure filtration are often spatially nonhomogeneous due to larger particles first depositing at the bottom due to gravity and then fines migrating downwards once pressure is applied (Faber et al., 2016). This phenomenon can result in increased cake resistance due to decreased porosity and is expected to occur when the particle size distribution is highly polydisperse. To investigate the impact of fines on filtration behavior, we performed simulations with bimodal particle distributions comprised of large particles having a fixed, monodisperse diameter dp,pb = 1.8 mm and smaller particles having an adjustable, monodisperse diameter dp,f . Increasingly small fines were introduced by altering the diameter of the small particles such that as , 6 or 12 consistent with other studies (Min et al., 2013; Zhang and Yin, 2018) while maintaining the total volumes of the large particles and the small particles constant. Simulations were performed by first allowing the large particles to sediment under the force of gravity to form a relatively porous cake. Then the small particles were introduced at the top of the cake and pressure was applied to allow small particle migration into the porous cake structure.
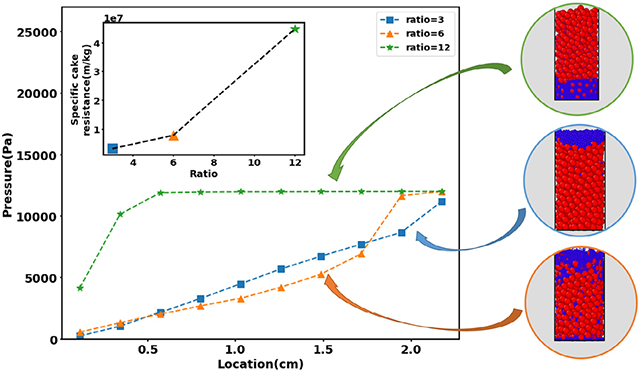
When the diameter ratio , the smaller particles barely penetrated the larger particles and generally remained above the interface formed by the two particle populations (Fig. 8a). More pronounced penetration was predicted when the diameter ratio was increased to 6 with some small particles migrating all the way through the cake to the filter medium (Fig. 8b). When the diameter ratio was increased further to 12, almost all small particles migrated to the filter medium due to their ability to navigate the porous structure formed by the larger particles (Fig. 8c). The formation of a dense particle region at the bottom of the cake resulted in a dramatic decrease in filtration performance with the specific cake resistance approximately an order-of-magnitude larger (Fig. 8d) and the filtrate mass flow rate approximately an order-of-magnitude smaller (Fig. 8e) than the values predicted for . Spatial profiles of the local pressure drop (Fig. 8f) showed an approximately linear pressure profile for while the formation of the dense particle region for resulted in a dramatic increase in pressure drop near the bottom of the cake.
Fig. 8.
Predicted effect of polydisperse particle size distributions on filtration performance when the suspension contains large spherical particles having a fixed diameter dp,pb = 1.8 mm and smaller spherical particles having an adjustable diameter dp,f . (Top) Visualization of the final cake structure when the diameter ratio , 6 or 12 (a–c) where the larger particles are red spheres and the smaller particles are blue spheres. (Bottom) Corresponding model predictions of (d) specific cake resistance (e) filtrate mass flow rate and (f) pressure drop spatial profile where 0 is the bottom of the cake. (For interpretation of the references to color in this figure legend, the reader is referred to the web version of this article.)
These simulations demonstrated the importance of the particle size distribution on filtration performance, especially when the suspension contained small fines along with larger particles. This predicted phenomenon could contribute to filter medium blinding where fine particles are trapped in the pores of the filter cloth that results in blockage and poor filterability (Sorensen et al., 1996). Experimental studies also have shown an increase in filtration resistance near the filter medium (Mattsson et al., 2012) due to the formation of a so-called skin layer (Lu et al., 2001). Our model predicts that such a skin layer could originate from a dense particle region near the filter medium which causes significant pressure drop across the cake and drastically increases the filtration time.
4. Conclusions
Pressure filtration is a common unit operation used for solid–liquid separations across many applications in the chemical, biotechnological, pharmaceutical and mineral processing industries. While experimental studies have shown that solid particle properties such as the particle size distribution can strongly affect cake resistance and filtrate flow, filtration process modeling has been largely limited to simple continuum models that lack the necessary detail to fundamentally connect the solid and liquid phases. Motivated by applications to other pharmaceutical operations such as granulation (Sen et al., 2014) and tableting coating (Suzzi et al., 2012), we developed a combined computational fluid dynamics (CFD) and discrete element method (DEM) model for the pressure filtration process. The CFD-DEM model directly accounted for the complexity of solids materials characteristic such as polydispersity and compressibility and the liquid properties such as viscosity and density. Unlike simple continuum descriptions, the CFD-DEM model allowed fundamental predictions of how particle properties affected porous cake structure, local cake resistance and filtrate flow. The model was successfully validated using cake resistance and filtrate flow data collected by filtering spherical glass beads and deionized water mixtures over a range of applied pressures and for two mean particle sizes.
Numerical experiments performed to study the effects of particle properties, liquid properties and operating conditions on filtration performance yielded the following conclusions:
Filtrate flow decreased with increasing liquid viscosity but was only a weak decreasing function of liquid density.
For monodisperse spheres, the average cake porosity was unaffected by particle size consistent with theoretical predictions (Farr, 2013). However, the particle size had a dramatic effect on cake resistance such that the filtrate mass flow rate decreased quadratically with decreasing particle radius.
Increasing polydispersity of the solid particles produced an increasing trend in the cake resistance only when the particle size distribution deviated strongly from the monodisperse case.
Small diameter fines produced a large decrease in the filtrate flow rate if the fines were sufficiently small to fill gaps between larger particles and reduce the local porosity.
Cake compressibility could be modeled by reducing the particle stiffness through the Young’s modulus parameter, thereby producing reduced average cake porosity and filtrate flow for sufficiently large applied pressures.
Having established this CFD-DEM model for the pressure filtration process, future work will focus on the incorporation of more realistic particle and liquid properties consistent with the filtration of active pharmaceutical ingredients (APIs). The first challenge will be the modeling of polydisperse, non-spherical particles such a platelet- and needle-like APIs that commonly constitute pharmaceutical suspensions (Macleod and Muller, 2012). We anticipate that such complex particle distributions will have a dramatic effect on filtration performance with respect to cake resistance and filtrate flow as a function of operating pressure (Bourcier et al., 2016). Additional extensions may include accounting for the effects of particle deformation, attrition and/or agglomeration on the particle size distribution and time-dependent filtration performance. Despite its current limitations, our coupled CFD-DEM model provides a starting point for fundamentally understanding cake filtration processes and predicting filtration performance.
HIGHLIGHTS.
Development and testing of CFD-DEM model for the pressure filtration process.
Simulation results agree with filtration data collected for spherical beads and deionized water.
Model allows quantification of particle distribution, liquid property and pressure effects.
Acknowledgements
We acknowledge Sunovion Pharmaceuticals for funding this project and Dr. David Schmidt (UMass Amherst) for guidance on OpenFOAM®. This work was supported in part by a Fellowship from the University of Massachusetts to KMD as part of the Biotechnology Training Program (National Research Service Award T32 GM108556).
Footnotes
Declaration of Competing Interest
The authors declare no competing financial interest.
References
- Bourcier D, Féraud JP, Colson D, Mandrick K, Ode D, Brackx E, Puel F, 2016. Influence of particle size and shape properties on cake resistance and compressibility during pressure filtration. Chem. Eng. Sci 144, 176–187. 10.1016/j.ces.2016.01.023. [DOI] [Google Scholar]
- Brilliantov NV, Pöschel T, 1998. Rolling friction of a viscous sphere on a hard plane. Europhys. Lett 42, 511–516. 10.1209/epl/i1998-00281-7. [DOI] [Google Scholar]
- Bruckard WJ, Woodcock JT, 2009. Recovery of valuable materials from aluminium salt cakes. Int. J. Miner. Process 93, 1–5. 10.1016/j.minpro.2009.05.002. [DOI] [Google Scholar]
- Bürger R, Concha F, Karlsen KH, 2001. Phenomenological model of filtration processes: 1. Cake formation and expression. Chem. Eng. Sci 56, 4537–4553. 10.1016/S0009-2509(01)00115-4. [DOI] [Google Scholar]
- Dong KJ, Zou RP, Yang RY, Yu AB, Roach G, 2009. DEM simulation of cake formation in sedimentation and filtration. Miner. Eng 22, 921–930. 10.1016/j.mineng.2009.03.018. [DOI] [Google Scholar]
- Ergun S, 1952. Fluid flow through packed columns. Chem. Eng. Prog 48, 89–94. [Google Scholar]
- Faber S, Al-maktoumi A, Kacimov A, Al-busaidi H, 2016. Migration and deposition of fine particles in a porous filter and alluvial deposit: laboratory experiments. Arab. J. Geosci 10.1007/s12517-016-2309-x. [DOI] [Google Scholar]
- Farr RS, 2013. Random close packing fractions of lognormal distributions of hard spheres. Powder Technol. 245, 28–34. 10.1016/j.powtec.2013.04.009. [DOI] [Google Scholar]
- Foley G, 2006. A review of factors affecting filter cake properties in dead-end microfiltration of microbial suspensions. J. Memb. Sci 274, 38–46. 10.1016/j.memsci.2005.12.008. [DOI] [Google Scholar]
- Goniva C, Kloss C, Deen NG, Kuipers JAM, Pirker S, 2012. Influence of rolling friction on single spout fluidized bed simulation. Particuology 10, 582–591. 10.1016/j.partic.2012.05.002. [DOI] [Google Scholar]
- Hager A, Kloss C, Pirker S, Goniva C, 2014. Parallel resolved open source CFD-DEM: method, validation and application. J. Comput. Multiph. Flows 6, 13–27. 10.1260/1757-482X.6.1.13. [DOI] [Google Scholar]
- He A, Wettlaufer JS, 2014. Hertz beyond belief. Soft Matter 10, 2264–2269. 10.1039/C3SM53063A. [DOI] [PubMed] [Google Scholar]
- Kloss C, Goniva C, Hager A, Amberger S, Pirker S, 2012. Models, algorithms and validation for opensource DEM and CFD-DEM. Prog. Comput. Fluid Dyn. An Int. J 12, 140 10.1504/PCFD.2012.047457. [DOI] [Google Scholar]
- Lichtenegger T, Pirker S, 2018. CFD-DEM modeling of strongly polydisperse particulate systems. Powder Technol. 325, 698–711. 10.1016/j.powtec.2017.11.058. [DOI] [Google Scholar]
- Lu W-M, Tung K-L, Hung S-M, Shiau J-S, Hwang K-J, 2001. Constant pressure filtration of mono-dispersed deformable particle slurry. Sep. Sci. Technol 36, 2355–2383. 10.1081/SS-100106098. [DOI] [Google Scholar]
- Lu X, Xie P, Ingham DB, Ma L, Pourkashanian M, 2018. A porous media model for CFD simulations of gas-liquid two-phase flow in rotating packed beds. Chem. Eng. Sci 189, 123–134. 10.1016/j.ces.2018.04.074. [DOI] [Google Scholar]
- Luding S, 1998. Collisions & contacts between two particles In: Herrmann HJ, Hovi J, Luding S (Eds.), Physics of Dry Granular Media. Springer Netherlands, Dordrecht, pp. 285–304. 10.1007/978-94-017-2653-5_20. [DOI] [Google Scholar]
- Macleod CS, Muller FL, 2012. On the fracture of pharmaceutical needle-shaped crystals during pressure filtration: case studies and mechanistic understanding. Org. Process Res. Dev 16, 425–434. 10.1021/op200279m. [DOI] [Google Scholar]
- Mattsson T, Sedin M, Theliander H, 2012. Filtration properties and skin formation of micro-crystalline cellulose. Sep. Purif. Technol 96, 139–146. 10.1016/j.seppur.2012.05.029. [DOI] [Google Scholar]
- Min F, Zhu W, Han X, 2013. Filter cake formation for slurry shield tunneling in highly permeable sand. Tunn. Undergr. Sp. Technol 38, 423–430. 10.1016/J.TUST.2013.07.024. [DOI] [Google Scholar]
- Murugesan S, Hallow DM, Vernille JP, Tom JW, Tabora JE, 2012. Lean filtration: approaches for the estimation of cake properties. Org. Process Res. Dev 16, 42–48. 10.1021/op2001468. [DOI] [Google Scholar]
- Murugesan S, Sharma PK, Tabora JE, 2010. Design of filtration and drying operations. Chem. Eng. Pharm. Ind. R&D to Manuf, 315–345 10.1002/9780470882221.ch17. [DOI] [Google Scholar]
- Peng Z, Doroodchi E, Luo C, Moghtaderi B, 2014. Influence of void fraction calculation on fidelity of CFD-DEM simulation of gas-solid bubbling fluidized beds. AIChE J. 60, 2000–2018. 10.1002/aic.14421. [DOI] [Google Scholar]
- Qian F, Huang N, Lu J, Han Y, 2014. CFD-DEM simulation of the filtration performance for fibrous media based on the mimic structure. Comput. Chem. Eng 71, 478–488. 10.1016/j.compchemeng.2014.09.018. [DOI] [Google Scholar]
- Sen M, Barrasso D, Singh R, Ramachandran R, 2014. A multi-scale hybrid CFD-DEM-PBM description of a fluid-bed granulation process. Processes 2, 89–111. 10.3390/pr2010089. [DOI] [Google Scholar]
- Sigma-Aldrich Inc., n.d. Glass beads, acid-washed [Online Document]. URL https://www.sigmaaldrich.com/content/dam/sigma-aldrich/docs/Sigma/Product_Information_Sheet/2/g8772pis.pdf (accessed 10.11.18).
- Sören S, Jürgen T, 2012. Simulation of a filtration process by DEM and CFD. Int. J. Mech. Eng. Mechatronics 1, 28–35 10.11159/ijmem.2012.004. [DOI] [Google Scholar]
- Sorensen PB, Moldrup P, Hansen JAA, 1996. Filtration and expression of compressible cakes. Chem. Eng. Sci 10.1016/0009-2509(95)00339-8. [DOI] [Google Scholar]
- Suzzi D, Toschkoff G, Radl S, Machold D, Fraser SD, Glasser BJ, Khinast JG, 2012. DEM simulation of continuous tablet coating: effects of tablet shape and fill level on inter-tablet coating variability. Chem. Eng. Sci 69, 107–121. 10.1016/j.ces.2011.10.009. [DOI] [Google Scholar]
- Tien C, 2002. Cake filtration research - A personal view. Powder Technol. 127, 1–8. 10.1016/S0032-5910(02)00063-3. [DOI] [Google Scholar]
- Tien C, Bai R, 2003. An assessment of the conventional cake filtration theory. Chem. Eng. Sci 58, 1323–1336. 10.1016/S0009-2509(02)00655-3. [DOI] [Google Scholar]
- Volk A, Ghia U, Liu GR, 2018. Assessment of CFD-DEM solution error against computational cell size for flows through a fixed-bed of binary-sized particles. Powder Technol. 325, 519–529. 10.1016/j.powtec.2017.11.051. [DOI] [Google Scholar]
- Volk A, Ghia U, Stoltz C, 2017. Effect of grid type and refinement method on CFD-DEM solution trend with grid size. Powder Technol. 311, 137–146. 10.1016/j.powtec.2017.01.088. [DOI] [Google Scholar]
- Walzel P, 2012. Ullmann’s encyclopedia of industrial chemistry. Ullmann’s Encycl. Ind. Chem 25 (1–25), 40 10.1002/14356007.b02. [DOI] [Google Scholar]
- Wen CY, Yu YH, 1966. A generalized method for predicting the minimum fluidization velocity. AIChE J 12, 610–612. 10.1002/aic.690120343. [DOI] [Google Scholar]
- Yue C, Zhang Q, Zhai Z, 2016. Numerical simulation of the filtration process in fibrous filters using CFD-DEM method. J. Aerosol Sci 101, 174–187. 10.1016/j.jaerosci.2016.08.004. [DOI] [Google Scholar]
- Zhang Z, Yin T, 2018. A coupled CFD-DEM simulation of slurry infiltration and filter cake formation during slurry shield tunneling. Infrastructures 1–11. 10.3390/infrastructures3020015. [DOI] [Google Scholar]
- Zhou YC, Wright BD, Yang RY, Xu BH, Yu AB, 1999. Rolling friction in the dynamic simulation of sandpile formation. Phys. A Stat. Mech. Appl 269, 536–553. 10.1016/S0378-4371(99)00183-1. [DOI] [Google Scholar]
- Zhu HP, Zhou ZY, Yang RY, Yu AB, 2007. Discrete particle simulation of particulate systems: theoretical developments. Chem. Eng. Sci 62, 3378–3396. 10.1016/j.ces.2006.12.089. [DOI] [Google Scholar]


