

Abstract
Objectives:
State policies regarding alcohol use during pregnancy (alcohol/pregnancy policies) have been in effect for more than 40 years. Previous research finds some policies increase adverse birth outcomes and decrease prenatal care utilization. This research examines whether effects of alcohol/pregnancy policies vary by race; the general hypothesis is that health benefits of policies are concentrated among White women and health harms of policies are concentrated among Black women.
Methods:
This study uses 1972-2015 Vital Statistics data and policy data from NIAAA’s Alcohol Policy Information System and original legal research. The dataset includes more than 150 million singleton births. Outcomes are preterm birth (PTB), low birthweight (LBW), and prenatal care utilization. Logistic regression models include raceXpolicy interaction terms as main predictors, adjust for individual- and state-level controls, include fixed effects for state, year and state-specific time trends, and account for clustering by state.
Results:
The impact of alcohol/pregnancy policies varied by race for preterm birth, varied in a few cases for low birthweight, and generally did not vary for prenatal care utilization. The hypothesis regarding the direction of differential effects was not supported. Six policies had an adverse impact on PTB and/or LBW for White women. Findings differed for Black women; for Black women, four policies had a beneficial impact for PTB and one had an adverse impact for LBW.
Conclusions:
The impact of alcohol/pregnancy policies on birth outcomes varies by race. Future research should explore why some policies appear to have opposite effects for White v. Black women.
Keywords: Legal Epidemiology, Alcohol, Pregnancy, Race
1. Introduction
Alcohol use during pregnancy causes multiple harms, including fetal alcohol syndrome, and has been a public health concern for more than 40 years (Jones and Smith, 1975; O’Leary and Bower, 2012; Segal et al., 1983; Sokol et al., 2003; Strandberg-Larsen et al., 2008). Many governments have adopted policies in response to alcohol use during pregnancy – particularly policies that single out alcohol use during pregnancy from other general population alcohol policies (Drabble et al., 2014; Hankin et al., 1993; O’Leary et al., 2007). In the U.S., some states’ pregnancy-specific policies (“alcohol/pregnancy policies”) have been in place for more than 40 years (Roberts et al., 2017). Today, almost all U.S. states have at least one alcohol/pregnancy policy (Roberts et al., 2017). These alcohol/pregnancy policies typically take either a supportive (i.e., providing information or services) or punitive (i.e., using punishments or threats of punishment) approach to influence behavior change (Drabble et al., 2014). Both policy approaches have increased over time in the U.S., although alcohol/pregnancy policy environments have become increasingly punitive (Roberts et al., 2017).
Minimal research has been conducted to evaluate impacts of state alcohol/pregnancy policies. With few exceptions (Cil, 2017), studies that evaluate impacts of state alcohol/pregnancy policies have typically found that these policies do not have intended impacts of reducing alcohol use during pregnancy or improving related health outcomes (Roberts et al., 2019; Subbaraman et al., 2018). In fact, a recent study found that some alcohol/pregnancy policies– particularly Mandatory Warning Signs, Priority Treatment for Pregnant Women, Prohibitions on Criminal Prosecution, and Child Abuse/Neglect policies (a combination of supportive and punitive approaches)– actually led to increases in adverse birth outcomes and decreased prenatal care utilization (Subbaraman et al., 2018). These findings suggest that while alcohol use during pregnancy causes public health harms (Jones and Smith, 1975; O’Leary and Bower, 2012; Segal et al., 1983; Sokol et al., 2003; Strandberg-Larsen et al., 2008), so do the policies adopted in response.
Given the possibility that state alcohol/pregnancy policies themselves may cause harms, it is important to investigate whether impacts are equally distributed across racial subgroups. Previous research indicates that policies pertaining to substance use during pregnancy are not applied equitably across racial subgroups (Chasnoff et al., 1990; Roberts and Nuru-Jeter, 2012; Roberts et al., 2015). For example, Black women and newborns are four to five times more likely than White women and newborns to be reported to Child Protective Services related to maternal substance use during pregnancy (Roberts and Nuru-Jeter, 2012; Roberts et al., 2015). Also, some state alcohol/pregnancy policy approaches rely on providing warnings to the public about harms from alcohol use during pregnancy, e.g., by posting mandatory warning signs in places where alcohol is sold, whereas other approaches directly provide services, e.g., by giving pregnant women priority in entering substance use disorder treatment (Drabble et al., 2014; Roberts et al., 2017). Black and White women could have differential exposure to these policies or different experiences with them.
Previously, we found that impacts of alcohol/pregnancy policies on alcohol use during pregnancy vary by race, although in no consistent direction (Roberts et al., 2018). This study builds on our previous research to examine whether effects of these polices on birth outcomes and prenatal care utilization vary by race. Associations between alcohol use during pregnancy and adverse birth outcomes considered– preterm birth and low birthweight– have been documented (O’Leary et al., 2009; Patra et al., 2011). The general hypothesis is that health benefits of policies (decreased adverse birth outcomes and increased prenatal care utilization) will be concentrated among White women, and harms of policies (increased adverse birth outcomes and decreased prenatal care utilization) will be concentrated among Black women.
2. Material and Methods
2.1. Study Design
This study used individual-level data from 1972-2015 Natality Birth Data (Vital Statistics) and state-level data from the Alcohol Policy Information System (APIS), original legal research, and other secondary sources. Specifically, it examined whether relationships between individual state-level policies, adverse birth outcomes (low birthweight, preterm birth), and prenatal care utilization vary by race. Analyses use logistic regression models with raceXpolicy interaction terms, fixed effects for state, year- and state-specific time trends, and key individual-level and state-level controls to account for other potential influences on outcomes.
2.2. Data Sources
This study used individual-level Vital Statistics data for 1972 – 2015 from the United States National Center for Health Statistics for birth outcomes (low birthweight, preterm birth), prenatal care utilization, and individual-level controls; NIAAA’s Alcohol Policy Information System (APIS) (NIAAA, 2016) and original legal research for alcohol and pregnancy policies; and secondary sources for state-level control variables.
Vital Statistics data include individual-level data for a 50% sample of births in the U.S. between 1972-1984 from all 50 states and Washington D.C. and, from 1985 onwards, include 100% of births. Analyses were restricted to singleton births because multiple births have higher likelihood of adverse birth outcomes (Powers and Kiely, 1994), our primary outcomes. Birthweight and preterm birth data are available throughout the study time period. Prenatal care utilization data were available from 43 states from 1972-1979 and in all states since 1980.
State-level alcohol/pregnancy policy statutory, regulatory, and effective date data were obtained from APIS and from original legal research using both Westlaw and HeinOnline, two online legal databases. The process for obtaining and coding these data has been described in detail elsewhere (Roberts et al., 2017). Briefly, this process involved 1) identifying and gathering relevant statutes and regulations; 2) identifying effective dates for each; 3) checking with states and secondary sources to ensure accuracy of data gathering and coding; 4) coding policies, including ensuring inter-rater reliability.
Data for state-level control variables were obtained from the U.S. Census, the U.S. Centers for Disease Control and Prevention, APIS, the National Alcohol Beverage Control Association, published research (Kerr and Barnett, 2017; Kerr et al., 2006; Martinez et al., 2019), and original legal research.
Alcohol/pregnancy policy data were merged with individual-level vital statistics data based on the month and year the woman became pregnant.
2.3. Measures
2.3.1. Outcomes.
Birth outcome variables include preterm birth (dichotomous, born before versus at or after 37 weeks gestation (Behrman and Stith Butler, 2007)) and low birthweight (dichotomous, born less versus at or more than 2500 grams (CDC, 2010)). Prenatal care utilization was measured in three ways: as any prenatal care, late entry (i.e., after the first trimester), and inadequate care (based on the Kotelchuck index, which accounts for timing of entry and number of visits (Kotelchuck, 1994)).
2.3.2. Alcohol/Pregnancy Policy Predictors.
State-level policies relating to alcohol use during pregnancy are the main independent variables. Five policies (Mandatory Warning Signs, Reporting for Data/Treatment Purposes, Priority Treatment for Pregnant Women, Priority Treatment for Pregnant Women and Women with Children, and Prohibitions on Criminal Prosecution) are considered supportive. Three policies (Child Abuse/Neglect, Civil Commitment, and CPS Reporting Requirements) are considered punitive. Per recent papers (Drabble et al., 2014; Roberts et al., 2017), priority treatment was divided into two – one for policies giving priority to pregnant women only and the other for policies giving priority to pregnant women and women with children. Reporting requirements was also divided into two – one for policies that involved reporting for data-surveillance or treatment referral purposes only and the other for policies that involved reporting for child welfare purposes. Each policy variable is dichotomous and coded as 0 if it was not in effect for the state of residence the month and year in which the woman became pregnant and 1 if it was in effect for the state of residence the month and year in which the woman became pregnant.
2.3.3. Individual-Level Controls.
Individual-level controls include maternal age (categorical: 15-19; 20-24; 25-29; 30-34; 35-39; 40-44; 45 or older), marital status (dichotomous), education (categorical: < high school, high school equivalent, > high school, missing), nativity (U.S. born, non-U.S. born, missing), and parity (categorical: nulliparous, 1 previous live birth, 2 previous live births, 3+ previous live births, missing).
2.3.4. Moderators.
Race is an effect modifier. Race is a categorical variable consisting of: White, Black, Asian/Pacific Islander, Other/Missing. While we present results for all race categories in tables, we focus interpretation on White versus Black comparisons. Measurement of maternal race changed in Vital Statistics; it began in 1989 and phased in during the 1990s, when a Hispanic ethnicity category was added. Per a-priori study plans, race coding was kept consistent, with women coded as Black or White regardless of whether they reported Hispanic ethnicity. Such an approach is reasonable because birth outcomes are similar between White non-Hispanic and (all) Hispanic births, both of which differ from Black birth outcomes (CDC and HRSA, 2000; Martin, 2011). In three models estimated, race was collapsed into 3 categories (White, Black, Other/Missing (which included Asian/Pacific Islander)) to improve model convergence. This collapsing of race categories did not help with convergence in two models that would not converge.
2.3.5. State-Level Controls.
State-level controls include state- and year-specific unemployment rate, poverty rate, per capita cigarette sales, retail control policies for wine and for spirits, and per capita alcohol consumption. Per capita alcohol consumption is used as a proxy for both regional drinking culture and other alcohol policies (such as Blood Alcohol Concentration, minimum legal drinking age) that influence alcohol consumption in general. Data sources include: Bureau of Labor Statistics for unemployment data, Census for decennial poverty rate data, and Centers for Disease Control and Prevention for cigarette sales data. Data on per capita tobacco sales were obtained from published sources. Data on per capita alcohol consumption were based on published research (Kerr et al., 2006; Martinez et al., 2019). Retail control policy data were obtained from APIS; retail control policy data prior to APIS were obtained from published research (Kerr and Barnett, 2017).
2.4. Statistical Analysis
2.4.1. Overall Approach.
Multivariable logistic regression models predicting individual-level outcomes (n=155,446,714) included all policy indicators simultaneously, included fixed effects for state, year- and state-specific time trends, adjusted for individual and state-level control variables, and accounted for clustering of standard errors according to mother’s state of residence. To assess for differential effects of policies by race, interactions between the moderator variable (race) and each policy were examined in separate models; that is, while all models included all policy indicators, only one raceXpolicy interaction term was included at a time. For example, in a model examining whether there were differential impacts of Mandatory Warning Signs by race, the model included all alcohol/pregnancy policies, all individual- and state-level control variables, fixed effects for state, year and state-specific time trends, and an interaction term of Mandatory Warning SignsXrace. Taking the most conservative approach, analyses included year fixed effects to account for changes in data gathering over time as well as other relevant events in those states and years, state-specific cubic time trends to address possible concerns with endogeneity, and birth certificate version indicator variables. First, we looked at whether the interaction was significant. Interactions were considered statistically significant if the Wald Test indicated the interaction was significant at p<.05 and the race-specific interaction term for a racial subgroup was statistically significant. Then, using both model output and results from post-estimation margins commands, we examined whether effects of the policy were significant and in what direction the policies had effects for racial subgroups, particularly for White and Black women. Specifically, whether the difference for a racial subgroup was statistically significant was assessed by: 1) whether the main effect for White women was statistically significant and 2) whether the 95% CI for the predicted marginal effect for that subgroup crossed zero. All analyses were performed in Stata v15.1.
All models included White, Black, Asian/Pacific Islander, and Other race women. Tables include results for all racial groups. In the results section, though, only results for White and Black women are presented, as these were the racial groups around which we had pre-specified hypotheses. Descriptions of findings for Asian/Pacific Islander and Other race women are included as an online-only appendix (Appendix 1)1.
2.4.2. Sensitivity Analyses.
Two sets of sensitivity analyses were conducted to inform interpretation of results. First, we considered whether the race coding in Vital Statistics data may have influenced results. We conducted a sensitivity analysis using 1989-2015 birth data in which maternal Hispanic ethnicity was collected in addition to maternal race. A 5-category race/ethnicity variable was used: non-Hispanic White, non-Hispanic Black, Hispanic, non-Hispanic Asian/Pacific Islander, or non-Hispanic other race/ethnicity. We noted situations where different patterns of results were identified between main analysis models (which used 1972-2015 data) and race/ethnicity models (which used 1989-2015 data). To assess whether it was the change in race coding or difference in years that yielded different results, we also estimated models using the same initial race coding as in our main analysis but limiting the data to 1989-2015 for comparability. We looked at these race-only 1989-2015 models only when results of main analysis models and race/ethnicity models differed.
Second, we considered potential effects of states’ drug use during pregnancy policies. Per a-priori study plans, alcohol/pregnancy policies were established as our main policy predictors of interest. However, most state policies that cover alcohol use during pregnancy also cover drug use, with the exception of Mandatory Warning Signs (Thomas et al., 2018). Because of this considerable overlap, it was not feasible to include both alcohol/pregnancy policies and drug/pregnancy policies in a model, nor was it possible to use a four-category variable (measuring whether a state had an alcohol policy only, drug policy only, alcohol and drug policy, or neither policy in effect). Instead, we conducted sensitivity analyses that estimated effects of policies that target alcohol and/or drug use during pregnancy using all years of data (1972-2015). We compared these results to our main analysis models that included alcohol/pregnancy policies only.
3. Results
3.1. Impact of Supportive Policies by Race
All supportive policies were associated with increased preterm birth, low birthweight, or both for White women, whereas some supportive policies were associated with decreased preterm birth for Black women, and one supportive policy was associated with increased low birthweight for Black women. One supportive policy was associated with decreased prenatal care use for both White and Black women, and one supportive policy was associated with increased prenatal care use for Black women.
Specifically, for White women, all supportive policies were associated with increased preterm birth (See Table 1a). Increases in the predicted probability of preterm birth ranged from 0.5% [95% CI 0.3%, 0.7%] and 0.5% [95% CI 0.2%, 0.8%] for Mandatory Warning Signs and Priority Treatment for Women and Women with Children to 1.1% [95% CI 0.6%, 1.6%] for Prohibitions on Criminal Prosecution (See Table 2a). The relationship between all five supportive policies and preterm birth differed for Black women compared to White women, as indicated by Wald tests of interaction terms and race-specific-interaction terms for Black women. Two supportive policies (Mandatory Warning Signs and Reporting Requirements for Data and Treatment Purposes) were associated with decreased preterm birth. Decreases in predicted probabilities of preterm birth for Black women when Mandatory Warning Signs and when Reporting Requirements for Data and Treatment Purposes were in effect were 0.8% in both cases (95% CIs of −1.3%, −0.3% and −1.4%, −0.2%, respectively). The other three supportive policies were not associated with preterm birth for Black women (See Figure 1).
Table 1a.
Interaction effects of supportive alcohol/pregnancy policies on birth outcomes and prenatal care utilization.
| Low Birthweight | Preterm Birth | Any Prenatal Care | Late Prenatal Care | Inadequate Prenatal Care | ||||||||||
|---|---|---|---|---|---|---|---|---|---|---|---|---|---|---|
| aOR | 95% CI | aOR | 95% CI | aOR | 95% CI | aOR | 95% CI | aOR | 95% CI | |||||
| MWS | 1.06 | [1.03-1.09] | 1.07 | [1.04-1.10] | 0.77 | [0.69-0.87] | 1.17 | [1.12-1.23] | 1.22 | [1.13-1.32] | ||||
| Race | ||||||||||||||
| White (reference) | ||||||||||||||
| Black | 2.01 | [1.95-2.07] | 1.75 | [1.71-1.80] | 0.63 | [0.52-0.76] | 1.47 | [1.36-1.60] | 1.48 | [1.36-1.62] | ||||
| Asian/PI | 1.49 | [1.43-1.56] | 1.25 | [1.21-1.29] | 1.09 | [0.82-1.46] | 1.20 | [1.05-1.36] | 1.20 | [1.03-1.39] | ||||
| Other/Missing | 1.09 | [1.00-1.20] | 1.22 | [1.16-1.29] | 0.69 | [0.60-0.79] | 1.49 | [1.41-1.57] | 1.55 | [1.44-1.68] | ||||
| Race*MWS | ||||||||||||||
| White (reference) | ||||||||||||||
| Black | 0.98 | [0.94-1.03] | 0.88 | [0.85-0.90] | 0.92 | [0.71-1.19] | 0.93 | [0.85-1.02] | 0.98 | [0.88-1.09] | ||||
| Asian/PI | 1.05 | [1.01-1.10] | 0.91 | [0.88-0.94] | 0.87 | [0.67-1.12] | 1.05 | [0.94-1.17] | 1.05 | [0.94-1.18] | ||||
| Other/Missing | 0.99 | [0.90-1.10] | 0.99 | [0.93-1.06] | 1.09 | [0.87-1.36] | 0.95 | [0.88-1.02] | 1.01 | [0.91-1.12] | ||||
| Wald test of Race*MWS | p<.01 | p<.001 | p=n.s. | p=n.s. | p=n.s. | |||||||||
| RR_DTx | 1.02 | [0.99-1.06] | 1.08 | [1.04-1.13] | 1.02 | [0.77-1.36] | 1.03 | [0.92-1.15] | 0.94 | [0.81-1.08] | ||||
| Race | ||||||||||||||
| White (reference) | ||||||||||||||
| Black | 2.02 | [1.96-2.09] | 1.78 | [1.73-1.83] | 0.63 | [0.52-0.77] | 1.49 | [1.37-1.62] | 1.49 | [1.36-1.62] | ||||
| Asian/PI | 1.47 | [1.42-1.52] | 1.25 | [1.21-1.30] | 1.13 | [0.87-1.47] | 1.19 | [1.06-1.33] | 1.19 | [1.03-1.37] | ||||
| Other/Missing | 1.09 | [0.98-1.21] | 1.25 | [1.20-1.29] | 0.74 | [0.63-0.86] | 1.47 | [1.37-1.58] | 1.56 | [1.43-1.69] | ||||
| Race*RR_DTx | ||||||||||||||
| White (reference) | ||||||||||||||
| Black | 0.97 | [0.93-1.01] | 0.86 | [0.82-0.90] | 0.91 | [0.73-1.13] | 0.91 | [0.84-0.99] | 0.97 | [0.89-1.06] | ||||
| Asian/PI | 1.08 | [1.06-1.11] | 0.91 | [0.88-0.94] | 0.83 | [0.72-0.95] | 1.06 | [0.97-1.16] | 1.06 | [0.96-1.17] | ||||
| Other/Missing | 1.01 | [0.91-1.13] | 0.94 | [0.90-0.97] | 0.85 | [0.66-1.11] | 0.97 | [0.84-1.13] | 1.00 | [0.85-1.19] | ||||
| Wald Test of Race*RR_DTx | p<.001 | p<.001 | p<.05 | p<.05 | p=n.s. | |||||||||
| PTxP | 1.08 | [1.05-1.12] | 1.11 | [1.06-1.15] | 1.07 | [0.87-1.31] | 1.02 | [0.90-1.16] | 0.99 | [0.85-1.16] | ||||
| Race | ||||||||||||||
| White (reference) | ||||||||||||||
| Black | 2.00 | [1.95-2.06] | 1.72 | [1.67-1.76] | 0.61 | [0.52-0.72] | 1.46 | [1.37-1.56] | 1.49 | [1.38-1.60] | ||||
| Asian/PI | 1.52 | [1.46-1.59] | 1.21 | [1.16-1.25] | 1.02 | [0.80-1.30] | 1.23 | [1.10-1.37] | 1.23 | [1.09-1.40] | ||||
| Other/Missing | 1.09 | [1.00-1.20] | 1.24 | [1.19-1.29] | 0.68 | [0.58-0.80] | 1.47 | [1.40-1.56] | 1.57 | [1.45-1.69] | ||||
| Race*PTxP | ||||||||||||||
| White (reference) | ||||||||||||||
| Black | 1.00 | [0.97-1.04] | 0.90 | [0.87-0.93] | 1.03 | [0.82-1.30] | 0.92 | [0.84-1.01] | 0.95 | [0.86-1.05] | ||||
| Asian/PI | 1.03 | [0.98-1.08] | 0.96 | [0.92-1.00] | 1.02 | [0.84-1.25] | 1.01 | [0.90-1.13] | 0.98 | [0.87-1.11] | ||||
| Other/Missing | 0.99 | [0.89-1.10] | 0.94 | [0.88-1.00] | 1.21 | [0.92-1.59] | 0.96 | [0.89-1.03] | 0.98 | [0.89-1.09] | ||||
| Wald Test of Race*PTxP | p=n.s. | p<.001 | p=n.s. | p=n.s. | p=n.s. | |||||||||
| PTxPWC | DNC | DNC | 1.06 | [1.03-1.10] | 1.05 | [0.86-1.29] | 0.97 | [0.90-1.05] | 0.98 | [0.88-1.10] | ||||
| Race | ||||||||||||||
| White (reference) | ||||||||||||||
| Black | DNC | DNC | 1.70 | [1.66-1.74] | 0.62 | [0.53-0.72] | 1.46 | [1.36-1.55] | 1.47 | [1.37-1.58] | ||||
| Asian/PI | DNC | DNC | 1.19 | [1.16-1.23] | 1.05 | [0.86-1.27] | 1.23 | [1.13-1.34] | 1.22 | [1.10-1.35] | ||||
| Other/Missing | DNC | DNC | 1.21 | [1.17-1.26] | 0.71 | [0.63-0.80] | 1.47 | [1.40-1.53] | 1.57 | [1.47-1.67] | ||||
| Race*PTxPWC | ||||||||||||||
| White (reference) | DNC | DNC | ||||||||||||
| Black | DNC | DNC | 0.93 | [0.90-0.95] | 0.87 | [0.60-1.28] | 0.94 | [0.86-1.03] | 1.00 | [0.85-1.18] | ||||
| Asian/PI | DNC | DNC | 0.99 | [0.92-1.05] | 0.82 | [0.72-0.94] | 0.99 | [0.89-1.10] | 1.08 | [0.96-1.21] | ||||
| Other/Missing | DNC | DNC | 1.08 | [0.97-1.21] | 0.84 | [0.73-0.98] | 0.93 | [0.81-1.08] | 0.91 | [0.80-1.03] | ||||
| Wald Test of Race*PTxPWC | DNC | p<.001 | p<.05 | p=n.s. | p=n.s. | |||||||||
| PCP | 1.10 | [1.04-1.17] | 1.14 | [1.08-1.21] | 0.95 | [0.77-1.18] | 0.97 | [0.88-1.07] | DNC | DNC | ||||
| Race | ||||||||||||||
| White (reference) | ||||||||||||||
| Black | 2.01 | [1.95-2.07] | 1.70 | [1.66-1.73] | 0.61 | [0.53-0.71] | 1.45 | [1.36-1.55] | DNC | DNC | ||||
| Asian/PI | 1.54 | [1.51-1.57] | 1.19 | [1.16-1.22] | 1.03 | [0.84-1.27] | 1.23 | [1.13-1.34] | DNC | DNC | ||||
| Other/Missing | 1.09 | [1.00-1.19] | 1.22 | [1.17-1.27] | 0.70 | [0.62-0.79] | 1.46 | [1.40-1.53] | DNC | DNC | ||||
| Race*PCP | ||||||||||||||
| White (reference) | ||||||||||||||
| Black | 0.95 | [0.90-1.00] | 0.91 | [0.87-0.95] | 0.97 | [0.77-1.22] | 0.90 | [0.83-0.98] | DNC | DNC | ||||
| Asian/PI | 0.98 | [0.92-1.03] | 0.99 | [0.92-1.07] | 0.91 | [0.74-1.11] | 0.95 | [0.84-1.08] | DNC | DNC | ||||
| Other/Missing | 1.04 | [0.93-1.16] | 0.93 | [0.88-0.98] | 1.20 | [0.91-1.59] | 0.91 | [0.83-0.99] | DNC | DNC | ||||
| Wald Test of Race*PCP | p=n.s. | p<.001 | p=n.s. | p<.05 | DNC | |||||||||
All models test the interaction of maternal race on all eight policies separately and adjusted for state, year and state-specific time trends and adjusted for individual- and state-level covariates (including all other pregnancy-specific alcohol policies). Models also adjusted standard errors to reflect clustering at the state level. The Wald test uses the Chi-square distribution and tests the hypothesis that all coefficients in the interaction term are 0.
Bold indicates p<.05.
DNC: One model predicting the effect of Priority Treatment for Pregnant Women and Women with Children policies on low birthweight did not converge, regardless of race categorization. One model predicting the effect of Prohibitions on Criminal Prosecution policies on inadequate prenatal care did not converge, regardless of race categorization.
Table 2a.
Predicted probability and average marginal effects of supportive and punitive policies on birth outcomes, by race.
| Low Birthweight | Preterm Birth | ||||||||
|---|---|---|---|---|---|---|---|---|---|
| No policy | Policy | Average ME | 95% CI | No policy | Policy | Average ME | 95% CI | ||
| Supportive | |||||||||
| MWS | |||||||||
| White | 0.051 | 0.054 | 0.003 | 0.002-0.004 | 0.085 | 0.090 | 0.005 | 0.003-0.007 | |
| Black | 0.098 | 0.101 | 0.004 | 0.000-0.008 | 0.140 | 0.132 | −0.008 | −0.013- −0.003 | |
| Asian/PI | 0.075 | 0.082 | 0.008 | 0.005-0.011 | 0.104 | 0.101 | −0.002 | −0.005-0.001 | |
| Other/Missing | 0.056 | 0.059 | 0.003 | −0.003-0.008 | 0.102 | 0.107 | 0.006 | 0.000-0.011 | |
| RR_DTx | |||||||||
| White | 0.052 | 0.053 | 0.001 | −0.001-0.003 | 0.084 | 0.091 | 0.006 | 0.003-0.010 | |
| Black | 0.099 | 0.098 | −0.001 | −0.005-0.004 | 0.140 | 0.132 | −0.008 | −0.014- −0.002 | |
| Asian/PI | 0.074 | 0.081 | 0.007 | 0.004-0.010 | 0.103 | 0.102 | −0.001 | −0.005-0.003 | |
| Other/Missing | 0.056 | 0.058 | 0.002 | −0.004-0.007 | 0.103 | 0.104 | 0.001 | −0.002-0.005 | |
| PTxP | |||||||||
| White | 0.051 | 0.055 | 0.004 | 0.002-0.006 | 0.085 | 0.093 | 0.008 | 0.005-0.012 | |
| Black | 0.097 | 0.105 | 0.008 | 0.003-0.012 | 0.137 | 0.136 | −0.001 | −0.009-0.006 | |
| Asian/PI | 0.076 | 0.084 | 0.008 | 0.005-0.011 | 0.101 | 0.107 | 0.006 | 0.000-0.012 | |
| Other/Missing | 0.056 | 0.060 | 0.004 | −0.002-0.009 | 0.103 | 0.107 | 0.003 | −0.002-0.009 | |
| PTxPWC | |||||||||
| White | DNC | DNC | DNC | DNC | 0.086 | 0.091 | 0.005 | 0.002-0.008 | |
| Black | DNC | DNC | DNC | DNC | 0.138 | 0.136 | −0.001 | −0.007-0.004 | |
| Asian/PI | DNC | DNC | DNC | DNC | 0.101 | 0.106 | 0.004 | −0.002-0.010 | |
| Other/Missing | DNC | DNC | DNC | DNC | 0.103 | 0.117 | 0.014 | 0.000-0.027 | |
| PCP | |||||||||
| White | 0.052 | 0.057 | 0.005 | 0.002-0.008 | 0.086 | 0.097 | 0.011 | 0.006-0.016 | |
| Black | 0.099 | 0.103 | 0.004 | −0.003-0.011 | 0.137 | 0.142 | 0.004 | −0.005-0.014 | |
| Asian/PI | 0.078 | 0.083 | 0.005 | −0.001-0.011 | 0.101 | 0.113 | 0.012 | 0.004-0.020 | |
| Other/Missing | 0.056 | 0.064 | 0.007 | 0.001-0.014 | 0.103 | 0.108 | 0.005 | −0.003-0.014 | |
| Punitive | |||||||||
| CACN | |||||||||
| White | 0.051 | 0.055 | 0.003 | 0.001-0.006 | 0.085 | 0.094 | 0.009 | 0.005-0.013 | |
| Black | 0.098 | 0.101 | 0.003 | −0.001-0.007 | 0.138 | 0.136 | −0.002 | −0.007-0.003 | |
| Asian/PI | 0.069 | 0.075 | 0.005 | 0.000-0.011 | 0.100 | 0.106 | 0.005 | 0.000-0.011 | |
| Other/Missing | DNC | DNC | DNC | DNC | 0.103 | 0.106 | 0.004 | −0.002-0.009 | |
| CC | |||||||||
| White | 0.052 | 0.054 | 0.002 | −0.005-0.008 | 0.087 | 0.089 | 0.003 | −0.007-0.012 | |
| Black | 0.099 | 0.101 | 0.003 | −0.001-0.007 | 0.138 | 0.126 | −0.012 | −0.019- −0.005 | |
| Asian/PI | 0.078 | 0.081 | 0.003 | −0.006-0.012 | 0.101 | 0.105 | 0.004 | −0.005-0.013 | |
| Other/Missing | 0.057 | 0.053 | −0.004 | −0.011-0.002 | 0.104 | 0.101 | −0.003 | −0.013-0.007 | |
| RR_CPS | |||||||||
| White | 0.052 | 0.052 | 0.000 | −0.002-0.003 | 0.087 | 0.086 | 0.000 | −0.005-0.004 | |
| Black | 0.099 | 0.096 | −0.003 | −0.007-0.000 | 0.141 | 0.124 | −0.017 | −0.023- −0.011 | |
| Asian/PI | 0.069 | 0.073 | 0.004 | −0.001-0.009 | 0.103 | 0.099 | −0.004 | −0.010-0.002 | |
| Other/Missing | DNC | DNC | DNC | DNC | 0.105 | 0.099 | −0.006 | −0.012-0.000 | |
Models display the predicted probability (predictive margins) of outcomes based on models testing the interaction of each policy and maternal race in separate logistic regression models that included fixed effects for state, year and state-specific time trends and adjusted for individual- and state-level covariates, including all other pregnancy-specific alcohol policies.
Bold indicates p<.05.
DNC: Two models predicting low birthweight did not converge using 4-category race variable. Results for Child Abuse/Neglect and CPS Reporting Requirements use a 3-category race variable in which Asian/PI and Other/Missing data were collapsed into single category. One model predicting the effect of Priority Treatment for Pregnant Women and Women with Children policies on low birthweight did not converge, regardless of race categorization.
Figure 1.
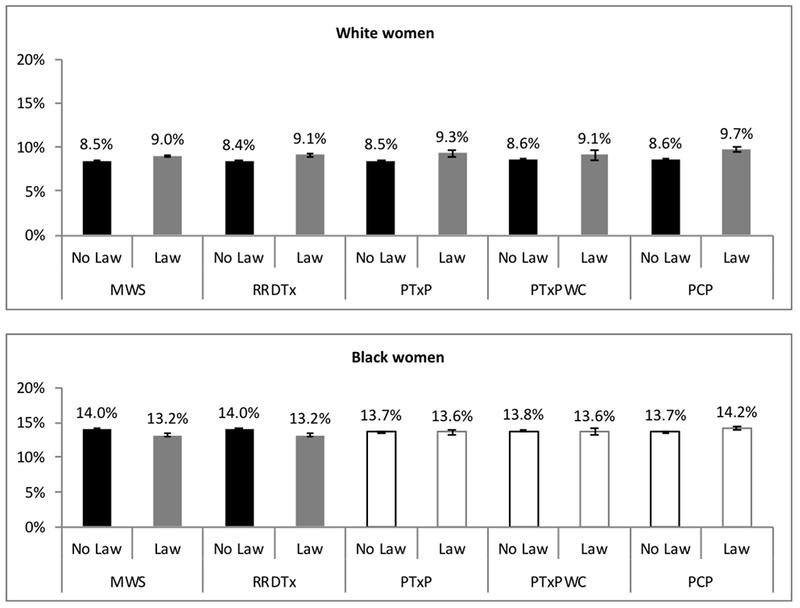
Differential impact of supportive policies on preterm birth by race.
Bars that are outlined only are where the differences were not statistically significant.
For White women, three of the four supportive policies (Mandatory Warning Signs, Priority Treatment for Pregnant Women Only, and Prohibitions on Criminal Prosecution) for which models converged were associated with increased low birthweight (See Table 1a). Increases in predicted probability of low birthweight were noted for all three policies [0.3% (95% CI 0.2%, 0.4%),0.4% (95% CI 0.2%, 0.6%), and 0.5% (95% CI 0.2%, 0.8%), respectively] (See Table 2a). The model for Priority Treatment for Pregnant Women and Women with Children would not converge. Based on Wald Tests and race-specific-interaction terms for Black women, there were no statistically significant differences in relationships for Black women compared to White women, although only one policy (Priority Treatment for Pregnant Women Only) had predicted probabilities that indicated a significant effect. For Black women, similar to White women, low birthweight was higher when Priority Treatment for Pregnant Women Only was in effect [0.8% higher (95% CI 0.3%, 1.2%)]. Based on predicted probabilities, none of the other supportive policies were associated with low birthweight for Black women.
For White women, only one supportive policy (Mandatory Warning Signs) was associated with prenatal care utilization (See Table 1a). For White women, Mandatory Warning Signs was associated with increases in no prenatal care [0.3% (95% CI 0.2%, 0.5%)], late prenatal care [2.4% (95% CI 1.7%, 3.1%)], and inadequate prenatal care [2.3% (95% CI 1.4%, 3.2%)] (See Table 2a). Based on Wald Tests and race-specific-interaction terms for Black women, findings for Black women (compared to White women) differed for Reporting Requirements for Data and Treatment Purposes and Prohibitions on Criminal Prosecution for late prenatal care. Predicted probabilities indicated a significant effect of Prohibitions on Criminal Prosecution [−2.3% (95% CI −4.2%, −0.4%)] policies for Black women but not Reporting Requirements for Data and Treatment Purposes. For Black women, similar to White women, Mandatory Warning Signs was associated with less prenatal care, specifically increased no prenatal care [0.7% (95% CI 0.3%, 1.1%)] and increased inadequate prenatal care [2.5% (95% CI 0.8%, 4.2%)].
3.2. Impact of Punitive Policies by Race
One punitive policy was associated with increased preterm birth and low birthweight for White women, two were associated with decreased preterm birth for Black women, and one was associated with an increase in prenatal care for Black women. For White women, one of three punitive policies (Child Abuse/Neglect) was associated with increased preterm birth (See Table 1b). The increase in preterm birth for White women when Child Abuse/Neglect was in effect was [0.9% (95% CI 0.5%, 1.3%)] (See Table 2b). Based on Wald tests of interaction terms and race-specific-interaction terms for Black women, findings for Black women differed from those of White women across all three punitive policies. Based on predicted probabilities, for Black women, two of the three punitive policies (Civil Commitment and CPS Reporting Requirements) were associated with decreased preterm birth [−1.2% (95% CI −1.9%, −0.5%) and −1.7% (95% CI −2.3%, −1.1%), respectively] (See Figure 2).
Table 1b.
Interaction effects of punitive alcohol/pregnancy policies on birth outcomes and prenatal care utilization.
| Low Birthweight | Preterm Birth | Any Prenatal Care | Late Prenatal Care | Inadequate Prenatal Care | ||||||||||
|---|---|---|---|---|---|---|---|---|---|---|---|---|---|---|
| aOR | 95% CI | aOR | 95% CI | aOR | 95% CI | aOR | 95% CI | aOR | 95% CI | |||||
| CACN | 1.07 | [1.02-1.12] | 1.12 | [1.07-1.18] | 0.90 | [0.80-1.02] | 0.99 | [0.93-1.06] | 1.08 | [0.98-1.20] | ||||
| Race | ||||||||||||||
| White (reference) | ||||||||||||||
| Black | 2.02 | [1.96-2.08] | 1.74 | [1.70-1.78] | 0.60 | [0.51-0.71] | 1.49 | [1.38-1.59] | 1.49 | [1.39-1.61] | ||||
| Asian/PI | 1.38 | [1.30-1.47] | 1.21 | [1.16-1.25] | 1.06 | [0.83-1.35] | 1.23 | [1.13-1.34] | 1.22 | [1.10-1.35] | ||||
| Other/Missing | DNC | 1.24 | [1.19-1.29] | 0.69 | [0.61-0.79] | 1.48 | [1.41-1.56] | 1.57 | [1.48-1.66] | |||||
| Race*CACN | ||||||||||||||
| White (reference) | ||||||||||||||
| Black | 0.97 | [0.91-1.02] | 0.88 | [0.83-0.92] | 1.07 | [0.84-1.36] | 0.88 | [0.80-0.96] | 0.94 | [0.83-1.05] | ||||
| Asian/PI | 1.01 | [0.93-1.11] | 0.94 | [0.89-1.00] | 0.88 | [0.75-1.03] | 1.00 | [0.89-1.13] | 1.04 | [0.92-1.17] | ||||
| Other/Missing | 0.93 | [0.88-0.98] | 1.13 | [0.95-1.34] | 0.94 | [0.86-1.02] | 0.97 | [0.87-1.07] | ||||||
| Wald Test of Race*CACN | p=n.s. | p<.001 | p<.05 | p<.01 | p=n.s. | |||||||||
| CC | 1.03 | [0.90-1.18] | 1.03 | [0.92-1.16] | 0.77 | [0.38-1.54] | 1.15 | [0.97-1.37] | 0.86 | [0.64-1.15] | ||||
| Race | ||||||||||||||
| White (reference) | ||||||||||||||
| Black | 2.00 | [1.95-2.06] | 1.69 | [1.66-1.72] | 0.61 | [0.53-0.71] | 1.45 | [1.36-1.54] | 1.48 | [1.38-1.58] | ||||
| Asian/PI | 1.54 | [1.51-1.57] | 1.19 | [1.16-1.22] | 1.03 | [0.84-1.26] | 1.22 | [1.13-1.33] | 1.22 | [1.11-1.34] | ||||
| Other/Missing | 1.10 | [1.01-1.20] | 1.22 | [1.19-1.26] | 0.71 | [0.64-0.80] | 1.46 | [1.39-1.53] | 1.55 | [1.47-1.64] | ||||
| Race*CC | ||||||||||||||
| White (reference) | ||||||||||||||
| Black | 1.00 | [0.90-1.11] | 0.87 | [0.79-0.96] | 1.07 | [0.78-1.47] | 0.85 | [0.78-0.93] | 0.95 | [0.85-1.06] | ||||
| Asian/PI | 1.01 | [0.91-1.13] | 1.01 | [0.97-1.05] | 1.02 | [0.88-1.19] | 1.31 | [1.13-1.51] | 1.31 | [1.18-1.45] | ||||
| Other/Missing | 0.89 | [0.80-0.99] | 0.93 | [0.83-1.06] | 0.86 | [0.50-1.47] | 0.98 | [0.84-1.14] | 1.07 | [0.83-1.39] | ||||
| Wald Test of Race*CC | p<.05 | p<.001 | p=n.s. | p<.001 | p<.001 | |||||||||
| RR_CPS | 0.98 | [0.93-1.03] | 0.99 | [0.94-1.05] | 0.92 | [0.71-1.20] | 1.07 | [0.97-1.18] | 1.13 | [0.95-1.34] | ||||
| Race | ||||||||||||||
| White (reference) | ||||||||||||||
| Black | 2.02 | [1.96-2.08] | 1.73 | [1.68-1.78] | 0.62 | [0.52-0.72] | 1.48 | [1.38-1.58] | 1.50 | [1.39-1.61] | ||||
| Asian/PI | 1.37 | [1.28-1.46] | 1.20 | [1.16-1.25] | 1.04 | [0.83-1.29] | 1.20 | [1.06-1.34] | 1.20 | [1.06-1.36] | ||||
| Other/Missing | DNC | 1.24 | [1.19-1.29] | 0.72 | [0.62-0.84] | 1.45 | [1.35-1.54] | 1.53 | [1.42-1.65] | |||||
| Race*RR_CPS | ||||||||||||||
| White (reference) | ||||||||||||||
| Black | 0.96 | [0.92-1.00] | 0.87 | [0.84-0.90] | 0.97 | [0.80-1.18] | 0.89 | [0.83-0.95] | 0.91 | [0.84-0.99] | ||||
| Asian/PI | 1.05 | [0.96-1.14] | 0.96 | [0.92-1.01] | 0.96 | [0.83-1.12] | 1.07 | [0.96-1.20] | 1.06 | [0.95-1.19] | ||||
| Other/Missing | DNC | 0.94 | [0.90-0.98] | 0.90 | [0.61-1.33] | 1.04 | [0.89-1.21] | 1.08 | [0.91-1.28] | |||||
| Wald Test of Race*RR_CPS | p<.001 | p<.001 | p=n.s. | p<.001 | p<.001 | |||||||||
All models test the interaction of maternal race on all eight policies separately and adjusted for state, year and state-specific time trends and adjusted for individual- and state-level covariates (including all other pregnancy-specific alcohol policies). Models also adjusted standard errors to reflect clustering at the state level. The Wald test uses the Chi-square distribution and tests the hypothesis that all coefficients in the interaction term are 0.
Bold indicates p<.05.
DNC: Two models predicting low birthweight did not converge using 4-category race variable. Results for Child Abuse/Neglect and CPS Reporting Requirements use a 3-category race variable in which Asian/PI and Other/Missing data were collapsed into single category.
aOR, adjusted odds ratio
Table 2b.
Predicted probability and average marginal effects of supportive and punitive policies on prenatal care utilization, by race.
| No Prenatal Care | Late Prenatal Care | Inadequate Prenatal Care | ||||||||||||
|---|---|---|---|---|---|---|---|---|---|---|---|---|---|---|
| No policy | Policy | Average ME | 95% CI | No policy | Policy | Average ME | 95% CI | No policy | Policy | Average ME | 95% CI | |||
| Supportive | ||||||||||||||
| MWS | ||||||||||||||
| White | 0.012 | 0.015 | 0.003 | 0.002-0.005 | 0.204 | 0.228 | 0.024 | 0.017-0.031 | 0.136 | 0.159 | 0.023 | 0.014-0.032 | ||
| Black | 0.019 | 0.026 | 0.007 | 0.003-0.011 | 0.265 | 0.281 | 0.015 | −0.004-0.034 | 0.183 | 0.208 | 0.025 | 0.008-0.042 | ||
| Asian/PI | 0.011 | 0.016 | 0.005 | 0.003-0.007 | 0.231 | 0.265 | 0.034 | 0.015-0.053 | 0.156 | 0.188 | 0.032 | 0.013-0.051 | ||
| Other/Missing | 0.017 | 0.020 | 0.003 | −0.001-0.007 | 0.267 | 0.286 | 0.019 | 0.003-0.035 | 0.190 | 0.220 | 0.030 | 0.014-0.047 | ||
| RR_DTx | ||||||||||||||
| White | 0.013 | 0.013 | 0.000 | −0.004-0.003 | 0.209 | 0.213 | 0.004 | −0.012-0.020 | 0.145 | 0.137 | −0.007 | −0.023-0.008 | ||
| Black | 0.020 | 0.021 | 0.001 | −0.004-0.007 | 0.273 | 0.263 | −0.011 | −0.031-0.009 | 0.195 | 0.182 | −0.013 | −0.029-0.003 | ||
| Asian/PI | 0.011 | 0.013 | 0.002 | −0.001-0.005 | 0.235 | 0.249 | 0.014 | −0.007-0.036 | 0.165 | 0.164 | −0.001 | −0.021-0.019 | ||
| Other/Missing | 0.017 | 0.020 | 0.002 | −0.003-0.008 | 0.271 | 0.272 | 0.001 | −0.029-0.030 | 0.201 | 0.193 | −0.009 | −0.036-0.019 | ||
| PTxP | ||||||||||||||
| White | 0.013 | 0.012 | −0.001 | −0.003-0.002 | 0.210 | 0.213 | 0.003 | −0.015-0.022 | 0.142 | 0.141 | −0.001 | −0.018-0.016 | ||
| Black | 0.021 | 0.019 | −0.002 | −0.007-0.003 | 0.271 | 0.261 | −0.011 | −0.030-0.009 | 0.191 | 0.183 | −0.009 | −0.030-0.013 | ||
| Asian/PI | 0.013 | 0.012 | −0.001 | −0.003-0.001 | 0.242 | 0.246 | 0.004 | −0.019-0.027 | 0.167 | 0.164 | −0.003 | −0.026-0.020 | ||
| Other/Missing | 0.019 | 0.015 | −0.004 | −0.009-0.001 | 0.273 | 0.268 | −0.004 | −0.027-0.018 | 0.199 | 0.195 | −0.004 | −0.028-0.021 | ||
| PTxPWC | ||||||||||||||
| White | 0.013 | 0.012 | −0.001 | −0.003-0002 | 0.211 | 0.207 | −0.004 | −0.015-0.007 | 0.142 | 0.140 | −0.002 | −0.014-0.011 | ||
| Black | 0.020 | 0.022 | 0.002 | −0.007-0.010 | 0.271 | 0.256 | −0.016 | −0.039-0.008 | 0.190 | 0.188 | −0.002 | −0.034-0.030 | ||
| Asian/PI | 0.012 | 0.014 | 0.002 | 0.000-0.004 | 0.243 | 0.237 | −0.006 | −0.030-0.018 | 0.166 | 0.173 | 0.007 | −0.018-0.032 | ||
| Other/Missing | 0.018 | 0.020 | 0.002 | −0.002-0.006 | 0.273 | 0.256 | −0.016 | −0.042-0.009 | 0.199 | 0.184 | −0.015 | −0.028- −0.002 | ||
| PCP | ||||||||||||||
| White | 0.013 | 0.013 | 0.001 | −0.002-0.003 | 0.211 | 0.206 | −0.005 | −0.019-0.010 | DNC | DNC | DNC | DNC | ||
| Black | 0.020 | 0.022 | 0.001 | −0.003-0.006 | 0.271 | 0.248 | −0.023 | −0.042- −0.004 | DNC | DNC | DNC | DNC | ||
| Asian/PI | 0.012 | 0.014 | 0.002 | −0.001-0.005 | 0.243 | 0.230 | −0.013 | −0.035-0.009 | DNC | DNC | DNC | DNC | ||
| Other/Missing | 0.018 | 0.016 | −0.002 | −0.006-0.001 | 0.272 | 0.250 | −0.022 | −0.045-0.001 | DNC | DNC | DNC | DNC | ||
| Punitive | ||||||||||||||
| CACN | ||||||||||||||
| White | 0.012 | 0.014 | 0.001 | 0.000-0.003 | 0.211 | 0.210 | −0.001 | −0.010-0.008 | 0.140 | 0.149 | 0.009 | −0.003-0.021 | ||
| Black | 0.020 | 0.021 | 0.001 | −0.004-0.005 | 0.275 | 0.251 | −0.023 | −0.039- −0.008 | 0.190 | 0.192 | 0.002 | −0.014-0.018 | ||
| Asian/PI | 0.012 | 0.015 | 0.003 | 0.000-0.005 | 0.243 | 0.242 | −0.001 | −0.020-0.019 | 0.163 | 0.178 | 0.015 | −0.005-0.035 | ||
| Other/Missing | 0.018 | 0.017 | 0.000 | −0.004-0.003 | 0.274 | 0.262 | −0.012 | −0.027-0.003 | 0.197 | 0.203 | 0.006 | −0.013-0.026 | ||
| CC | ||||||||||||||
| White | 0.013 | 0.016 | 0.004 | −0.007-0.015 | 0.210 | 0.232 | 0.021 | −0.005-0.048 | 0.142 | 0.126 | −0.016 | −0.046-0.014 | ||
| Black | 0.020 | 0.024 | 0.004 | −0.007-0.015 | 0.270 | 0.267 | −0.003 | −0.032-0.025 | 0.191 | 0.164 | −0.026 | −0.072-0.019 | ||
| Asian/PI | 0.012 | 0.016 | 0.003 | −0.009-0.015 | 0.241 | 0.313 | 0.071 | 0.049-0.093 | 0.166 | 0.180 | 0.015 | −0.029-0.059 | ||
| Other/Missing | 0.018 | 0.026 | 0.009 | −0.004-0.021 | 0.271 | 0.292 | 0.021 | −0.010-0.051 | 0.198 | 0.186 | −0.011 | −0.082-0.059 | ||
| RR_CPS | ||||||||||||||
| White | 0.013 | 0.014 | 0.001 | −0.002-0.005 | 0.209 | 0.218 | 0.010 | −0.005-0.025 | 0.140 | 0.153 | 0.014 | −0.006-0.003 | ||
| Black | 0.020 | 0.022 | 0.002 | −0.005-0.010 | 0.271 | 0.261 | −0.010 | −0.033-0.014 | 0.189 | 0.193 | 0.004 | −0.023-0.031 | ||
| Asian/PI | 0.012 | 0.014 | 0.002 | −0.003-0.006 | 0.236 | 0.259 | 0.023 | −0.005-0.051 | 0.161 | 0.184 | 0.024 | −0.007-0.055 | ||
| Other/Missing | 0.017 | 0.021 | 0.003 | −0.003-0.010 | 0.268 | 0.285 | 0.018 | −0.017-0.053 | 0.192 | 0.221 | 0.029 | −0.002-0.060 | ||
Models display the predicted probability (predictive margins) of outcomes based on models testing the interaction of each policy and maternal race in separate logistic regression models that included fixed effects for state, year and state-specific time trends and adjusted for individual- and state-level covariates, including all other pregnancy-specific alcohol policies.
Bold indicates p<.05.
DNC: One model predicting the effect of Prohibitions on Criminal Prosecution policies on inadequate prenatal care did not converge, regardless of race categorization.
Figure 2.
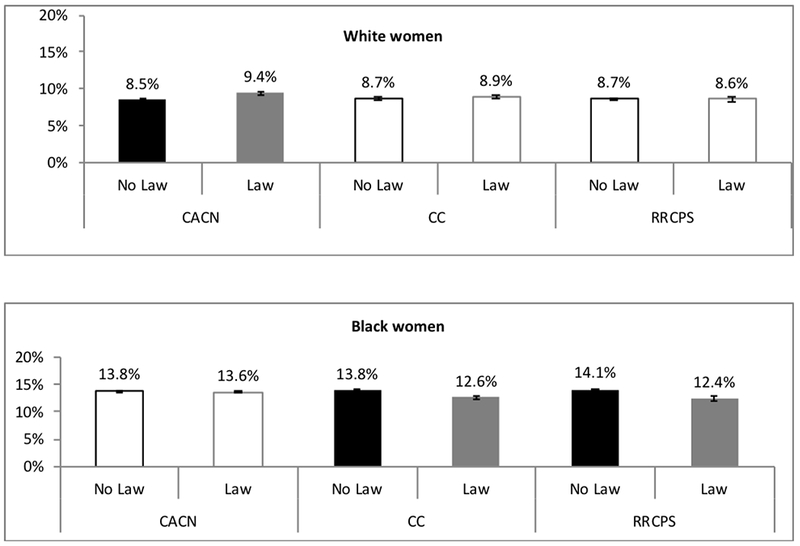
Differential impact of punitive policies on preterm birth by race.
Bars that are outlined only are where the differences were not statistically significant.
For White women, one of three punitive policies (Child Abuse/Neglect) was associated with increased low birthweight (See Table 1b). The increase in low birthweight for White women when Child Abuse/Neglect was in effect was [0.3% (95% CI 0.1%, 0.6%)] (See Table 2b). Based on Wald tests and race-specific-interaction terms for Black women, findings for Black women differed for White women for CPS Reporting Requirements but not the other two punitive policies. Based on predicted probabilities, however, no punitive policies were associated with low birthweight for Black women.
For White women, no punitive policies were associated with prenatal care utilization (See Table 1b). Based on Wald tests and race-specific-interaction terms for Black women, findings for Black women differed from White women for late prenatal care for all three punitive policies and inadequate prenatal care for CPS Reporting Requirements (See Table 2b). Based on predicted probabilities, however, punitive policies were typically not associated with prenatal care utilization for Black women. The only significant association between a punitive policy and prenatal care utilization for Black women was that Child Abuse/Neglect was associated with decreased late prenatal care [−2.3% (95% CI −3.9%, −0.8%)].
3.3. Sensitivity Analyses
3.3.1. Race/Ethnicity Measurement Sensitivity Analyses.
For both preterm birth and low birthweight, findings for White women were the same across the all 1972-2015 main models that converged and the 1989-2015 models that used the revised race/ethnicity variable. The Black versus White differences varied in a minority of the low birthweight models, and a majority of the preterm birth models between the 1972-2015 main models and the 1989-2015 race/ethnicity models. In models examining prenatal care outcomes, findings for White women were consistent in most, but not all, models; findings for Black-White comparisons were also consistent in most, but not all, models. There was not a clear pattern for inconsistencies, as inconsistencies were due to both race/ethnicity measurement and included years. However, differences appeared to be primarily changes in statistical significance, likely a result of sample size differences rather than changes in direction or magnitude of point estimates.
3.3.2. Alcohol v. Alcohol + Drug Pregnancy Policies Sensitivity Analyses.
For sensitivity analyses examining Alcohol versus Alcohol + Drug Pregnancy Policies, findings were mostly similar across birth outcomes and prenatal care outcomes. For preterm birth and low birthweight, findings were consistent for White women for most models, and Black-White differences were consistent across all models that converged (the model estimating the effect of Child Abuse/Neglect policies on Low Birthweight did not converge for the Alcohol + Drug Policy Models). For prenatal care outcomes, findings were consistent for White women across all but one model that converged and were consistent for Black-White comparisons across all models.
4. Discussion
This study examined whether impacts of state-level alcohol/pregnancy policies in the U.S. vary by race using more than 40 years of data with more than 150 million births. This study found that impacts of alcohol/pregnancy policies do vary by race for preterm birth, vary in a few cases for low birthweight, and generally do not vary for prenatal care utilization.
The general hypothesis regarding the nature of differential effects with benefits concentrated among White women and harms concentrated among Black women, however, was not supported. Specifically, it appears all supportive policies had adverse impacts on either preterm birth, low birthweight, or both for White women, whereas some supportive policies (particularly Mandatory Warning Signs and Reporting Requirements for Data and Treatment Purposes) had positive impacts on preterm birth for Black women. It also appears that one punitive policy (Child Abuse/Neglect) had an adverse impact on preterm birth for White, but not Black, women, and the other two punitive policies (Civil Commitment and CPS reporting requirements) had positive impacts on preterm birth for Black, but not White, women. In short, to the extent there are differential impacts, harms appear more present for White women and benefits appear more present for Black women. More research is needed to understand the reasons for this differential impact. In particular, more research is needed to understand whether variation is due to differential exposure to alcohol/pregnancy policies or to differential experiences with alcohol/pregnancy policies to which women are exposed. In the meantime, regardless of health benefits of punitive policies observed for Black women in this study, other research has documented adverse community-level impacts of high levels of CPS involvement for Black women (Roberts, 2002) and that CPS reporting policies are barriers to prenatal care for women who use drugs and women of color (McLemore et al., 2018; Roberts and Pies, 2011). Also, even if there are health benefits to Civil Commitment or CPS Reporting policies, there are important ethics and justice questions that caution using the punitive power of the state to improve health of Black women and families.
One intriguing finding is that patterns differed for preterm birth and low-birthweight. While these are distinct health outcomes, they overlap in some cases. Future research should explore reasons why patterns differ for these outcomes.
Another important note is that supportive versus punitive may not be the only useful distinction when considering alcohol/pregnancy policies. Findings suggest classifying policies based on actual effects rather than on conceptual or political orientation might also be a relevant lens through which to view alcohol/pregnancy policies. Policy makers should consider both ethical dimensions of policies and evidence about effectiveness when making policy decisions.
There are a number of limitations. First, the main race variable does not include ethnicity, as ethnicity data were not consistently collected until 1989. While sensitivity analyses limited to data from 1989 and later had generally similar patterns, not all findings were the same. While these differences may be due, in many cases, to smaller sample sizes and not having policies in effect prior to data, differences may also be due to not distinguishing White-non-Hispanic and Black-non-Hispanic from Hispanic race/ethnicity. The fact that some findings, especially for Black-White differences in impacts of policies on preterm birth, were sensitive to race measurement and included years suggests more research is needed before policy makers should take action based on findings regarding benefits to Black women from both supportive and punitive alcohol/pregnancy policies. Second, the large sample size allows for detection of small effects. For birth outcomes, even small effects matter. It is unclear, however, how important small effects on prenatal care utilization are from a public health perspective. Third, with the exception of Mandatory Warning Signs policies, most studied policies address both alcohol and drugs (Thomas et al., 2018). Thus, this study cannot distinguish whether the policy focus on alcohol or on drugs during pregnancy matters for birth outcomes. More research using different study designs and analysis approaches is needed to distinguish whether policies targeting alcohol or targeting drugs matter. Fourth, findings related to alcohol outcomes should not be interpreted as causal, as we were unable to include state-specific time trends in those models. Sufficient questions exist regarding mechanisms of differential effects for birth outcomes and prenatal care that findings should not yet be interpreted as causal. We did, however, include state-specific time trends in birth outcomes and prenatal care models to address concerns with endogeneity. Also, endogeneity from policy makers’ knowledge of actual rates of alcohol use during pregnancy or fetal alcohol syndrome in their states is unlikely, as these data were not readily available, available in a timely manner (May and Gossage, 2001), or necessarily reliable as policies were being developed. Also, policy-making related to substance use and pregnancy appears driven by political concerns, such as positioning on abortion (Murphy and Rosenbaum, 1999; Paltrow, 1999) and factors such as number of female legislators in the state (Thomas et al., 2006).
4.1. Conclusion
Impacts of some alcohol/pregnancy policies on birth outcomes varies by race. Future research should explore why these policies, particularly Mandatory Warning Signs and Reporting Requirements for Data and Treatment Purposes, appear to have opposite effects on birth outcomes for White versus Black women.
Supplementary Material
Highlights.
Impacts of alcohol/pregnancy policies vary by race for adverse birth outcomes.
Impacts of alcohol/pregnancy policies generally do not vary for prenatal care.
Most policies had adverse impacts on birth outcomes for White women.
Some policies had health benefits for Black women; one had an adverse impact.
Acknowledgments
The authors thank Anna Bernstein, Beckie Kriz, RN, MSc, Nicole Nguyen, MPH, and Heather Lipkovich, MPH for project support.
Role of Funding Source
This work was supported by NIAAA R01 AA023267 and the University of California, San Francisco, California Preterm Birth Initiative, funded by Marc and Lynne Benioff. The sponsors had no involvement in study design; in the collection, analysis and interpretation of data; in the writing of the report; or in the decision to submit the article for publication. The content is solely the responsibility of the authors and does not necessarily represent the official views of the National Institutes of Health.
Footnotes
Publisher's Disclaimer: This is a PDF file of an unedited manuscript that has been accepted for publication. As a service to our customers we are providing this early version of the manuscript. The manuscript will undergo copyediting, typesetting, and review of the resulting proof before it is published in its final citable form. Please note that during the production process errors may be discovered which could affect the content, and all legal disclaimers that apply to the journal pertain.
Conflict of Interest
The authors have no conflicts of interest, financial or otherwise, to declare.
References
- Behrman RE, Stith Butler A (Eds.), 2007. Preterm birth: Causes, consequences, and prevention. Institute of Medicine, National Academies Press, Washington, D.C. [PubMed] [Google Scholar]
- Centers for Disease Control and Prevention, 2010. Birthweight and gestation. Centers for Disease Control and Prevention, Atlanta, GA. [Google Scholar]
- Centers for Disease Control and Prevention, HRSA, 2000. Healthy people 2010: Maternal, infant, and child health. Centers for Disease Control and Prevention, Atlanta, GA. [Google Scholar]
- Chasnoff IJ, Landress HJ, Barrett ME, 1990. The prevalence of illicit-drug or alcohol use during pregnancy and discrepancies in mandatory reporting in Pinellas County, Florida. N. Engl. J. Med 322, 1202–1206. [DOI] [PubMed] [Google Scholar]
- Cil G, 2017. Effects of posted point-of-sale warnings on alcohol consumption during pregnancy and on birth outcomes. J. Health Econ 53, 131–155. [DOI] [PubMed] [Google Scholar]
- Drabble LA, Thomas S, O’Connor L, Roberts SC, 2014. State responses to alcohol use and pregnancy: Findings from the Alcohol Policy Information System (APIS). J. Soc. Work Pract. Addict 14, 191–206. [DOI] [PMC free article] [PubMed] [Google Scholar]
- Hankin JR, Sloan JJ, Firestone IJ, Ager JW, Sokol RJ, Martier SS, 1993. A time series analysis of the impact of the alcohol warning label on antenatal drinking. Alcohol. Clin. Exp. Res 17, 284–289. [DOI] [PubMed] [Google Scholar]
- Jones KL, Smith DW, 1975. The fetal alcohol syndrome. Teratology 12, 1–10. [DOI] [PubMed] [Google Scholar]
- Kerr WC, Barnett SBL, 2017. Alcohol retailing systems: Private versus government control, in: Giesbrecht N, Bosma LM (Eds.), Preventing Alcohol-Related Problems: Evidence and Community-Based Initiatives. APHA Press, Washington, D.C. [Google Scholar]
- Kerr WC, Greenfield TK, Tujague J, 2006. Estimates of the mean alcohol concentration of the spirits, wine, and beer sold in the United States and per capita consumption: 1950 to 2002. Alcohol. Clin. Exp. Res 30, 1583–1591. [DOI] [PubMed] [Google Scholar]
- Kotelchuck M, 1994. An evaluation of the Kessner Adequacy of Prenatal Care Index and a proposed Adequacy of Prenatal Care Utilization Index. Am. J. Public Health 84, 1414–1420. [DOI] [PMC free article] [PubMed] [Google Scholar]
- Martin JA, 2011. Preterm births-- United States, 2007. MMWR Morb. Mortal. Wkly. Rep 60, 78–79. [PubMed] [Google Scholar]
- Martinez P, Kerr WC, Subbaraman MS, Roberts SCM, 2019. New estimates of the mean ethanol content of beer, wine, and spirits sold in the U.S. show a greater increase in per capita alcohol consumption than previous estimates. Alcohol. Clin. Exp. Res 43, 509–521. [DOI] [PMC free article] [PubMed] [Google Scholar]
- May PA, Gossage JP, 2001. Estimating the prevalence of fetal alcohol syndrome: A summary. Alcohol Res. Health 25, 159–167. [PMC free article] [PubMed] [Google Scholar]
- McLemore MR, Altman MR, Cooper N, Williams S, Rand L, Franck L, 2018. Health care experiences of pregnant, birthing and postnatal women of color at risk for preterm birth. Soc. Sci. Med 201, 127–135. [DOI] [PubMed] [Google Scholar]
- Murphy S, Rosenbaum M, 1999. Pregnant women on drugs: Combating stereotypes and stigma. Rutgers University Press, New Brunswick, N.J. [Google Scholar]
- National Institute on Alcohol Abuse and Alcoholism, 2016. Alcohol policy information system. National Institute on Alcohol Abuse and Alcoholism, Bethesda, MD. [Google Scholar]
- O’Leary CM, Bower C, 2012. Guidelines for pregnancy: What’s an acceptable risk, and how is the evidence (finally) shaping up? Drug Alcohol Rev. 31, 170–183. [DOI] [PubMed] [Google Scholar]
- O’Leary CM, Heuzenroeder L, Elliott EJ, Bower C, 2007. A review of policies on alcohol use during pregnancy in Australia and other English-speaking countries, 2006. Med. J. Aust 186, 466–471. [DOI] [PubMed] [Google Scholar]
- O’Leary CM, Nassar N, Kurinczuk JJ, Bower C, 2009. The effect of maternal alcohol consumption on fetal growth and preterm birth. BJOG 116, 390–400. [DOI] [PubMed] [Google Scholar]
- Paltrow LM, 1999. Punishment and prejudice: Judging drug-using pregnant women, in: Hanigsberg JE, Ruddick S (Eds.), Mother Troubles. Beacon Press, Boston: pp. 59–80. [Google Scholar]
- Patra J, Bakker R, Irving H, Jaddoe VW, Malini S, Rehm J, 2011. Dose-response relationship between alcohol consumption before and during pregnancy and the risks of low birthweight, preterm birth and small for gestational age (SGA)-- A systematic review and meta-analyses. BJOG 118, 1411–1421. [DOI] [PMC free article] [PubMed] [Google Scholar]
- Powers WF, Kiely JL, 1994. The risks confronting twins: A national perspective. Am. J. Obstet. Gynecol 170, 456–461. [DOI] [PubMed] [Google Scholar]
- Roberts DE, 2002. Shattered bonds: The color of child welfare. Basic Books, New York. [Google Scholar]
- Roberts S, Mericle A, Subbaraman M, Thomas S, Treffers R, Delucchi K, Kerr W, 2019. State policies targeting alcohol use during pregnancy and alcohol use among pregnant women 1985-2016. Womens Health Issues 29, 213–221. [DOI] [PMC free article] [PubMed] [Google Scholar]
- Roberts SC, Nuru-Jeter A, 2012. Universal screening for alcohol and drug use and racial disparities in child protective services reporting. J. Behav. Health Serv. Res 39, 3–16. [DOI] [PMC free article] [PubMed] [Google Scholar]
- Roberts SC, Zahnd E, Sufrin C, Armstrong MA, 2015. Does adopting a prenatal substance use protocol reduce racial disparities in CPS reporting related to maternal drug use? A California case study. J. Perinatol 35, 146–150. [DOI] [PubMed] [Google Scholar]
- Roberts SCM, Mericle AA, Subbaraman MS, Thomas S, Treffers RD, Delucchi KL, Kerr WC, 2018. Differential effects of pregnancy-specific alcohol policies on drinking among pregnant women by race/ethnicity. Health Equity 2, 356–365. [DOI] [PMC free article] [PubMed] [Google Scholar]
- Roberts SCM, Pies C, 2011. Complex calculations: How drug use during pregnancy becomes a barrier to prenatal care. Matern. Child Health J 15, 333–341. [DOI] [PMC free article] [PubMed] [Google Scholar]
- Roberts SCM, Thomas S, Treffers R, Drabble L, 2017. Forty years of state alcohol and pregnancy policies in the USA: Best practices for public health or efforts to restrict women’s reproductive rights? Alcohol Alcohol. 52, 715–721. [DOI] [PMC free article] [PubMed] [Google Scholar]
- Segal M, Palsgrove G, Sevy TD, Collins TE, 1983. The 1990 prevention objectives for alcohol and drug misuse: Progress report. Public Health Rep. 98, 426–435. [PMC free article] [PubMed] [Google Scholar]
- Sokol RJ, Delaney-Black V, Nordstrom B, 2003. Fetal alcohol spectrum disorder. JAMA 290, 2996–2999. [DOI] [PubMed] [Google Scholar]
- Strandberg-Larsen K, Nielsen NR, Gronbaek M, Andersen PK, Olsen J, Andersen AM, 2008. Binge drinking in pregnancy and risk of fetal death. Obstet. Gynecol 111, 602–609. [DOI] [PubMed] [Google Scholar]
- Subbaraman MS, Thomas S, Treffers R, Delucchi K, Kerr WC, Martinez P, Roberts SCM, 2018. Associations between state-level policies regarding alcohol use among pregnant women, adverse birth outcomes, and prenatal care utilization: Results from 1972 to 2013 vital statistics. Alcohol. Clin. Exp. Res 42, 1511–1517. [DOI] [PMC free article] [PubMed] [Google Scholar]
- Thomas S, Rickert L, Cannon C, 2006. The meaning, status, and future of reproductive autonomy: The case of alcohol use during pregnancy. UCLA Womens Law J. 15, 1–46. [Google Scholar]
- Thomas S, Treffers R, Berglas N, Drabble L, Roberts S, 2018. Drug use during pregnancy policies in the United States from 1970-2016. Contemp. Drug Probl 45, 441–459. [Google Scholar]
Associated Data
This section collects any data citations, data availability statements, or supplementary materials included in this article.