Summary
Both single and multicellular organisms depend on anti-stress mechanisms that enable them to deal with sudden changes in the environment, including exposure to heat and oxidants. Central to the stress response are dynamic changes in metabolism, such as the transition from the glycolysis to the pentose phosphate pathway- a conserved first-line response to oxidative insults1,2. Here we report a second metabolic adaptation that protects microbial cells in stress situations. The role of the yeast polyamine transporter Tpo13–5 in maintaining oxidant resistance is unknown6. However, a proteomic time-course experiment suggests a link to lysine metabolism. We reveal a connection between polyamine and lysine metabolism during stress situations, in the form of a promiscuous enzymatic reaction in which the first enzyme of the polyamine pathway, Spe1p, decarboxylates lysine and forms an alternative polyamine, cadaverine. The reaction proceeds in the presence of extracellular lysine, which is taken up by cells to reach concentrations up to one hundred times higher than those required for growth. Such extensive harvest is not observed for the other amino acids, is dependent on the polyamine pathway and triggers a reprogramming of redox metabolism. As a result, NADPH- which would otherwise be required for lysine biosynthesis- is channelled into glutathione metabolism, leading to a large increase in glutathione concentrations, lower levels of reactive oxygen species and increased oxidant tolerance. Our results show that nutrient uptake occurs not only to enable cell growth, but when the nutrient availability is favourable it also enables cells to reconfigure their metabolism to preventatively mount stress protection.
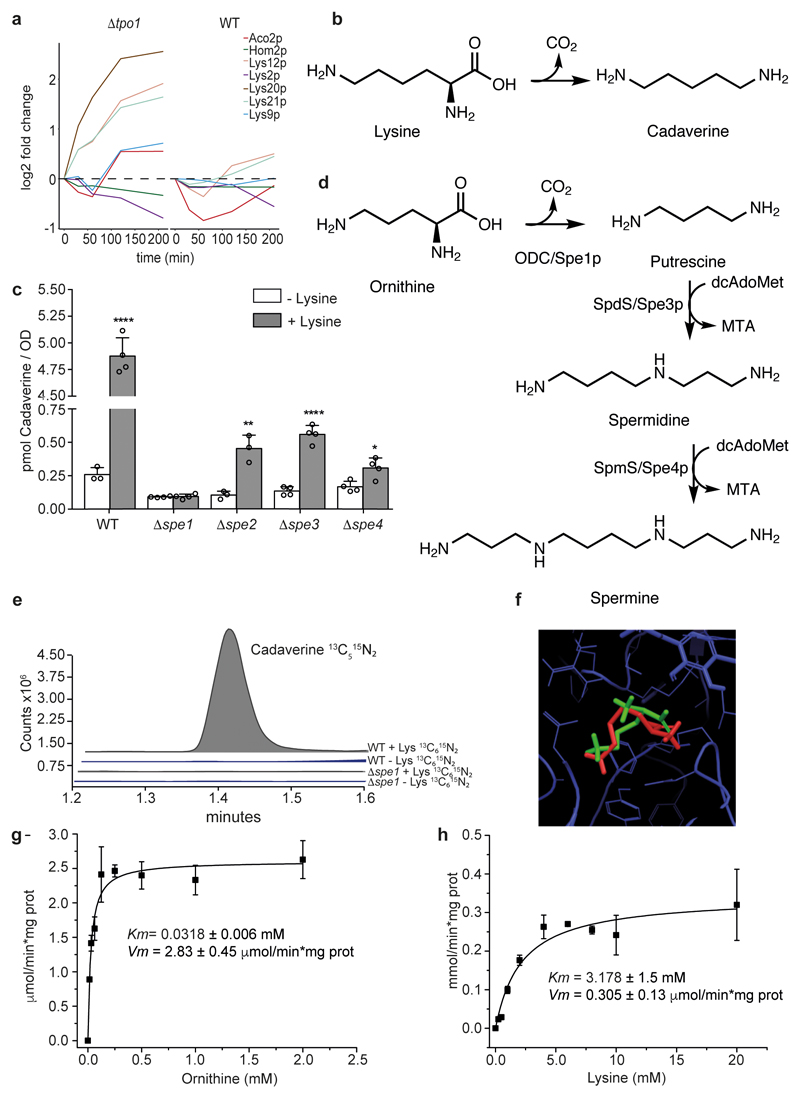
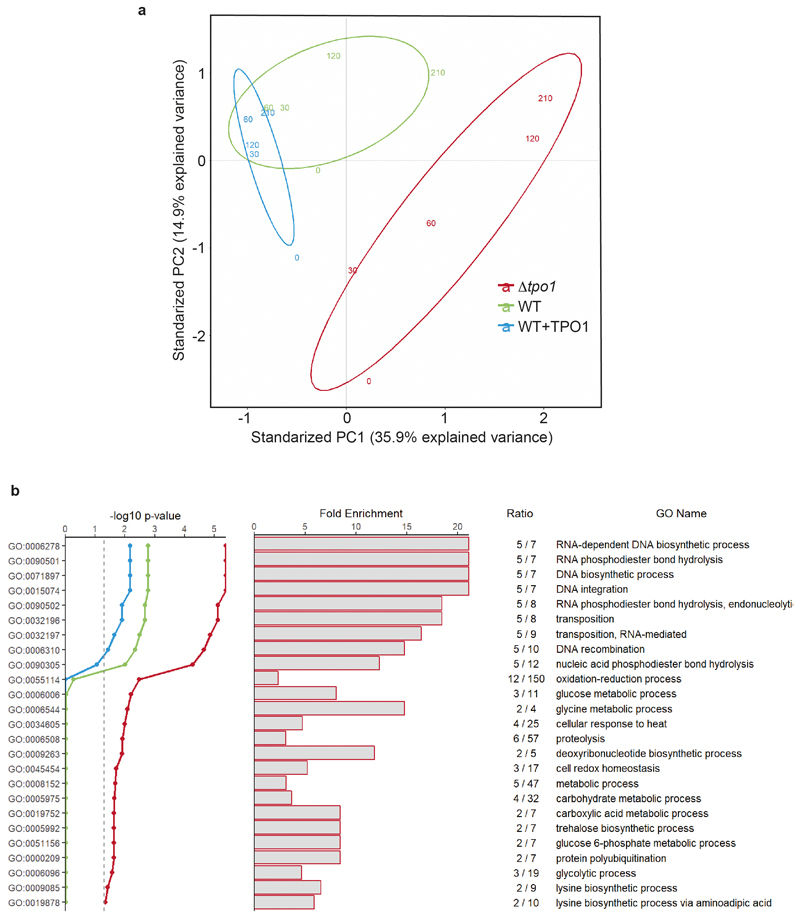
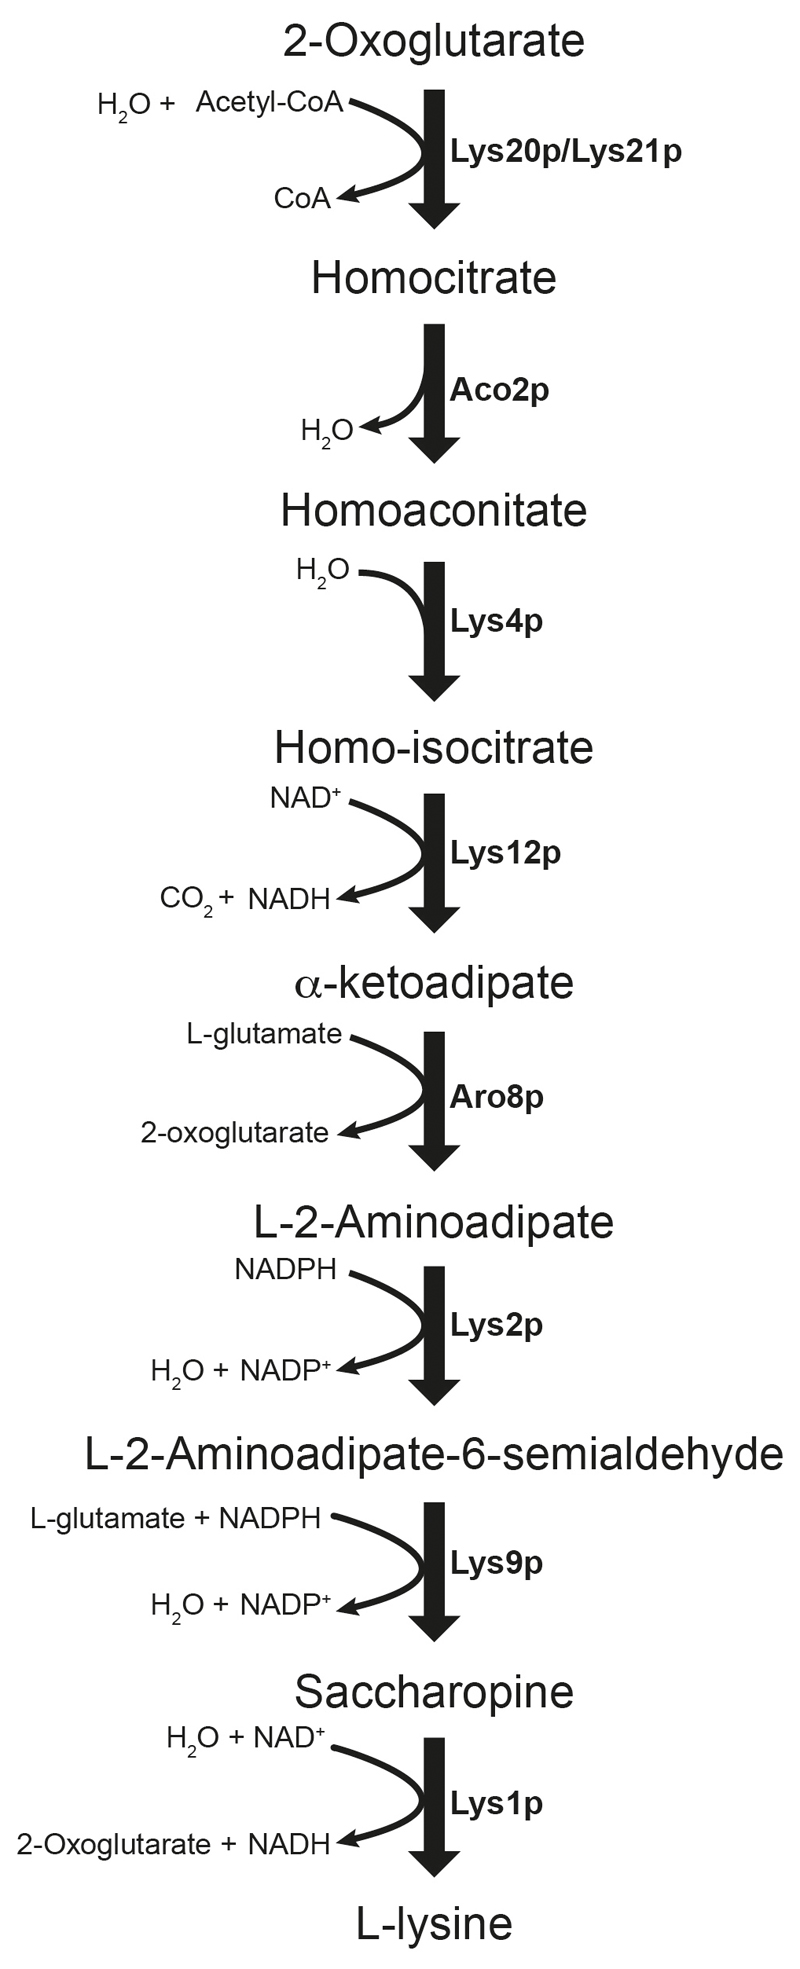
Tpo1p is a polyamine exporter that is found in Saccharomyces species 3–5 and is important for their tolerance to oxidants 6. We re-analysed a proteomic time-course experiment that was recorded with sequential window acquisition of all theoretical mass spectra (SWATH-MS)6 using a recent workflow7. Differentially expressed proteins were enriched for the following Gene Ontology terms: proliferation and cell cycle, nucleic acid biosynthesis, redox metabolism and stress response (Extended data Fig. 1). Moreover, several enzymes of the lysine biosynthetic pathway (Extended data Fig. 2), Lys20p, Lys21p, Aco2p, Lys9p and Lys12p- showed a faster and more pronounced response to H2O2 exposure upon deletion of the TPO1 gene (Δtpo1) (Fig. 1a). A potential link between the polyamine and the lysine biosynthetic pathways was provided by their chemistry: the decarboxylation of lysine forms cadaverine, a close structural analogue of putrescine, which is the canonical precursor for spermine and spermidine, substrates of Tpo1p3–5 (Fig. 1b). Notably, although lysine decarboxylation has been reported in bacteria and plants, Saccharomyces lacks an enzyme to carry out this transformation8–11. To address the possibility that a non-enzymatic or a promiscuous reaction could generate cadaverine, we quantified its intracellular levels. Trace amounts (0.26 ± 0.052 pmol per biomass unit (OD600nm)) were detected in minimal medium but increased 22-fold upon supplementation of a physiological amount (25 μg mL-1) of lysine (Fig. 1c).
Figure 1. A promiscuous reaction of Spe1p forms cadaverine from lysine in yeast.
a. Lysine biosynthetic enzymes are differentially induced upon exposure to 1.5 mM H2O2 and deletion of TPO1 (Δtpo1). Shown is a 210-min times series 6 recorded by SWATH-MS and re-processed with Spectronaut Pulsar X. Expression levels are shown as log2 (differentially expressed enzymes). b, The decarboxylation of lysine leads to the formation of cadaverine c, Cadaverine concentrations in overnight wild-type (WT) and Δspe1-Δspe4 yeast cultures with or without lysine (25 μg ml-1) supplementation. Mean ± s.d., n = 4 biologically independent samples except for wild-type non-supplemented and Δspe2 supplemented, for which n = 3. Unpaired two-tailed Student’s t-test versus the non-supplemented control: *P = 0.0163, **P = 0.0045, ****P ≤ 0.0001. d, Schematic illustration of the canonical yeast polyamine biosynthesis pathway. ODC, ornithine decasboxylase e, 13C5 15N2 cadaverine is formed from isotope-labelled lysine ([13C6 15N2] lysine) after a 1-h incubation of wild-type strains, but is not formed in Δspe1 cells. This experiment was repeated three times with similar results. f, Results of docking lysine (red) and ornithine (green) to the same site of Spe1p using Glide from Schrödinger suite (v. 2015-3) and a homology model. g, h, In vitro activity of Spe1p on metabolizing ornithine (g) and lysine (h) (mean ± s.d.; n = 3 independent experiments). The saturation curves were fitted to a Michaelis-Menten equation.
The search for the reaction responsible for the production of cadaverine was guided by the structural similarity of lysine and the putrescine precursor ornithine, and led us to test the enzyme ornithine decarboxylase (Spe1p) (Fig. 1d). Deletion of the gene that encodes this enzyme (Δspe1) did not deplete trace amounts of cadaverine, but did eliminate any increase upon lysine supplementation (Fig. 1c). We then conducted an isotope tracer experiment, which involved feeding cells with [13C6 15N2]lysine. Wild-type cells formed large amounts of [13C5 15N2]cadaverine; however, in Δspe1 cells, none of the tracer was converted into cadaverine (Fig. 1e). Experiments at the pathway level substantiated the role of Spe1p. First, the concentration of cadaverine was found to be lower in Δspe2, Δspe3 and Δspe4 strains, in which Spe1p is feedback-inhibited as a consequence of the polyamine supplementation necessary to grow these strains 12 (Fig. 1c). Conversely, exposure to lysine increased the levels of putrescine in these strains, which indicates inhibition of the downstream pathway (Extended data Fig. 3a).
We then obtained a 3D structure of Spe1p (UniProt ID: P08432 13) by homology modelling, using Leishmania donovani (PDB ID: 2OO014) ornithine decarboxylase as a template. Molecular docking suggested that both ornithine and lysine can bind to the catalytic site (Fig. 1f). Both compounds are stabilised by hydrogen bonding between the amino group in the ligand and Asp363 and Tyr354, along with a structural water molecule. However, although lysine fits in the binding site, it needs to overcome steric hindrance in order to share the catalytic site with pyridoxal phosphate. This indicates that Spe1p should have a much lower affinity for lysine than for ornithine. To test this prediction, we cloned, expressed and purified Spe1p, and analysed its catalytic properties (Table 1). Spe1p was found to decarboxylate both ornithine and lysine (Fig. 1g, h), although its affinity for ornithine and the catalytic efficiency were much higher than for lysine. Indeed, the Michaelis-Menten constant (Km) for lysine decarboxylation was only in the millimolar range (Fig. 1h, Table 1). However, Spe1p produced considerable amounts of cadaverine in vivo (Fig. 1 c, e), and so we concluded that lysine must have been present at very high concentrations.
Table 1. Kinetic parameters of ornithine decarboxylase Spe1p.
| Substrate | Km (mM) |
Vm/Km
(ml min-1 mg-1) |
Concentration (mM) SM |
Concentration (mM) SM+lysine |
|---|---|---|---|---|
| Ornithine | 0.0318 ± 0.006 | 88.9 | 2.04 ± 0.18 (wild type) 1.6 ± 0.25 (Δtpo1) |
2.2 ± 0.12 (wild type) 2.2 ± 0.095 (Δtpo1) |
| Lysine | 3.178 ± 1.5 | 0.095 | 3.02 ± 1.12 (wild type) 2.45 ± 0.23 (Δtpo1) |
215.2 ± 100.5 (wild type) 104.2 ± 29.8 (Δtpo1) |
The kinetic parameters and the concentrations of amino acids represent the mean ± sd, n = 3 independent experiments and biological samples, respectively. SM, synthetic minimal medium; Vmax, maximum rate of reaction.
We continued to ask whether- and if so, under what conditions- high lysine concentrations can emerge in vivo. The lysine biosynthetic capacity is sufficient for cell growth, and supplementing lysine did not accelerate yeast growth (Extended data Fig. 3b). Under exponential growth in minimal medium, we measured lysine concentrations of 4.93 ± 1.82 nmol per OD600nm. Assuming a cell volume of 45.54 fl and a concentration of 3.2 x 10⁷ cells per OD600nm 15, this corresponds to average concentrations of 3.01 ± 1.12 mM and classes lysine as a highly concentrated metabolite16. However, this concentration would be insufficient to explain cadaverine formation given the catalytic properties determined for Spe1p (Table 1). We then noted that the main lysine transporter, Lyp1p, was reported to have low affinity for intracellular lysine, leading to unidirectional import 17. Upon supplementation of 25 μg mL-1 lysine we observed a 71.2-fold increase in intracellular lysine levels to 322.75 nmol per OD600nm. Corresponding to an approximated average lysine concentration of 215.2 mM, such levels fully suffice to explain cadaverine formation from Spe1p. As such high concentrations (Fig. 2a, Table 1) are, however, not required for growth, we refer to this phenomenon as ‘lysine harvesting’. When TPO1 was deleted, the harvesting was less effective. Upon supplementation of the Δtpo1 strain with 25 μg mL-1 lysine we observed a 42.5-fold increase in intracellular lysine concentration, which is less than half the increase seen with the wild-type strain (71.2-fold) (Fig. 2a).
Figure 2. Lysine harvest in Saccharomyces cerevisiae.
a, Lysine concentrations in wild-type and Δtpo1 yeast grown in synthetic media supplemented with or without lysine (25 μg ml-1). The cells were grown until the mid-log phase and analysed by liquid chromatography coupled with tandem mass spectrometry (LC-MS/MS) (mean ± s.d.; n = 4 biologically independent samples except for Δtpo1, for which n = 3). Unpaired two-tailed Student’s t-test versus the non-supplemented control: **P = 0.0056 for wild-type and P = 0.0022 for Δtpo1. b, Harvesting to reach extreme concentrations is specific for lysine. Amino acid concentrations in wild-type yeast grown in synthetical minimal (SM) media supplemented with individual amino acids (left) or rich media (yeast extract; right) plotted as fold change compared to the average profile of seven replicates in unsupplemented synthetic media (mean ± s.d., n = 4 biologically independent samples). c, Quantification of extracellular lysine during the growth of prototrophic (LYS2) and auxotrophic (Δlys2) yeast in SM media supplemented with lysine (SM+Lys) or synthetic complete media (SC). Cultures were initiated with an OD600nm of 0.125 and grown for 30 h. Samples were taken every 3 h, collected and the supernatant was used for quantification. Mean ± s.d.; n = 4 biologically independent samples.
Yeast cells take up a range of amino acids 18, and we next tested whether they are harvested to a similar extent. Regardless of whether amino acids were supplemented individually or as a complex mixture (yeast extract), only lysine concentrations increased to such marked levels (Fig. 2b).
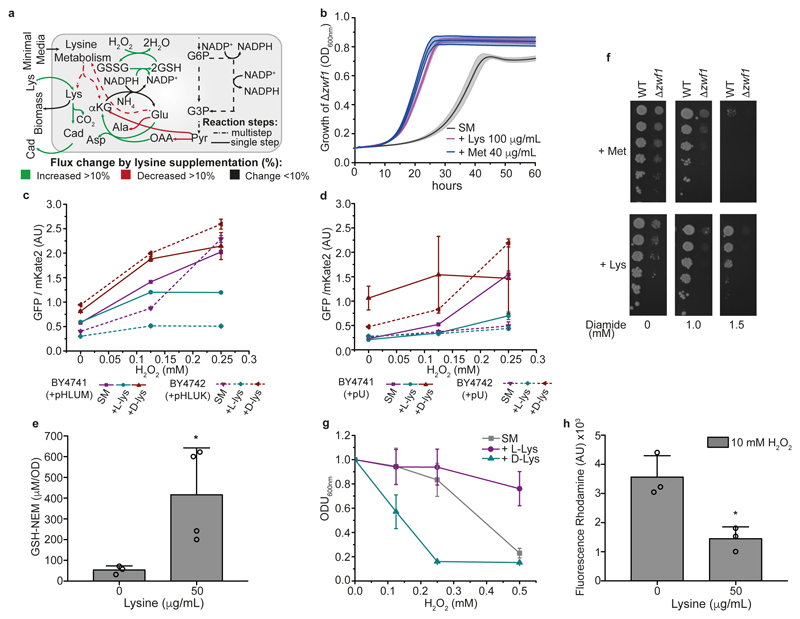
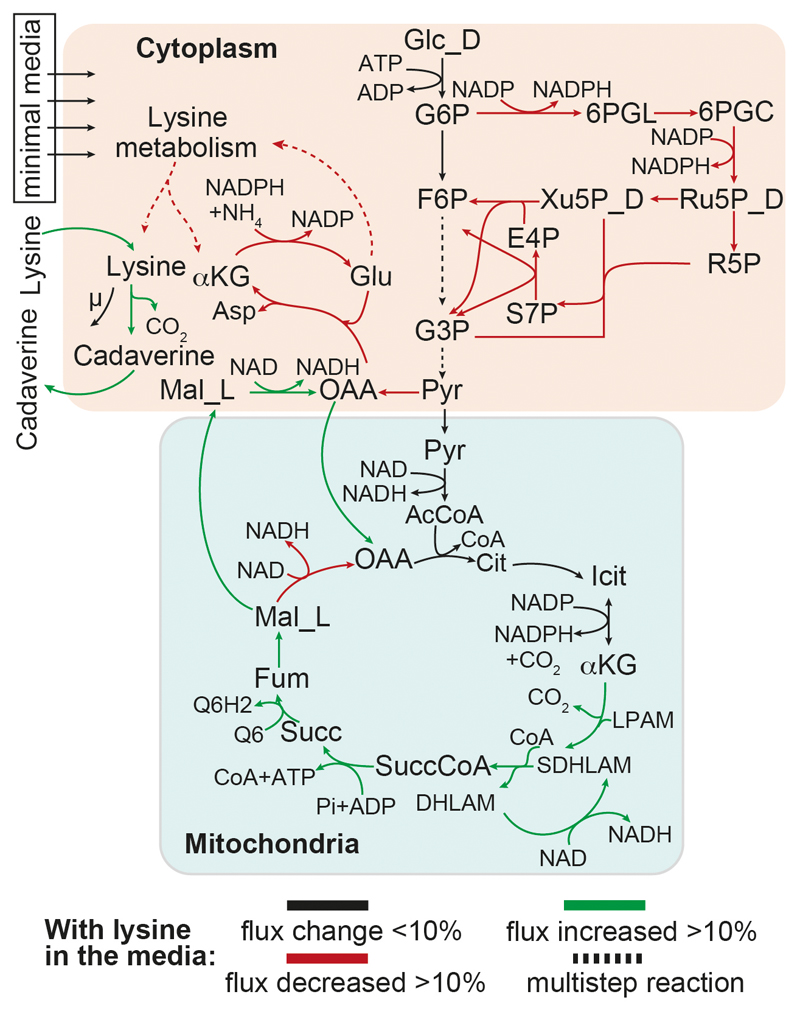
The lysine biosynthetic pathway is prone to feedback inhibition 19–21. Indeed, we found that prototrophs consumed lysine at the same rate as auxotrophs (Fig. 2c), indicating that harvesters fully switch from self-synthesis to consumption. To determine the metabolic changes induced, we expanded a yeast metabolic network reconstruction 22 to include the new reactions discovered and performed flux balance analysis (FBA) (Fig. 3a). FBA predicted major changes within NADPH-forming reactions- reflecting the fact that when cells harvest lysine, less NADPH is required for growth (Extended data Fig. 4). The growth-optimized model consequently predicted that there would be a reduced flux to NADPH-producing pathways, including the pentose phosphate pathway (PPP) 23 (Extended data Fig. 4). However, a second biological possibility was that- rather than diminishing the production od NADPH- cells could instead channel NADPH into other metabolic processes. We used phenotypic assays to test which of the two scenarios applied in this case. Cells that lacked glucose 6-phosphate dehydrogenase (Δzwf1) are auxotrophic for methionine, as the high demand for NADPH in methionine biosynthesis cannot be met 24,25. Lysine harvesting complemented the auxotrophy, indicating that there was a greater availability of NADPH in lysine harvesters (Fig. 3b). Next, we used an oxidant-dependent sensor assay26 to measure the NADPH-mediated reducing power upon exposure to H2O2. We found that lysine harvesters increased the redox potential of NADPH (Fig. 3c, d).
Figure 3. Lysine harvesting increases the tolerance of yeast to oxidants by replenishing NADPH and increasing glutathione levels.
a, Lysine harvesting replenishes the pools of NADPH and reduced glutathione (GSH). The scheme shows the flux balance analysis upon maximizing the glutathione oxidoreductase reaction b, Lysine harvesting complements the methionine auxotrophy of Δzwf1 cells. Cells were grown with or without lysine (100 μg ml-1) or methionine (40 μg ml-1) (mean ± s.d.; n = 4 biologically independent samples). c, d, The availability of NADPH increases in lysine harvesters. The redox state of NADPH/NADP+ was assessed by a fluorescence biosensor assay26, using the fluorescent proteins GFP and mKate2, in plasmid-complemented prototrophs (c) and auxotrophs (d) supplemented with histidine, leucine and methionine. Mean ± s.d.; n = 4 independent experiments. e, GSH concentrations, measured as a conjugate with N-ethylmaleimide (GSH-NEM) to prevent oxidation, increase in lysine harvesters. Mean ± s.d. (n = 3 biologically independent samples for wild type and n = 4 for lysine-supplemented wild-type). Unpaired two-tailed Student’s t-test *P = 0.0426. f, Spot test assessing the diamide resistance (0-1.5 mM) of wild-type and Δzwf1 cells supplemented with methionine (40 μg ml-1) or lysine (50 μg ml-1) (n=3) g, L-Lysine harvesting increases tolerance to H2O2, but exposure to D-lysine has adverse effects. Cells were pre-cultured in the presence of L-lysine and D-lysine and exposed to H2O2 for 16 h. The tolerance to H2O2 stress was assayed by density (OD600nm). Mean ± s.d.; n = 4 independent experiments. h, Quantification of reactive oxygen species (as assessed by dihydrorhodamine staining) in wild-type cells and lysine harvesters (50 μg ml-1) incubated with 10 mM H2O2 for 1 h (mean ± s.d.; n = 3 independent experiments). Unpaired two-tailed Student’s t-test *P = 0.0123.
Increased NADPH levels stimulate glutathione biosynthesis by increasing the activity of γ-glutamylcysteine ligase 27. We therefore constrained the FBA model in the second iteration, optimising the NADPH consuming glutathione oxidoreductase reaction. This FBA agreed with our experimental results, which suggested that, during harvesting, excessive lysine would be channelled towards polyamine metabolism. The model also predicted that flux through the glutathione oxidoreductase would increase sevenfold (Fig. 3a). We therefore quantified glutathione, and found that lysine harvesting promoted a 7.85-fold increase in its concentration (Fig. 3e).
To assess the resistance of the yeast cells to oxidants, we first applied diamide, a thiol oxidant to which resistance is known to increase with NADPH availability 28–30. Lysine harvesting increased resistance to diamide (Fig. 3f). We compared this treatment to methionine supplementation, which is also reported to increase tolerance to diamide 30. Lysine harvesting provided a higher degree of resistance to diamide that did methionine supplementation (Fig. 3f). Furthermore, we tested Δzwf1 cells, in which less NADPH is available for antioxidant enzymes. Consistently, we found that, although lysine harvesting restored prototrophy, the stress tolerance of these cells did not reach wild-type levels (Fig. 3f). In parallel, lysine harvesting substantially increased resistance to H2O2 (Fig. 3g). Furthermore, lysine harvesters maintained much lower levels of reactive oxygen species in the presence of 10 mM H2O2 (Fig. 3h).
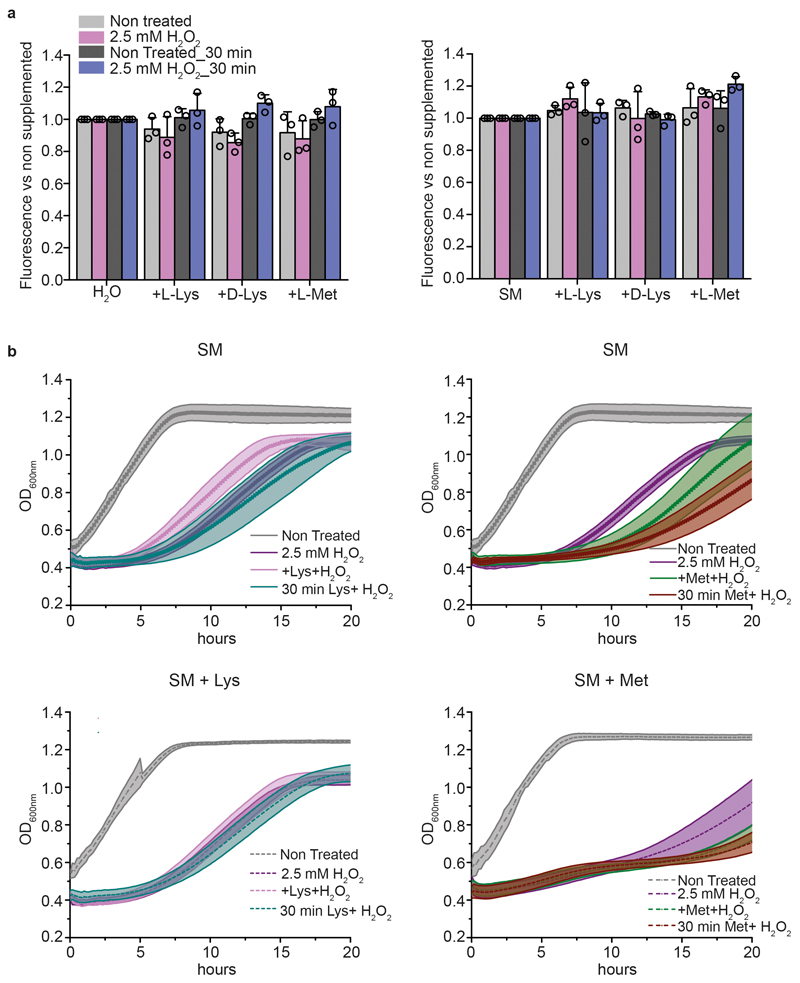
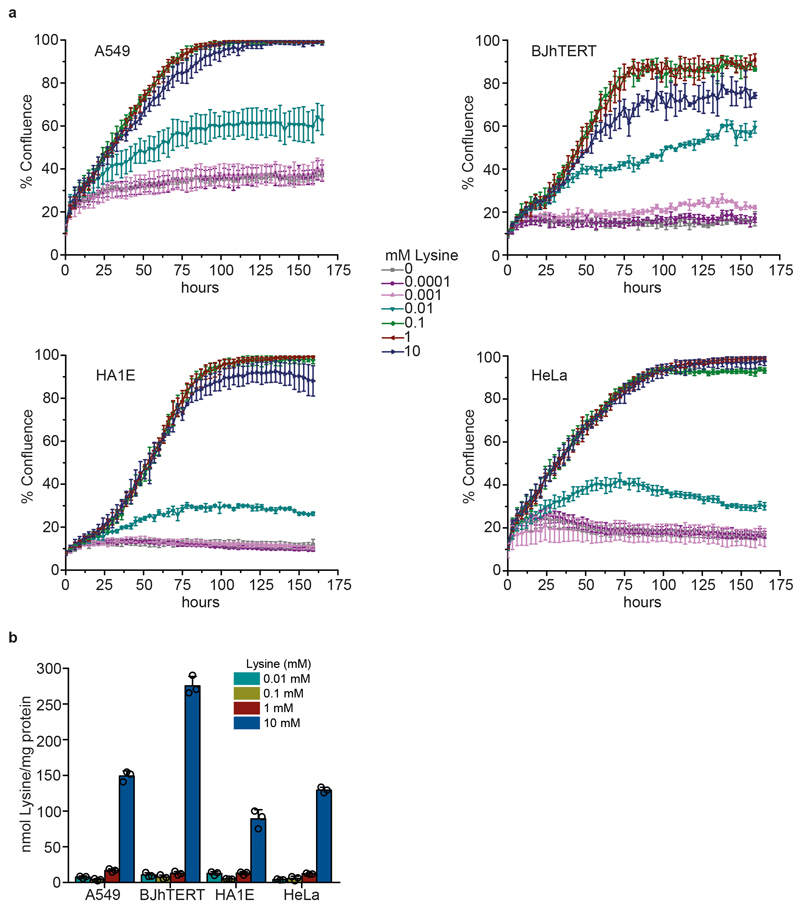
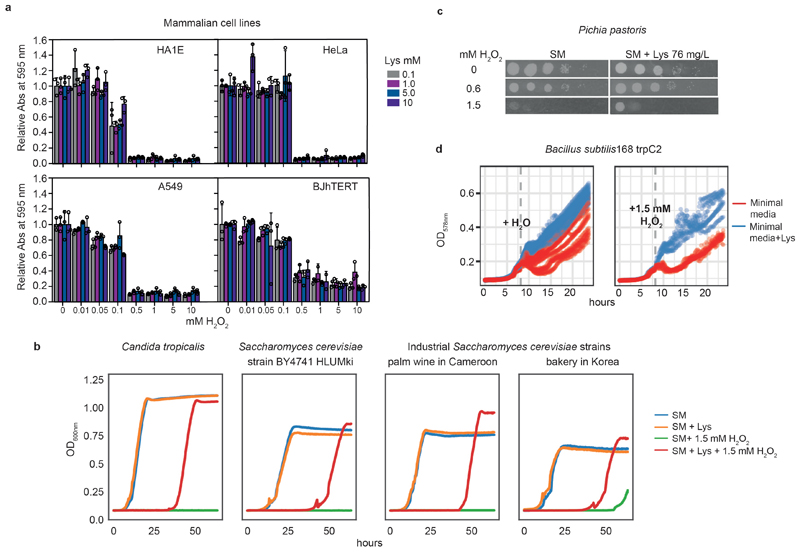
Control experiments confirmed that the metabolic reconfiguration, and not a direct antioxidant action of lysine, explained the protection against stress. First, when instead of L-lysine we supplied D-lysine- which has identical redox properties- cells became oxidant- sensitive (Fig. 3g). Furthermore, pre-incubation of H2O2 with lysine did not mitigate the cellular response (Extended data Fig. 5). Additionally, we studied a panel of mammalian cell lines (HA1E, HeLa, A549 and BJhTERT). We confirmed that these cells also take up lysine (Extended data Fig. 6); however, because they are native lysine auxotrophs, they cannot benefit from the re-channelling of NADPH flux and were not stress protected (Extended data Fig. 7a). We next tested whether lysine harvesting protects other prototrophs. Separated by billions of years of evolution, yeast strains isolated from palm wine in Cameroon and from a bakery in Korea, respectively (OS473 and OS265) 31, Pichia pastoris and Candida tropicalis (Extended data Fig. 7b, c), as well as Bacillus subtilis (Extended data Fig. 7d), all gained oxidant resistance. This demonstrates the conservation of this antioxidant strategy across several major clades of life.
In conclusion we have shown that lysine is harvested by cells in large quantities, rendering them resistant to oxidants. On the molecular level, the harvest has at least two consequences. First, a promiscuous reaction of ornithine decarboxylase reaches relevant rates and forms an underground polyamine metabolite, cadaverine. We could not confirm a chemical antioxidant role for cadaverine in mediating stress protection (Supplementary Notes 1 and 2, Extended Data Figs. 8, 9, Extended Data Table 1). However, the polyamine pathway is implicated in the regulation of expression of lysine biosynthetic enzymes and is required to import the concentrations of lysine that are found in wild-type cells. Future studies will be required to investigate how the changes in polyamine levels lead to the observed changes in enzyme expression and lysine concentration. We speculate that these could be a direct consequence of the role of polyamines in transcription and translation 32. Second, the lysine harvest results in a metabolic reconfiguration that channels more NADPH into glutathione metabolism, reducing levels of reactive oxygen species and increasing tolerance to stress. Therefore, lysine harvesting adds to the series of mechanisms that stimulate NADPH production to prevent imbalances in the redox state under oxidative conditions 1,2,33. However, to our knowledge, none of the previously reported mechanisms act to preventatively induce an approximately eightfold increase in the pool of reduced glutathione- already one of the most concentrated cellular metabolites. Quantitatively speaking, lysine harvesting may be one of the most powerful preventative metabolic antioxidant strategies available to microbial cells. Cells sense and take up metabolites not only to enable cell growth, but also- when the metabolic environment is favourable- to preventatively reconfigure their metabolism to become more robust.
Methods
Yeast cultivation and growth analyses
Haploid wild-type (WT), Δspe1, Δspe2, Δspe3, Δspe4 strains of the S288c background (BY4741 and BY4742 derivatives 34) transformed with the plasmid pHLUM (to repair auxotrophic markers 35) were grown in synthetic minimal (SM) media (6.8 g l-1 yeast nitrogen base (Sigma-Aldrich)), supplemented with 2% glucose as carbon source. In Δzwf1 and Δtpo1 strains of the MATa yeast knockout collection we detected secondary mutations and recreated the strains by using homologous recombination 30,36,37. The Δspe1-Δspe4 strains are auxotrophic for spermidine and were hence were grown in the presence of 0.1 mM spermidine and with or without 25 μg ml-1 lysine as indicated. Wild-type and Δtpo1 cells were grown in SM media with or without 25 μg ml-1 lysine, as indicated. Δzwf1 was grown in SM supplemented with 40 μg ml-1 methionine or 100 μg ml-1 lysine. The MATɑ wild-type strain of the S288c background BY4742 transformed with the plasmids pHLU or pHLUK, to repair auxotrophic markers 35, were grown in SM or synthetic complete (SC) media (0.56 g l-1 complete supplement mixture (MP Biomedicals) and 6.8 g l-1 yeast nitrogen base (Sigma-Aldrich)) supplemented with 2% glucose, with or without lysine. To complement the polyamine auxotrophy of Δspe1 cells, the cells were pre-grown in SM media supplemented with 2 μM of spermidine. Subsequently, they were diluted to OD600nm = 0.2 in SM media supplemented or not with 0.1 mM spermidine and/or 250 mM cadaverine.
For measuring growth rates, wild-type and Δzwf1 cells were transferred from cryostock to solid SM media supplemented with 40 μg ml-1 methionine or 100 μg ml-1 lysine. Then 2 mL pre-cultures were grown in SM, SM + Met (colonies from SM + Met solid media) and SM + lysine (colonies from SM + lysine solid media), overnight at 30°C. The cultures were diluted to OD600nm = 0.2 and incubated at 30°C. The growth was monitored in a multimode detector (Tecan Infinite 200 Pro) and OD600nm was recorded until the cultures reached a stationary phase. Data were analysed with the “grofit” R package 38 and illustrated using Origin Pro 9.0.
To determine the effect of lysine supplementation on yeast growth, pre-cultures of the wild-type (BY4741) were grown overnight in SM media with or without lysine (25 μg ml-1) supplementation, diluted to an OD600nm= 0.2-0.3 and incubated at 30°C. The growth was monitored in a multimode detector (Tecan Infinite 200 Pro) and recorded until the cultures reached the stationary phase. Data were analysed with the “grofit” R package and illustrated using Origin Pro 9.0.
To determine the effect of the presence of Escherichia coli lysine decarboxylase (LdcC) on growth, overnight pre-cultures from prototrophic yeast were transformed with the plasmid pYX212 or with pYX212 to express the gene encoding E. coli lysine decarboxylase (LdcC) grown in SM medium, and were diluted to an OD600nm = 0.2 in SM media supplemented or not with 250 μg ml-1 lysine and incubated at 30°C until the cultures reached the stationary phase.
Gene amplification and cloning
Genomic DNA from S. cerevisiae was isolated, and the SPE1 coding sequence was amplified by PCR using primers CGTACCATGGATGTCTAGTACTCAAGTAGG (sense) and CATCCTCGAGATCGAGTTCAGAGTCTATG (antisense) to introduce a NcoI and XhoI restriction site, respectively. The PCR product was cloned into the pGEM-T Easy vector (Promega) and E. coli DH5α was transformed with the plasmid. Plasmids were verified by sequencing. Then, the SPE1 coding sequence was subcloned into the NcoI and XhoI sites of the pET20 plasmid (Novagen) in order to express a His-tagged protein.
For the amplification and cloning of E. coli LdcC, the coding sequence was amplified from genomic DNA using the primers AAAACACATACAGGAATTCACCATGGATCCTAGGGCCCACATGAACATCATTGCCATTAT and CGTAGTCAGGCACATCATACGGATACCCGGGTCGACGCGTTTATCCCGCCATTTTTAGGA. The vector pYX212 (Ingenius, R&D systems) was linearized with HindIII. Both PCR products and linearized vector were transformed into yeast for homologous recombination. The construct was verified by sequencing.
Recombinant protein expression and purification
E. coli BL21 was transformed with the plasmid for expression of S. cerevisiae 6xHIS-Spe1p. A 5 mL pre-culture was grown in Luria Bertani medium with 100 μg ml-1 ampicillin overnight at 37°C. The next day, 10 ml of medium was inoculated with the overnight culture, cells were grown until an OD600nm= 0.6 and protein expression was induced with 1 mM isopropyl-β-D-thiogalactoside, upon which the cells were grown for 4 h at 20°C. The cells were collected and frozen at -80°C. Then the frozen pellet was resuspended in 200 mL of lysis buffer (Tris-Cl 50 mM pH 7.4, 300 mM NaCl, 10 mM imidazole, 1 mM DTT, 1 tablet of EDTA-free protease inhibitors). The cells were lysed in a cell disruptor (CF Range, Constant Systems) by passing the cell suspension three times at 30,000 psi. The lysate was then ultracentrifuged at 185,511g at 4°C for 30 min. Spe1p was purified by IMAC on a HisTrap (Nickel) column (5 mL; GE Healthcare). The fractions with the peak of the protein of interest were combined and concentrated by centrifugation (2939g, 5°C) through an Amicon Ultra-15 (molecular cut-off 30 kDa, Millipore). The concentrated protein (500 μL) was injected to a Superdex S200 gel filtration column (10 x 300 mm; GE Healthcare) equilibrated with a buffer containing Tris-Cl 50 mM pH 7.4, NaCl 300 mM, 1 mM DTT and EDTA-free protease inhibitor tablets (1 tablet per 100 mL). The fractions with the purest Spe1p were identified by SDS-PAGE, combined and concentrated as mentioned above. 10% glycerol was added for preservation and the protein was stored at -80°C.
Proteomics data analysis
The SWATH-MS data were previously reported 6, and are available via ProteomeXchange with identifier PXD013373. Raw data were analysed using Spectronaut Pulsar X software (Biognosys) with a spectral library generated previously (ProteomeXchange ID PXD013373). Protein quantities were calculated from all precursor intensities, and protein inference was performed using a protein database obtained from SGD (2018-08-28). Gene Ontology (GO) enrichment was performed with the Spectronaut software using a gene annotation file obtained from SGD (2019-01-01). Data were analysed in R, with function “prcomp” for principal component analysis.
Metabolite quantification
Amino acids
For measuring lysine levels, the yeast cells were pre-cultured overnight in 50 mL of SM media with or without lysine (25 μg ml-1) supplementation, and main cultures were initiated by diluting to OD600nm = 0.2-0.3 in 100 mL of SM media with or without lysine (25 μg ml-1) supplementation. Cultures were grown until the mid-log phase (OD600nm approximately 1.0), samples for amino acid profiling (1 ODU600nm) were collected and the pellet was frozen in dry ice. The samples were stored at -80°C.
For the profiling experiments, the strain BY4741 with auxotrophic loci repaired (HLUM knock-in) was pre-grown on YPD agar medium. Four colonies were picked and grown in 10 ml overnight SM pre-cultures. In a 96-deep-well plate, 1.4 ml cultures with a starting OD600nm of 0.2, unsupplemented or supplemented with individual proteinogenic amino acids (except cysteine, which inhibits growth, and tyrosine, which is of low solubility) at a concentration of 0.334 mM or yeast extract (2%), were grown at 30°C for 6h with shaking.
The amino acid extraction, separation and detection protocols were adapted from a previous study15. 80% ethanol (100 μl) at 80°C was added to the frozen yeast pellet (1 ODU600nm) from a mid-log phase culture, and the sample was incubated at 80°C for 2 min. Then, the sample was vortexed. The last two steps were repeated twice. The samples were centrifuged at 12,000g for 5 min. The supernatants were collected and 1 μL was injected onto an analytical column (Waters ACQUITY UPLC BEH amide 1.7mm 2.1x100 mm) at 25°C. Buffer A consisted of 50:50 acetonitrile/water, 10 mM ammonium formate, 0.176% formic acid and buffer B was composed of 95:5:5 acetonitrile/methanol/water, 10 mM ammonium formate and 0.176% formic acid. The separation was performed at 0.9 mL/min isocratic flow with a gradient consisting of the following steps: 0.7 min 85% Buffer B followed by a 1.85 min ramping to 5% B, and keeping constant for 0.05 min before returning to the equilibrating conditions of 85% B. The total running time was 3.25 min. The quantification was carried out using a triple quadrupole mass spectrometer (Agilent 6460).
Polyamines
For the dansylation derivatization method, polyamines were quantified upon a derivatization with dansyl chloride (dansylation), following a protocol adapted from previous work39. Glass beads (200 mg) were added to the frozen cell pellets and were resuspended in 500 μL of 0.2 M HClO4. Then, the cells were lysed in a homogenizer (FastPrep-24 5G MP Biomedicals) using 2 cycles of 20 s, 6.5 m s-1 at 4°C. The cell debris was removed by centrifugation at 12,000g for 10 minutes at 4 °C and 100 μl were neutralized with 3M sodium carbonate (10 μl). Then, 200 μl of 1,3-diaminopropane was added as an internal standard. The polyamines were dansylated by adding 400 μl of dansyl chloride in acetone (27 mM) to 100 μL of the sample and incubated at 60°C for 20 min in the dark. Then, 120 μl of a 0.8 M proline solution was added to the sample, vortexed and incubated at 25°C for 30 min in the dark. Then, an extraction with 500 μL of toluene was performed. The organic phase was taken and the solvent was removed under a N2 stream. Then, pellets were resuspended in 100 μl acetonitrile. One microlitre of the polyamines sample was separated using chromatography (Zorbax Eclipse Plus C18, RRHD, 2.1 x 50 mm, 1.8 μm) at 20°C. Buffer A consisted of 0.1% formic acid in water, and buffer B was acetonitrile. The separation gradient consisted of an isocratic flow (0.5 mL min-1) for 0.4 min of 60% B, followed by a ramp of 3.1 min to 100% B, then washing 0.3 min with 100% B, then returning to starting conditions (60% B) in 0.01 min with 1.19 min for re-equilibration, resulting in a 5-min cycle time. The quantification was carried out using a triple quadrupole mass spectrometer (Agilent 6460).
In the non-derivatised method, for enzyme assays, 1 μl of the supernatant obtained from the kinetic assay was injected onto an analytical column (ACQUITY UPLC BEH amide 1.7 mm 2.1 x 100 mm), and putrescine and cadaverine were separated by HPLC. Buffer A consisted of 2:98 acetonitrile:water, 0.176% formic acid and buffer B was composed of 95:5 acetonitrile:water, 0.176% formic acid. The separation gradient consisted of a 0.5 mL min-1 isocratic flow with the following steps: 0.25 min 100% Buffer B followed by a 0.25 min ramping to 72% B and keeping constant for 0.5 min. Then, a 1.5 min ramp to 30% B was done and kept constant for 0.5 min. This was followed by a 1.5-min ramp to 30%B, which was kept constant for 0.5 min. Next there was a third 0.15 min ramp to 20% B which was kept constant for 0.45 min before returning to the equilibrating conditions (100% B). The total running time was 5 min. The quantification was carried out using a triple quadrupole mass spectrometer (Agilent 6460).
GSH
For GSH determination, 5 OD600nm of mid-log phase wild-type cell cultures were collected and quenched in one volume of 4 mM N-ethylmaleimide (NEM) in methanol previously cooled in dry ice 40. The pellet was resuspended in 200 μl of a buffer composed of 75:25 (v/v) acetonitrile:methanol, 0.2% formic acid and lysed in a homogenizer (FastPrep-24 5G MP Biomedicals) using three cycles for 20 s at 6.5 m s-1. Then, the sample was centrifuged for 5 min at 16,000g. The pellet was extracted again with 200 μl of UHPLC water and both supernatants were combined and evaporated in a concentrator plus speedvac (Eppendorf), resuspended in 100 μl of 7% acetonitrile and centrifuged. A 1 μl of the sample was injected onto a C8 column (ZORBAX SB-C8 Rapid Resolution HD, 2.1 x 100 mm, 1.8 μm (Agilent)) at 20°C. Buffer A was composed of 10% acetonitrile and buffer B of 50% acetonitrile (v/v). Both buffers contained 750 mg l-1 octylammonium acetate as ion-pairing reagent. The gradient consisted of 3.5 min of isocratic flow at 12% acetonitrile, followed by a 2.5-min gradient to 38% acetonitrile and a 0.5-min washing step to 42% acetonitrile and 1 min of re-equilibration to starting conditions with a total cycle time of 7.5 min. The quantification was carried out using a triple quadrupole mass spectrometer (Agilent 6470).
Nutrient uptake rates
Nutrient uptake rates were determined as described previously37. S. cerevisiae (BY4742) was transformed with the pHLU and pHLUK 35 to compensate for auxotrophies including or excluding lysine, and were streaked on SM agar media with or without lysine supplementation, respectively. Then pre-cultures inoculated in SM or SM + Lys media were grown overnight at 30°C. The main cultures were initiated with OD600nm = 0.125 in 850 μl of SC or SM + Lys media in 96-deep-well plates and incubated for 30h at 950 r.p.m. and 30°C with a 4-mm stirring bead per well. Then, 20 μl of cells were sampled every 3h and diluted 1:10 in water for OD600nm measurement. The cells were collected at 3,000g for 5 min and the supernatant was diluted 1:2 in absolute ethanol. A 1-μL portion of the supernatant was used for quantification of extracellular lysine by LC/MS-MS.
Diamide stress assays
Cells were grown overnight in liquid minimal media with lysine (50 μg m-1) or methionine (40 μg ml-1). The following day, the cultures were diluted to an OD600nm = 1 in water, serial diluted (1:10) and spotted onto SM media containing either lysine (50 μg ml-1) or methionine (40 μg ml-1) and different concentrations of diamide (0-1.5 mM). Plates were incubated for 2-3 days.
Hydrogen peroxide stress assays
Single wild-type colonies were isolated and resuspended in 70 μl of SM medium. A portion of the cell suspension (20 μl) was then transferred into the 3 conditions (SM, SM + L-Lys, SM + D-Lys, (L/D-Lys at 25 μg ml-1)) and cultured overnight in a 3 ml culture volume at 30oC with shaking. The following day, the pre-cultures were diluted to OD600nm = 0.1 and 25 μl was used to inoculate 450 μl of respective media in a deep-well plate (450 μl media, 25 μl preculture, 25 μl H2O2) for a final OD600nm of 0.005 and incubated for 16 h with H2O2 (0, 0.125, 0.25 and 0.5 mM). The resultant OD600nm was measured to assess the tolerance of the cells to oxidant stress. For NADPH sensor experiments, wild-type auxotrophic yeast strains (BY4741 and BY4742) were transformed with a centromeric plasmid that permits constitutive expression of mKate2 in conjunction with Yap1p-ox dependent eGFP 26 selectable with URA3 alone or in conjunction with the set of centromeric plasmids (pH, pL, pM or pK 35) that permit the restoration of prototrophy. After selection on SM + HLM/K or SM plates respectively, a single colony was isolated and used to inoculate pre-cultures under the three conditions listed above. After exposure to H2O2, 200 μl of the cultures were transferred to a 96-well plate and subjected to high-throughput flow cytometry (BD Fortessa X20B/HTS) and analysed by FlowJo v9.6.2 (for gating strategy information, see Supplementary Figure 1). Median fluorescence intensity (MFI) was then obtained for both mKate2 and eGFP. mKate MFI values were then used to normalize the eGFP values. Each condition was set up and analysed in quadruplicate.
ROS quantification by dihydrorhodamine staining
Wild-type cells were grown in SM medium until mid-log phase. Then, cells were incubated with H2O2 (10 mM) for 1h. Then, cells were collected, washed three times in SM medium, and incubated for 90 minutes in the dark at 30°C with 15 μM dihydrorhodamine 123 (DHR 123). Cells were washed once with media and stained for 5 min with propidium iodide (500 μg ml-1) to exclude dead cells, and subsequently washed three times with PBS. Cells were analysed by flow cytometry (BD Fortessa X20B/HTS) and quantified using FlowJo v9.6.2.
Direct effect of lysine (Lys) and methionine (Met) supplementation on the oxidative capacity of media containing H2O2
To test for a direct chemical reaction of L-lysine, D-Lysine and L-methionine with H2O2, these metabolites were supplemented into either H2O or SM medium at a concentration of 25 μg ml-1 for lysine and 40 μg ml-1 for methionine. Samples were buffered to pH 7.2 and treated with 2.5 mM of H2O2 for 0 or 30 min. H2O2 levels were measured using the Amplex Red Hydrogen Peroxide/Peroxidase Assay Kit (ThermoFisher Scientific, Cat no. A22188). Just before analysis, samples were diluted 1:1000 in Amplex Red reaction buffer to keep within the limits of detection of Amplex Red. Amplex Red analysis was performed according to the manufacturer’s instructions. Fluorescence detection was performed using a multimode detector (Tecan Infinite 200 Pro). For testing the direct effect of lysine and methionine supplementation on cell growth in medium containing H2O2, pre-cultures of the wild-type (BY4741-pHLUM) strain-grown overnight in SM media with or without supplementation with lysine (25 μg ml-1) and methionine (40 μg ml-1), were diluted to OD600= 0.1 and incubated at 30°C and 180 rpm. Cells were grown until the mid-log phase (OD600nm~ 0.5), washed, and treated with 2.5 mM of H2O2 that had previously been incubated in the respective fresh culture medium for 0 or 30 minutes. The growth was monitored in a multimode detector (Tecan Infinite 200 Pro) and recorded until the cultures reached the stationary phase. Data were analysed with the “grofit” R package and illustrated using Origin Pro 9.0.
Protective effect of lysine supplementation against H2O2 in different yeast and bacteria species
The protective effect of lysine against H2O2 was confirmed in two non-laboratory isolates of S. cerevisiae, OS473 (from palm wine, Cameroon) and OS265 (from a bakery in South Korea) 31, as well as C. tropicalis (from the National Collection of Yeast Cultures, accession NCYC4). Strains were pre-grown on YPD media and a single colony was suspended in 1 ml of SM media and grown for 6 h with shaking. A 10-μL portion was transferred to a fresh 1.8-ml culture in SM and SM + lysine (25 μg ml-1) and grown overnight with shaking. Culture density was measured, and 200 μl of SM culture with a starting OD600nm of 0.005- with or without lysine (25 μg ml-1, using matching pre-culture) and with or without 1.5 mM H2O2- was set in a 96-well plate. The OD600nm was measured every 15 min, with 15 s of shaking just beforehand, in a Tecan Infinite M200 Pro at 30°C.
In addition, we also tested the protective effect of lysine in the Gram-positive bacteria B. subtilis 168 trpC2. The strain was pre-cultured at 37°C in S7 minimal media supplemented with 40 μg ml-1 tryptophan. Next, the culture was back-diluted to an OD578nm of 0.01 in fresh minimal media and 65 μl was placed in 384-well plates supplemented with 0 or 40 μg ml-1 of lysine. H2O2 was added at the mid-log phase to reach a final concentration of 1.5 mM; the equivalent volume of water was added to the control. The OD578nm was measured every 10 min with cycles of orbital and linear shaking in between measurements in a Tecan Infinite M200 Pro at 37°C (n = 6).
Effect of the supplementation of lysine on growth and response to oxidative stress in mammalian cells
The mammalian cell lines used were HA1E, HeLa, A549 and BJhTERT, which were supplied by the Crick cell services. Cell authentication was performed using short tandem repeat (STR) profiling. In addition, the species were confirmed using a primer system based on the cytochrome C oxidase subunit 1 gene from mitochondria. For mycoplasma screening, two different tests were used: agar culture (which involves culturing any mycoplasma that may be present in the cell culture on specialised agar) and fluorescent staining (using the Hoechst Stain). For all experiments, cells were maintained in DMEM for stable isotope labelling by amino acids in cel culture (SILAC) (Thermo Scientific) supplemented with 0.4 mM L-arginine HCl (Sigma-Aldrich), 10% dialysed serum (Gibco), and L-lysine HCl (Sigma-Aldrich) at various concentrations. For cell growth assays, cells were seeded at 4,000 cells per well in a 96-well plate in seven different lysine concentrations ranging from 0 mM to 10 mM, in triplicate. The percentage confluence was calculated using an IncuCyte imaging system (Essen Bioscience).
For intracellular lysine quantification, cells were seeded at 0.5 x 10⁶ cells per 6-cm plate at four lysine concentrations (0.01, 0.1, 1 or 10 mM), in triplicate. Cells were grown for 48h before collection. To begin amino acid extraction, the plates were washed once with 37°C PBS and then the cells were trypsinized until they were detached from the plate. The detached cells were collected in 4°C PBS then spun at 300g for 2 min at 4°C. 80% ethanol (100 μl) was added to the pellet and the tubes vortexed to resuspend. The samples were incubated at 95°C for 2 min followed by vortexing. The last two steps were repeated once more. The tubes were then spun at 20,000g at 4°C for 2 min and the supernatant was analysed.
For oxidant resistance experiments, cells were seeded at 15,000 cells per well in a 96-well plate at four different lysine concentrations (0.1 mM, 1 mM, 5 mM or 10 mM), in triplicate. After 24 h, H2O2 (Sigma-Aldrich) was diluted in water to a range of concentrations and added directly to the culture media. After 24 h of incubation, the plates were fixed for 5 min in 10% neutral buffered formalin (Sigma-Aldrich) and stained with crystal violet staining solution (Sigma-Aldrich) for 10 min. After washing, the cells were lysed in a citrate buffer (pH 4) and the absorbance at 595 nm was recorded using a spectrophotometer (Tecan Life Sciences).
Identification of the candidate enzymes catalysing the biosynthesis of cadaverine, 13C carbon tracing
Wild-type, Δspe1, Δspe2, Δspe3 and Δspe4 yeast were grown overnight in 10 ml of SM media with or without 0.1 mM spermidine in the presence and absence of 25 μg ml-1 of lysine. Then, 10 ODU600nm were collected and cadaverine was quantified by LC/MS-MS. For the carbon-tracing experiment, wild-type and Δspe1 cells were grown overnight in 100 ml of SM media with 0.1 mM spermidine. Then, [13C6 15N2]L-lysine was added to a final concentration of 0.12 mM and samples (10 OD600nm) were collected after 0 and 60 min. [13C5 15N2]cadaverine was quantified by LC-MS/MS protocol that involves dansylation (see the ‘Metabolite quantification’ section in Methods).
Molecular docking
The 3D structure of ornithine decarboxylase from S. cerevisiae (Spe1p; UniProt ID: P08432 13) was obtained by homology modelling. The homology model was generated using Prime from the Schrödinger suite (v. 2015-3) and the structure of L. donovani ornithine decarboxylases (PDB ID: 2OO0 14) as template. The cofactor (vitamin B6 phosphate) and structural waters in the binding site were kept in the next steps. Ligand and protein structures were prepared using LigPrep and the Protein Preparation Wizard, respectively. The docking calculation was performed with Glide form Schrödinger Suite (v. 2015-3) using GlideXP settings and the GlideScore version XP5.0 scoring function. The grid size used for calculation was 20 × 20 × 20 Å. The conformation with the best score was reported.
Kinetic characterisation of Spe1p
The activity of the recombinant Spe1p was determined by measuring the production of cadaverine or putrescine by LC/MS-MS. For measuring enzyme activities, the 0.25-ml standard reaction contained a mix of 40 mM HEPES pH 7.5, 2 mM ornithine, 0.1 mM EDTA, 1 mM DTT, 0.1 mM pyridoxal phosphate (PLP) and 0.1 μg ml-1enzyme. The standard reaction for lysine decarboxylase activity was similar except for the addition of 20 mM lysine instead of ornithine. The Km for each substrate was determined by varying the concentration of ornithine from 0-2 mM or lysine from 0-20 mM. All kinetic parameters were recorded at 30°C. For determining enzyme activities, 30 μl of the reaction was sampled every minute and 120 μl of cold methanol was added to quench the reaction. Samples were kept on dry ice for 20 min and then centrifuged at high speed for 10 min. Supernatants were collected and putrescine and cadaverine were quantified by LC-MS/MS.
Modelling the metabolic reconfiguration caused by lysine harvesting
To investigate the metabolic changes required to adapt for an excess of lysine in the media, a revised version of the S. cerevisiae genome-scale metabolic model (iMM904_NADcorrected 22) was used. In total, six additional reactions related to cadaverine biosynthesis were added: two metabolic reactions for ornithine decarboxylase (H + lys_L --> CO2 + cadaverine) and spermine synthase (S-adenosyl 3-(methylthio) propylamine + cadaverine --> S-methyl-5'-thioadenosine + aminopropylcadaverine), and four reactions for transporting and exchanging cadaverine and aminopropylcadaverine to and from the cell. In silico SM constraints were used according to the original model (iMM904 41). For the excess lysine uptake condition, in addition to the minimal media setting, the constraint of L-lysine exchange reaction (EX_lys_L(e)) was fixed to an arbitrarily large value 1, which is far more than the rate required for growth. The model simulations, using the FBA approach, were performed in two steps. First, the maximum growth was predicted in the minimal media condition (we call it a naive model; Extended data Figure 4). Then, the predicted growth rate was fixed, and the rate of glutathione oxidoreductase reaction was maximised in both the minimal and lysine-supplemented media conditions. The COBRA toolbox 42 was used for all the model simulation.
Statistical Analysis
The metabolite concentration data, the results from the growth-curve analysis and the kinetic parameters are expressed as mean ± sd. The statistical significance was obtained using unpaired two-tailed Student’s t-test using a confidence level of 95%. Other statistical tests are indicated in the Figure legends.
Extended Data
Extended data Figure 1. Proteomic analysis.
A proteomic time-course experiment recorded by SWATH-MS 6, was re-analysed with a new spectral library and a recent version of Spectronaut (Biognosys) software, increasing the depth of the proteomic analysis. a, Principal component analysis shows that proteome profiles of H2O2-exposed Δtpo1 yeast 6 are more different from the wild type than that of a Tpo1p-overexpressing strain and that there is a metabolic adaptation in the lysine pathway. Numbers indicate time points (in minutes) after the oxidative insult. b, Gene Ontology (GO) enrichment analysis shows that a number of biosynthetic processes are significantly enriched in proteins differentially expressed between wild-type and Δtpo1 yeast upon exposure to H2O2. Most of the GO terms that are significantly enriched belong to processes that are typically seen to be activated upon treatment with H2O2, including oxidation-reduction process, cell cycle, nucleotide synthesis and ribosome 43. Metabolic processes affected include carbohydrate- and amino acid metabolism, including two GO terms specific for the lysine pathway. Significance of enrichment over base frequency was calculated using a binominal test 44, and P values (red line) were corrected for false discovery rate using Bonferroni (red) or Benjamini-Hochberg (green) correction. n = 5.
Extended data Figure 2. The S. cerevisiae lysine biosynthesis pathway via aminoadipate.
Lys20p/Lys21p, homocitrate synthase; Aco2p, aconitase; Lys4p, homoaconitase; Lys12p, homo-isocitrate dehydrogenase; Aro8p, 2-aminoadipate transaminase; Lys2p, α-aminoadipate reductase; Lys9p, saccharopine dehydrogenase (NADP+ and L-glutamate forming); Lys1p, saccharopine dehydrogenase (NAD+ and L-lysine forming).
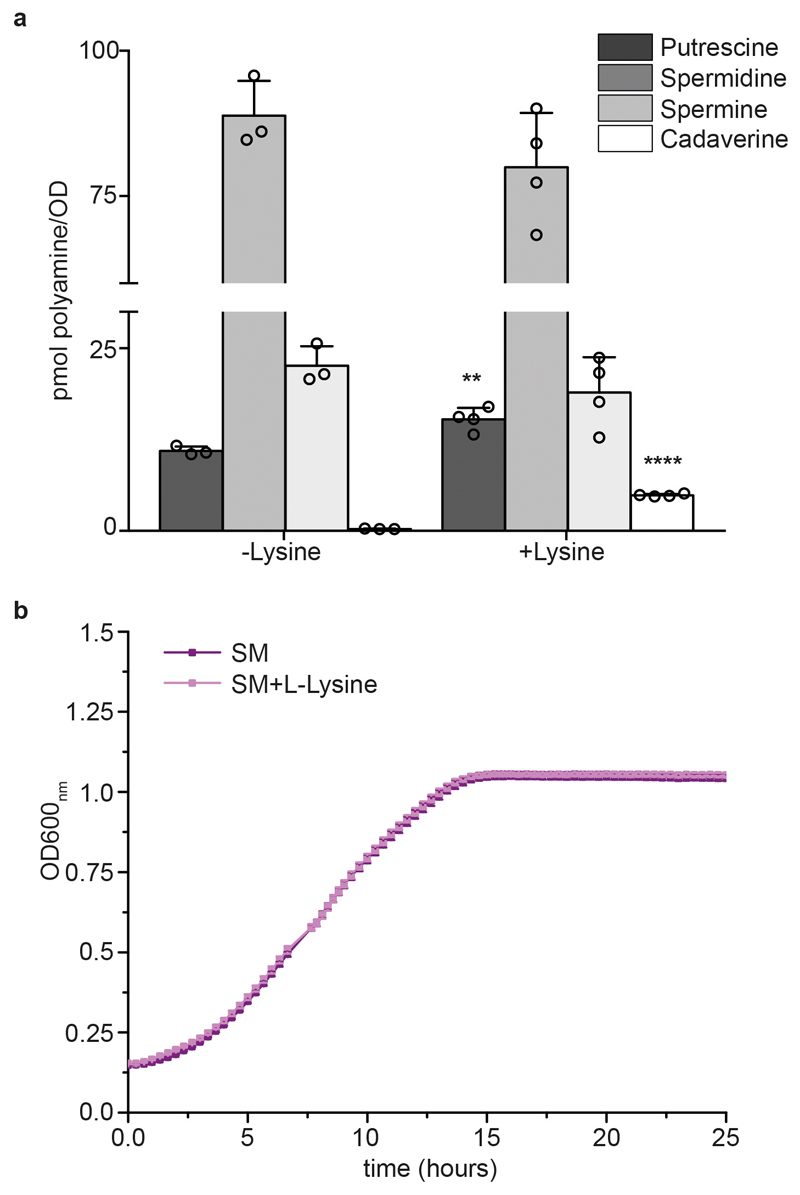
Extended data Figure 3. Effect of lysine supplementation on the intracellular concentration of the canonical polyamines and growth.
a, Polyamine content in yeast cells in the mid-log phase grown in SM media with and without 25 μg ml-1 of lysine, as quantified by LC-MS/MS using selected reaction monitoring. Bar charts represent the mean ± s.d.; n = 3 biologically independent samples for non-supplemented conditions and n=4 for supplemented conditions. Unpaired two-tailed Student’s t-test, wild-type cells supplemented versus non-supplemented with lysine: **** P ≤ 0.0001, ** P = 0.0066. b, Growth curves of wild-type cells grown in SM media with or without lysine (25 μg ml-1) supplementation. The data represent mean ± s.d.; n = 3 biologically independent samples.
Extended data Figure 4. Predictions of the growth-optimized (naive) model for flux balance analysis of lysine harvesting.
We used a revised version of the S. cerevisiae genome-scale metabolic model (iMM904_NADcorrected 22). Six additional reactions related to cadaverine biosynthesis were added: two metabolic reactions for ornithine decarboxylase (H + lys_L --> CO2 + cadaverine) and spermine synthase (S-adenosyl 3-(methylthio) propylamine + cadaverine --> S-methyl-5'-thioadenosine + aminopropyl-cadaverine), and four reactions for transporting and exchanging cadaverine and aminopropylcadaverine. In silico synthetic minimal media constraints were used according to the original model (iMM904 41). For excess lysine uptake, the constraint of L-lysine exchange reaction was fixed to value of 1. Model simulation (FBA) was performed using the COBRA toolbox for maximum growth in both media conditions.
Extended data Figure 5. Lysine and methionine supplementation have no growth-relevant effect on the oxidative capacity of media containing H2O2.
a, H2O2 levels measured by Amplex Red fluorescence in water (left) or SM medium (right) supplemented with L-lysine (25 μg ml-1), D-lysine (25 μg ml-1) or L-methionine (40 μg ml-1) with or without 30 min pre-incubation with 2.5 mM H2O2. The data represent mean ± s.d.; n = 3 independent experiments. b, Growth curves of cells pre-cultured in SM, SM + lysine (SM + Lys, 25 μg ml-1) or SM + methionine (SM + Met, μg ml-1). At mid-log phase (OD600nm ~0.5) cells were pre-incubated for 0 or 30 minutes with 2.5 mM of H2O2 in the respective pre-culture medium. The data represent mean ± s.d.; n = 3 biologically independent samples.
Extended data Figure 6. Effect of lysine supplementation on mammalian cell lines that are auxotrophic for lysine.
a, Growth curves showing the effect of different concentrations of lysine (0.01-10 mM) on mammalian cell growth. Percentage confluence was calculated using IncuCyte imaging system (Essen Bioscience). The data represent mean ± s.d.; n= 3 biologically independent samples. b, Intracellular lysine concentrations in different mammalian cell lines grown in DMEM with a range of concentrations of lysine (0.01-10 mM). Cells were seeded at 0.5 x 10⁶ cells per 6- cm plate and grown for 48 h before collection. The data represent mean ± s.d.; n = 3 biologically independent samples.
Extended data Figure 7. Lysine harvesting protects against H2O2 in different yeast and bacteria species.
a, Effect of the supplementation of lysine on the resistance of mammalian cells to H2O2. Cell biomass was quantified by crystal-violet staining following 24 h treatment with H2O2 at a range of concentrations in cultures supplemented with 0.1-10 mM lysine. The data represent mean ± s.d.; n = 3 biologically independent samples. b, Growth curves of C. tropicalis, the S. cerevisiae laboratory strain BY4741 with repaired auxotrophic loci and two non-laboratory isolates of S. cerevisiae in SM media with or without 25 μg ml-1 lysine. When challenged with 1.5 mM H2O2, cultures supplemented with lysine (pre-cultures were also supplemented) can survive and eventually grow (red versus green curves). c, Spot test of the resistance of P. pastoris to H2O2. Overnight cultures were grown in SM media (potassium phosphate-buffered, pH 6.0) with or without lysine (76 mg l-1) supplementation and were diluted to OD600nm= 1 in water, serial diluted and spotted onto SM media (potassium phosphate-buffered pH 6.0) with or without lysine supplementation and H2O2. The experiment was repeated with similar results. d, Growth curves of B. subtilis 168 trpC2 when challenged with 1.5 mM H2O2 versus a water control, at mid-log phase in S7 minimal media with or without lysine (40 μg ml-1) supplementation.
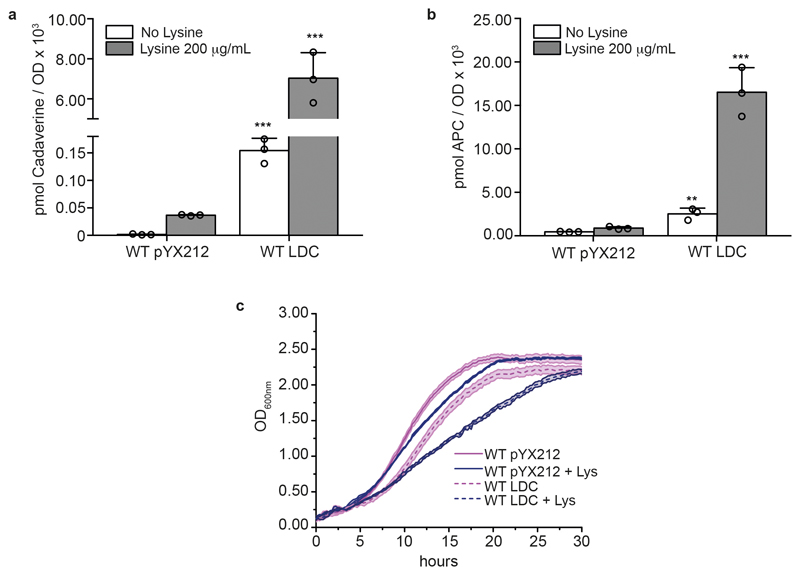
Extended data Figure 8. Yeast can accumulate high levels of cadaverine and aminopropylcadaverine that are not toxic.
a,b, Cadaverine (a) and aminopropylcadaverine (APC) (b) concentrations in S. cerevisiae wild-type strain overexpressing E. coli LdcC (WT LDC) or carrying the empty plasmid (WT pYX212). Polyamines were derivatized with dansyl chloride and quantified by LC-MS/MS. The data represent mean ± s.d.; n = 3 biologically independent samples. Unpaired two-tailed Student’s t-test: wild-type pYX212 versus WT LDC in non-supplemented conditions *** P = 0.0003 and supplemented conditions *** P = 0.0007 for a; and **P = 0.0054 and ***P = 0.0007 for non-supplemented and supplemented conditions for b. c, Growth curves showing the effect of lysine (250 μg ml-1) on growth when wild-type strain is overexpressing E. coli LdcC. The data represent mean ± s.d.; n = 3 biologically independent samples.
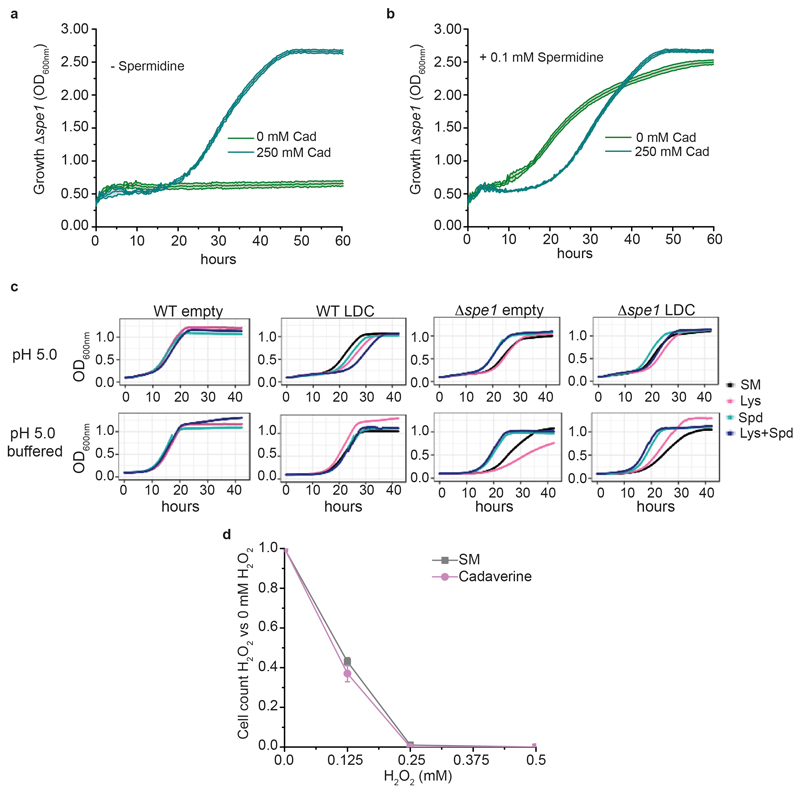
Extended data Figure 9. Cadaverine can partially substitute for canonical polyamines, but only at non-physiologically high concentrations and at a certain pH, and does not protect S. cerevisiae against H2O2 stress.
a,b, Growth curves of Δspe1 strain depleted from spermidine grown in SM media alone or supplemented with 250 mM cadaverine in the absence (a) or presence of 0.1 mM spermidine (b). The data represent mean ± s.d.; n = 3 biologically independent samples. c, Growth curves showing the effect of lysine supplementation on wild-type and Δspe1 strains carrying a control plasmid (empty) or overexpressing E. coli LdcC (LDC), when grown in SM media buffered or not buffered at pH 5.0. The data represent mean ± s.d.; n = 4 biologically independent samples per experiment. The experiment was repeated twice. d, H2O2 tolerances were determined as described above, but substituting lysine with 5 mM cadaverine. The data represent mean ± s.d.; n = 4 independent experiments. Even in the presence of this high level of cadaverine, the yeast cells to not tolerate higher levels of H2O2.
Extended data Table 1. Effect of cadaverine on abiotic stress and stationary phase survival.
| Experiment | Method | Results |
|---|---|---|
| Cumene hydroperoxide (CumOOH) | Growth curves of WT empty strain, WT LdcC+ in SM ± lysine (25 μg/mL) with CumOOH (0-1 mM). Growth curves Δspe1 empty/Δspe1 LdcC+ in SM + spermidine (0.1 mM), ± lysine (25 μg/mL) with CumOOH (0-1 mM). |
No difference |
| Paraquat | Growth curves and spot test WT empty strain, WT LdcC+ in SM, ±lysine (25 μg/mL) with paraquat (0-1 mM). | No difference |
| H2O2 | Spot test WT and empty strain, WT LdcC+ in SM with H2O2 (0-0.5 mM). Overnight incubation of WT with H2O2 (0-0.5 mM) in SM and SM + cadaverine (5 mM), cell count by flow cytometry. |
No difference |
| NaCl | Spot test WT and empty, WT LdcC+ in SM ± lysine (25 μg/mL) with NaCI (0-1 M). | No difference |
| Chronological ageing | Survival plating for 20 days of WT empty and WT LdcC+ cultures grown in SM and WT in SM Supplemented with cadaverine. | No difference |
Supplementary Material
Acknowledgements
This work was supported by the Francis Crick Institute which receives its core funding from Cancer Research UK (FC001134), the UK Medical Research Council (FC001134), and the Wellcome Trust (FC001134), as well as specific project funding from the Wellcome Trust (IA 200829/Z/16/Z to M.R.) and the ERC (StG260809 to M.R.). V. O.-S was funded by the Consejo Nacional de Ciencia y Tecnología Mexico (postdoctoral fellowship 232510.), M.T.A by the Warwick Medical School, and D.A.P.N by the Austrian Science Fund (Doctoral Program Biomolecular Technology of Proteins, FWF W1224). We thank A. Flint, H. Lee and D. Panneman for help with experiments; and A. Carter and E. Morales-Rios (MRC-LMB, Cambridge), M. K. Jensen (DTU), N. Typas and A. Koumoutsi (EMBL Heidelberg), G. Liti (University of Nice) and J. Hallin (Universite Laval) for providing strains, plasmids and enabling us to access their facilities.
Footnotes
Reprints and permissions information is available at http://www.nature.com/reprints.
Competing interests The authors declare no competing interests.
Author Contributions
V. O-S. identified cadaverine and the enzyme responsible for lysine decarboxylation, cloned SPE1 and carried out the expression, purification and kinetic characterization of recombinant Spe1p, the quantification of lysine in wild-type and Δtpo1 strains, the lysine uptake rate experiment in auxotroph and prototroph strains, the growth curves experiment of Δzwf1 in media supplemented with lysine and methionine, the quantification of GSH-NEM and polyamines and several experiments to identify the function of cadaverine. J.S.L.Y performed the H2O2 stress response experiments in yeast exposed to D/L-lysine and, together with D.A.P.N., sourced the materials and performed the NADPH sensor experiments. L.M.F performed experiments to uncover a function for cadaverine, cloned ldcC, performed the stress tests with Δzwf1 and analysed ROS levels by flow cytometry. M.T.A performed metabolic modelling and FBA analysis. S.K. conducted the experiment that assessed the extent of harvesting for all amino acids and H2O2 resistance in wild yeasts; C.C-M tested interactions between H2O2 with lysine and methionine; R.H. addressed the effect of cadaverine on growth; J.S. addressed the role of lysine harvesting in mammalian cells; D.A.P.N assessed H2O2 resistance in P. pastoris; L. H-D. conducted bacterial stress test experiments; O.M-L. the molecular docking experiments; J.V. conducted proteomic data analysis; M.M. developed metabolomics method and conducted LC-MS measurements; and M.R. conceived and supervised the study and wrote the first draft of the paper. All authors contributed to the experimental planning and writing up of the study.
Data availability statement
Proteomic data are accessible through (ProteomeXchange PXD013373). The kinetic data is available in Table 1, and the raw data used to generate the figures is provided in the Supplementary Tables.
References
- 1.Ralser M, et al. Dynamic rerouting of the carbohydrate flux is key to counteracting oxidative stress. J Biol. 2007;6:10. doi: 10.1186/jbiol61. [DOI] [PMC free article] [PubMed] [Google Scholar]
- 2.Kuehne A, et al. Acute Activation of Oxidative Pentose Phosphate Pathway as First-Line Response to Oxidative Stress in Human Skin Cells. Mol Cell. 2015;59:359–371. doi: 10.1016/j.molcel.2015.06.017. [DOI] [PubMed] [Google Scholar]
- 3.Mima S, et al. Identification of the TPO1 gene in yeast, and its human orthologue TETRAN, which cause resistance to NSAIDs. FEBS Lett. 2007;581:1457–1463. doi: 10.1016/j.febslet.2007.03.001. [DOI] [PubMed] [Google Scholar]
- 4.Albertsen M, Bellahn I, Kramer R, Waffenschmidt S. Localization and function of the yeast multidrug transporter Tpo1p. J Biol Chem. 2003;278:12820–12825. doi: 10.1074/jbc.M210715200. [DOI] [PubMed] [Google Scholar]
- 5.Uemura T, Tachihara K, Tomitori H, Kashiwagi K, Igarashi K. Characteristics of the polyamine transporter TPO1 and regulation of its activity and cellular localization by phosphorylation. J Biol Chem. 2005;280:9646–9652. doi: 10.1074/jbc.M410274200. [DOI] [PubMed] [Google Scholar]
- 6.Krüger A, et al. Tpo1-mediated spermine and spermidine export controls cell cycle delay and times antioxidant protein expression during the oxidative stress response. EMBO Rep. 2013 doi: 10.1038/embor.2013.165. [DOI] [PMC free article] [PubMed] [Google Scholar]
- 7.Ludwig C, et al. Data-independent acquisition-based SWATH-MS for quantitative proteomics: a tutorial. Mol Syst Biol. 2018;14:e8126. doi: 10.15252/msb.20178126. [DOI] [PMC free article] [PubMed] [Google Scholar]
- 8.Tomar PC, Lakra N, Mishra SN. A lysine catabolite involved in plant growth and development Cadaverine. 2013:1–15. doi: 10.4161/psb.25850. [DOI] [PMC free article] [PubMed] [Google Scholar]
- 9.Yamamoto Y, Miwa Y, Miyoshi K, Furuyama J, Ohmori H. The Escherichia coli ldcC gene encodes another lysine decarboxylase, probably a constitutive enzyme. Genes Genet Syst. 1997;72:167–172. doi: 10.1266/ggs.72.167. [DOI] [PubMed] [Google Scholar]
- 10.Igarashi K, et al. Formation of a compensatory polyamine by Escherichia coli polyamine-requiring mutants during growth in the absence of polyamines. J Bacteriol. 1986;166:128–134. doi: 10.1128/jb.166.1.128-134.1986. [DOI] [PMC free article] [PubMed] [Google Scholar]
- 11.Whitney PA, Morris DR. Polyamine auxotrophs of Saccharomyces cerevisiae. J Bacteriol. 1978;134:214–220. doi: 10.1128/jb.134.1.214-220.1978. [DOI] [PMC free article] [PubMed] [Google Scholar]
- 12.Taxis C. A safety catch for ornithine decarboxylase degradation. Microb Cell Fact. 2015;2:174–177. doi: 10.15698/mic2015.06.210. [DOI] [PMC free article] [PubMed] [Google Scholar]
- 13.Tyagi AK, Tabor CW, Tabor H. Ornithine decarboxylase from Saccharomyces cerevisiae. Purification, properties, and regulation of activity. J Biol Chem. 1981;256:12156–12163. [PubMed] [Google Scholar]
- 14.Dufe VT, et al. A structural insight into the inhibition of human and Leishmania donovani ornithine decarboxylases by 1-amino-oxy-3-aminopropane. Biochem J. 2007;405:261–268. doi: 10.1042/BJ20070188. [DOI] [PMC free article] [PubMed] [Google Scholar]
- 15.Mülleder M, et al. Functional Metabolomics Describes the Yeast Biosynthetic Regulome. Cell. 2016;167:553–565.e12. doi: 10.1016/j.cell.2016.09.007. [DOI] [PMC free article] [PubMed] [Google Scholar]
- 16.Park JO, et al. Metabolite concentrations, fluxes and free energies imply efficient enzyme usage. Nat Chem Biol. 2016;12:482–489. doi: 10.1038/nchembio.2077. [DOI] [PMC free article] [PubMed] [Google Scholar]
- 17.Bianchi F, et al. Asymmetry in inward- and outward-affinity constant of transport explain unidirectional lysine flux in Saccharomyces cerevisiae. Sci Rep. 2016;6:31443. doi: 10.1038/srep31443. [DOI] [PMC free article] [PubMed] [Google Scholar]
- 18.Ough CS, Huang Z, An D, Stevens D. Amino Acid Uptake by Four Commercial Yeasts at Two Different Temperatures of Growth and Fermentation: Effects on Urea Excretion and Reabsorption. Am J Enol Vitic. 1991;42:26–40. [Google Scholar]
- 19.Tucci AF. Feedback inhibition of lysine biosynthesis in yeast. J Bacteriol. 1969;99:624–625. doi: 10.1128/jb.99.2.624-625.1969. [DOI] [PMC free article] [PubMed] [Google Scholar]
- 20.Feller A, Ramos F, Piérard A, Dubois E. In Saccharomyces cerevisae, feedback inhibition of homocitrate synthase isoenzymes by lysine modulates the activation of LYS gene expression by Lys14p. Eur J Biochem. 1999;261:163–170. doi: 10.1046/j.1432-1327.1999.00262.x. [DOI] [PubMed] [Google Scholar]
- 21.Andi B, West AH, Cook PF. Regulatory mechanism of histidine-tagged homocitrate synthase from Saccharomyces cerevisiae. I. Kinetic studies. J Biol Chem. 2005;280:31624–31632. doi: 10.1074/jbc.M502846200. [DOI] [PubMed] [Google Scholar]
- 22.Szappanos B, et al. An integrated approach to characterize genetic interaction networks in yeast metabolism. Nat Genet. 2011;43:656–662. doi: 10.1038/ng.846. [DOI] [PMC free article] [PubMed] [Google Scholar]
- 23.Stincone A, et al. The return of metabolism: biochemistry and physiology of the pentose phosphate pathway. Biol Rev Camb Philos Soc. 2015;90:927–963. doi: 10.1111/brv.12140. [DOI] [PMC free article] [PubMed] [Google Scholar]
- 24.Nogae I, Johnston M. Isolation and characterization of the ZWF1 gene of Saccharomyces cerevisiae, encoding glucose-6-phosphate dehydrogenase. Gene. 1990;96:161–169. doi: 10.1016/0378-1119(90)90248-p. [DOI] [PubMed] [Google Scholar]
- 25.Slekar KH, Kosman DJ, Culotta VC. The yeast copper/zinc superoxide dismutase and the pentose phosphate pathway play overlapping roles in oxidative stress protection. J Biol Chem. 1996;271:28831–28836. doi: 10.1074/jbc.271.46.28831. [DOI] [PubMed] [Google Scholar]
- 26.Zhang J, et al. Engineering an NADPH/NADP Redox Biosensor in Yeast. ACS Synthetic Biology. 2016;5:1546–1556. doi: 10.1021/acssynbio.6b00135. [DOI] [PubMed] [Google Scholar]
- 27.Toroser D, Yarian CS, Orr WC, Sohal RS. Mechanisms of γ-glutamylcysteine ligase regulation. Biochimica et Biophysica Acta (BBA) - General Subjects. 2006;1760:233–244. doi: 10.1016/j.bbagen.2005.10.010. [DOI] [PMC free article] [PubMed] [Google Scholar]
- 28.Shenton D, Grant CM. Protein S-thiolation targets glycolysis and protein synthesis in response to oxidative stress in the yeast Saccharomyces cerevisiae. Biochem J. 2003;374:513–519. doi: 10.1042/BJ20030414. [DOI] [PMC free article] [PubMed] [Google Scholar]
- 29.Grüning N-M, et al. Pyruvate kinase triggers a metabolic feedback loop that controls redox metabolism in respiring cells. Cell Metab. 2011;14:415–427. doi: 10.1016/j.cmet.2011.06.017. [DOI] [PMC free article] [PubMed] [Google Scholar]
- 30.Campbell K, Vowinckel J, Keller MA, Ralser M. Methionine Metabolism Alters Oxidative Stress Resistance via the Pentose Phosphate Pathway. Antioxid Redox Signal. 2016;14:1–14. doi: 10.1089/ars.2015.6516. [DOI] [PMC free article] [PubMed] [Google Scholar]
- 31.Peter J, et al. Genome evolution across 1,011 Saccharomyces cerevisiae isolates. Nature. 2018;556:339–344. doi: 10.1038/s41586-018-0030-5. [DOI] [PMC free article] [PubMed] [Google Scholar]
- 32.Dever TE, Ivanov IP. Roles of polyamines in translation. J Biol Chem. 2018;293:18719–18729. doi: 10.1074/jbc.TM118.003338. [DOI] [PMC free article] [PubMed] [Google Scholar]
- 33.Morano KA, Grant CM, Moye-Rowley WS. The response to heat shock and oxidative stress in Saccharomyces cerevisiae. Genetics. 2012;190:1157–1195. doi: 10.1534/genetics.111.128033. [DOI] [PMC free article] [PubMed] [Google Scholar]
- 34.Brachmann CB, et al. Designer deletion strains derived from Saccharomyces cerevisiae S288C: a useful set of strains and plasmids for PCR-mediated gene disruption and other applications. Yeast. 1998;14:115–132. doi: 10.1002/(SICI)1097-0061(19980130)14:2<115::AID-YEA204>3.0.CO;2-2. [DOI] [PubMed] [Google Scholar]
- 35.Mülleder M, Campbell K, Matsarskaia O, Eckerstorfer F, Ralser M. Saccharomyces cerevisiae single-copy plasmids for auxotrophy compensation, multiple marker selection, and for designing metabolically cooperating communities. F1000Res. 2016;5:2351. doi: 10.12688/f1000research.9606.1. [DOI] [PMC free article] [PubMed] [Google Scholar]
- 36.Ralser M, et al. A catabolic block does not sufficiently explain how 2-deoxy-D-glucose inhibits cell growth. Proc Natl Acad Sci U S A. 2008;105:17807–17811. doi: 10.1073/pnas.0803090105. [DOI] [PMC free article] [PubMed] [Google Scholar]
- 37.Campbell K, et al. Self-establishing communities enable cooperative metabolite exchange in a eukaryote. Elife. 2015;4 doi: 10.7554/eLife.09943. [DOI] [PMC free article] [PubMed] [Google Scholar]
- 38.Kahm M, et al. grofit: fitting biological growth curves with R. J Stat Softw. 2010;33:1–21. [Google Scholar]
- 39.Reyes-Becerril M, Esteban MÁ, Tovar-Ramírez D, Ascencio-Valle F. Polyamine determination in different strains of the yeast Debaryomyces hansenii by high pressure liquid chromatography. Food Chem. 2011;127:1862–1865. [Google Scholar]
- 40.Sasidharan K, Soga T, Tomita M, Murray DB. A yeast metabolite extraction protocol optimised for time-series analyses. PLoS One. 2012;7:e44283. doi: 10.1371/journal.pone.0044283. [DOI] [PMC free article] [PubMed] [Google Scholar]
- 41.Mo ML, Palsson BO, Herrgård MJ. Connecting extracellular metabolomic measurements to intracellular flux states in yeast. BMC Syst Biol. 2009;3:37. doi: 10.1186/1752-0509-3-37. [DOI] [PMC free article] [PubMed] [Google Scholar]
- 42.Heirendt L, et al. Creation and analysis of biochemical constraint-based models: the COBRA Toolbox v3.0. arXiv [q-bio.QM] 2017 doi: 10.1038/s41596-018-0098-2. [DOI] [PMC free article] [PubMed] [Google Scholar]
- 43.Godon C, et al. The H2O2 stimulon in Saccharomyces cerevisiae. J Biol Chem. 1998;273:22480–22489. doi: 10.1074/jbc.273.35.22480. [DOI] [PubMed] [Google Scholar]
- 44.Mi H, Muruganujan A, Casagrande JT, Thomas PD. Large-scale gene function analysis with the PANTHER classification system. Nat Protoc. 2013;8:1551–1566. doi: 10.1038/nprot.2013.092. [DOI] [PMC free article] [PubMed] [Google Scholar]
Associated Data
This section collects any data citations, data availability statements, or supplementary materials included in this article.
Supplementary Materials
Data Availability Statement
Proteomic data are accessible through (ProteomeXchange PXD013373). The kinetic data is available in Table 1, and the raw data used to generate the figures is provided in the Supplementary Tables.


