Abstract
While identification and analysis of genes affecting genome stability have traditionally relied on reporter assays, whole-genome sequencing technologies now enable, in principle, direct measurements of genome instability globally and at scale. Here, we have surveyed the Saccharomyces cerevisiae gene knockout collection by sequencing the whole genomes of its strains, and characterized genomic changes caused by the absence of essentially any one of the non-essential yeast genes. Analysing this dataset (http://sgv.gurdon.cam.ac.uk) reveals genes affecting repetitive-element maintenance or mutagenesis, highlights cross-talks between nuclear and mitochondrial genome stability, and shows how strains have adapted to loss of non-essential genes.
Understanding gene functions is a key goal of biomedical research. A major scientific milestone was the completion of the S. cerevisiae gene knockout collection (YKOC), which facilitated high-throughput phenotypic screens, genetic-interaction analyses and reverse genetics1–3. Ensuing experimental work highlighted occasional inconsistencies, mistakes, and genome changes rebalancing the effects of specific knockouts4–6 but a complete overview is lacking. To address how gene loss influences genomic stability/structure, we whole-genome sequenced (WGS) nearly all of the 4,732 strains of the homozygous diploid YKOC. After identifying and reassigning targeted genes when they did not correspond to the expected, we confirmed most knockout strains (Extended Data Fig. 1a-b; for all gene-specific information, see supplementary tables 1-4 and http://sgv.gurdon.cam.ac.uk). We then determined each strain’s genome-instability profile, particularly in regard to repetitive DNA (Fig. 1a).
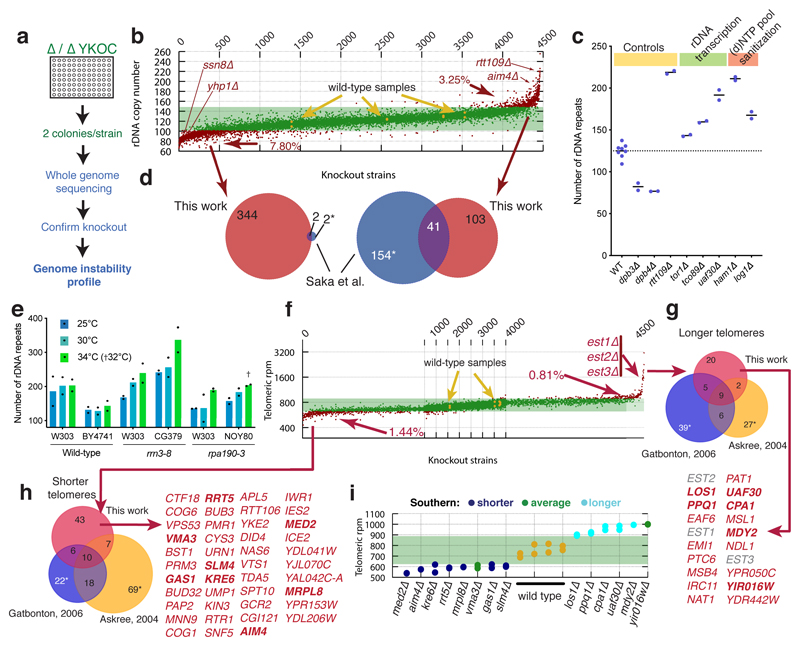
Figure 1. Assessment of repetitive-DNA alterations in the YKOC.
(a) Screen schematics. (b) rDNA copy-number distribution for YKOC strains (details in Extended Data Fig 1c legend). (c) Extract from (b) showing that gene-knockouts affecting functional rRNA synthesis display increased rDNA copy number (median from n=2-8 biologically independent samples). (d) Overlaps between genes affecting rDNA length identified in this study and the literature. Asterisks indicate that some genes, for which we have no data, were removed from the “hits” identified in that study. (e) rDNA copy-number estimates of strains carrying ts alleles of RRN3 or RPA190 grown at permissive or semi-permissive temperatures (the average of n=2 biologically independent samples taken on different days of growth is shown). (f) Telomere length distribution for YKOC strains (details in Extended Data Fig 1c legend). (g-h) Overlap between gene KOs associated with telomere lengthening or shortening identified in this work and the literature; EST KO strains were previously identified as having shorter telomeres. (i) Validation of 14 predicted novel TLM genes.
rRNA defects lead to rDNA expansion
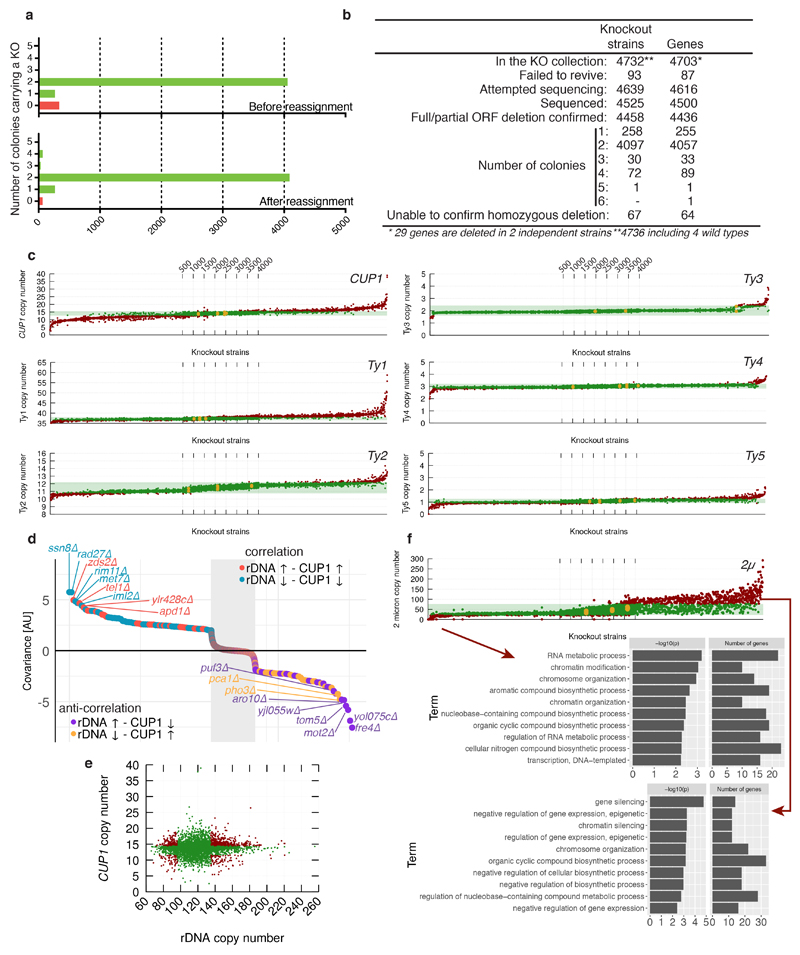
We developed and validated tools to accurately measure repetitive DNA copy-numbers based on the concept that, when a sequenced genome contains more copies of a locus than the single copy-number reference genome, that locus displays proportionately elevated sequence coverage (Extended Data Fig. 2 and methods). Global analysis of the repetitive rDNA locus that encodes large ribosomal RNAs (rRNAs) revealed copy-number alterations in ~10% of strains (Fig. 1b). Knockouts known to affect rDNA-locus size, such as RTT109, DPB3 and DPB47 displayed rDNA copy numbers in line with expectations (Fig. 1c). Comparing genes predicted to affect rDNA locus size with a previous study8 revealed a partial overlap as well as many new players (Fig. 1d). Strains with rDNA expansion included knockouts affecting rDNA transcription, such as those for RNA Pol I transcription factor Uaf30 or TORC subunits Tor1 and Tco899 (Fig. 1c), suggesting that reduced rDNA transcription fosters rDNA-locus expansion. Indeed, measuring rDNA copy numbers in strains bearing thermosensitive RPA190 (RNA Pol I subunit) or RRN3 (Pol I recruitment factor) alleles revealed temperature-dependent rDNA-locus size increases, in line with recent findings10 (Fig. 1e). Knockout of HAM1 or LOG1 (YJL055W), encoding (d)NTP-pool sanitising factors11, was also associated with a larger rDNA locus, probably because incorporation of non-canonical nucleotides into rRNA impairs its functionality (Fig. 1c). Because knockouts affecting tandem-repeat stability could affect rDNA-locus size, we compared rDNA and repetitive CUP1-locus copy-numbers (Extended Data Fig. 1c). Strains with high positive correlations included TEL1, RAD27, SSN8 and ZDS2 knockouts, but lack of overall correlation suggests that different selective pressures largely drive variation at these loci (Extended Data Fig. 1d-e).
Genes affecting telomere length
Copy-number distributions for other genomic elements (telomeres, 2μ plasmid and Ty transposons) had lower variabilities than rDNA (Fig. 1f and Extended Data Fig. 1c; 2μ copy numbers did not follow a normal distribution, see Extended Data Fig. 1d for discussion). Telomere-length estimates highlighted strains lacking telomerase subunits (est1Δ, est2Δ, est3Δ) as having longest telomeres, in line with alternative telomere elongation (ALT) not being subject to normal telomere-length homeostasis. Our predicted TLM (telomere maintenance) genes partially overlapped with those defined previously12,13 (Fig. 1g-h). To validate predictions for novel TLM genes, we measured telomere lengths by gel electrophoresis (Fig. 1g-h,bold gene names), confirming telomeric phenotypes for 12 of 14 selected (Fig. 1i and Extended Data Fig. 3a; as shown in Extended Data Fig 3b, we also validated telomeric impacts for ~70% of a selection of strains failing stringent criteria but with high/low telomere-length estimates). Network analysis of predicted TLM genes prominently featured DNA-, RNA- and/or chromatin-metabolism, and highlighted connections to endoplasmic reticulum, Golgi and/or vesicle trafficking14 (Extended Data Fig 3c).
Aneuploidies in the YKOC
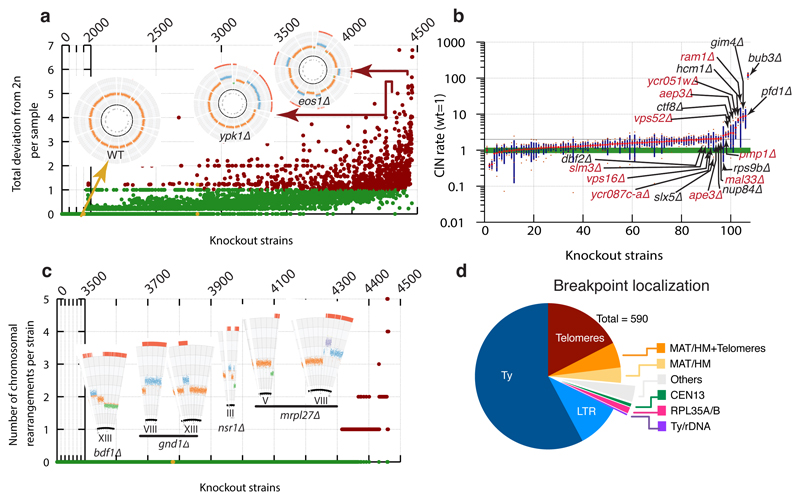
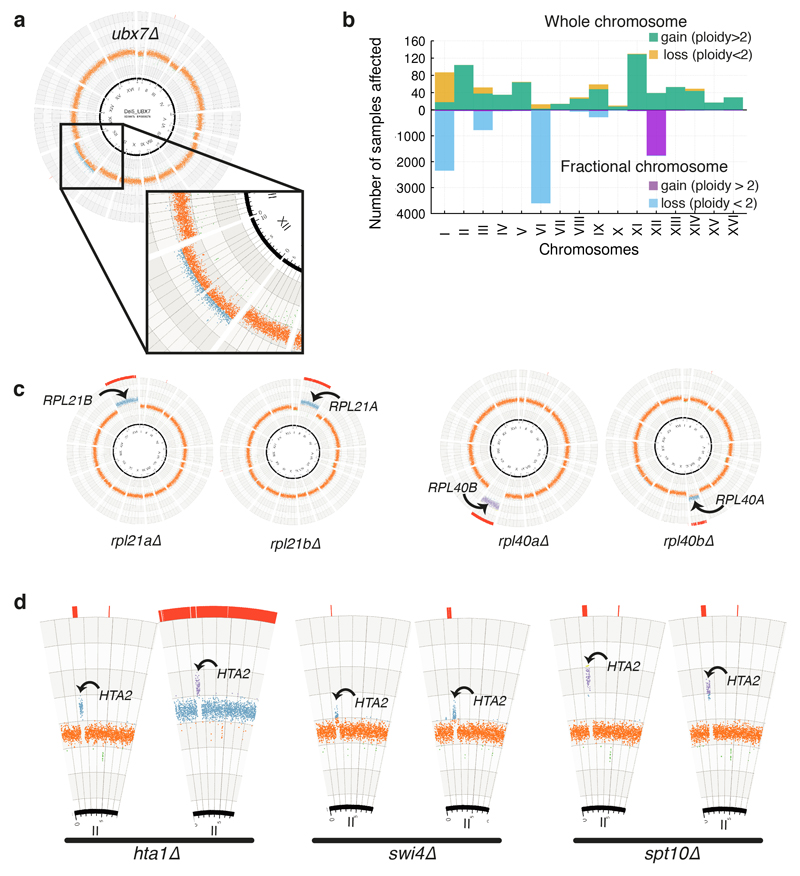
Sequencing coverage also offers information on copy-number variation between and within chromosomes. Strikingly, ~52% of sequenced colonies displayed some deviation from 2n ploidy, with a minority exhibiting stable chromosome gains and/or losses (see methods and Fig. 2a). Most aneuploid strains displayed “incomplete” aneuploidies (gain/loss of less than a whole chromosome unit), suggesting cell culture heterogeneity. These events affected different chromosomes differently, with the smallest chromosomes most frequently lost (I, VI, and III; in line with chromosome loss negatively correlating with chromosome size15) and the largest most frequently gained (chr XII; in line with its delayed segregation likely resulting in occasional non-disjunctions16; Extended Data Fig. 4a-b). Highly-aneuploid strains included knockouts encoding proteins involved in chromosome segregation such as Sgo117, Eos118, as well as genes without documented connections to karyotype maintenance. While some of these can be explained by the deletion cassette affecting a neighbouring gene (e.g. iwr1Δ on NUP84)19, the origin of aneuploidy in others requires further investigation. To determine if high aneuploidy correlates with chromosome instability (CIN), we used a mini-chromosome CIN reporter20 in freshly-generated knockouts (Fig. 2b). Most of these had marginally increased CIN, with only a small subset displaying a strong CIN phenotype, suggesting that most aneuploidies do not originate from severe chromosome-segregation defects caused by the gene knockout. In line with this, when we focused on ribosomal proteins — often encoded by two near-identical gene paralogs — in 28/97 cases analysed, gene-deletion was accompanied by gain of the chromosome carrying the paralog (Extended Data Fig. 4c).
Figure 2. Identification of knockout strains with aberrant karyotypes.
(a) Distribution of total deviation from expected ploidy (2n) for YKOC strains in chromosome units (details in Extended Data Fig 1c legend). (b) CIN estimates for 106 fresh KO strains selected from those with highest deviation from diploidy (n=4 biologically independent samples for most strains; red dot: average; green band: wild-type sample SD; blue column: KO sample SD). (c) Distribution of chromosome rearrangements (CRs) detected in the YKOC (details in Extended Data Fig 1c legend). (d) Localisation of CR breakpoints in strains analysed.
Approximately 2% of strains carried single or multiple sub-chromosomal deletions/amplifications, often initiating at Ty transposons or interspersed LTR sites and terminating at similar sites or chromosome ends (Fig. 2c-d). As previously observed21–23, breakpoint-localisations to repetitive regions suggests that homologous recombination (HR) processes drive such rearrangements. Indeed, mapping the remaining breakpoints revealed strains rad2Δ and mrp21Δ to carry a single-copy gain or loss of the same chromosome IV fragment whose boundaries map to the homologous RPL35A and RPL35B genes. As with aneuploidies, we found evidence of rearrangements compensating effects of gene knockouts (Extended Data Fig. 4d). Together with previous works6,24–26, our results suggest that relatively frequent chromosomal mis-segregations permit evolution of phenotypic suppression and fitness improvements in many knockout settings.
Genome instability drives increased mtDNA
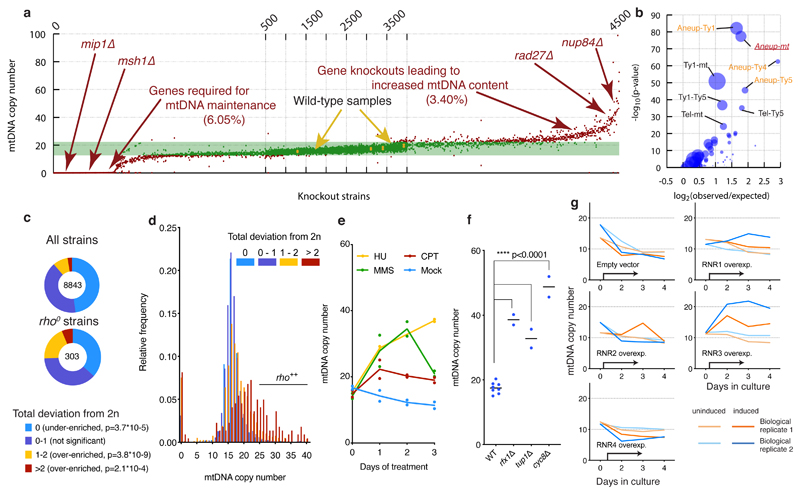
Estimating mitochondrial DNA (mtDNA) copy-numbers from whole-genome sequencing data (Extended Data Fig. 5) indicated that ~6% of non-essential genes are required to maintain mtDNA (Figure 3a) and that these overlap with genes required for respiratory growth or encoding mitochondrial proteins (Extended Data Fig. 6a). When we assessed connections between various features of nuclear-genome instability, and between these and mtDNA copy-number, we found correlations between aneuploidies and mtDNA copy-number changes (and between aneuploidies and altered Ty copy-numbers, since chromosome gains/losses can alter Ty-element numbers; Fig. 3b). Indeed, strains with higher deviations from 2n ploidy were over-represented among rho0 colonies that lack detectable mtDNA (Fig. 3c). The extent to which connections between mtDNA loss and aneuploidy reflect iron-sulphur-cluster formation defects27 and/or other mechanisms remains to be explored.
Figure 3. mtDNA copy number and its links to genome instability and elevated RNR expression.
(a) Distribution of mtDNA copy number for YKOC strains (details in Extended Data Fig 1c legend). (b) Correlation between pairs of abnormal genomic parameters measured in different colonies. Every circle is a comparison between two parameters; diameter = number of colonies found as abnormal in both parameters. Holm-Bonferroni corrected p-values and fold-change from the corresponding hyper-geometric distribution (n=8843 biologically independent samples). (c) Frequency of aneuploidy types in all YKOC and in rho0 strains; hyper-geometric p-values for under/over-enrichment in rho0 strains (nall=8843 or nrho0=303 biologically independent samples). (d) Distribution of mtDNA copy number in strains with increasing deviation from diploidy. (e) DNA-damage induction leads to increased mtDNA copy number (mean from n=2 biologically independent samples). (f) Strains lacking transcriptional repression of RNR genes have increased mtDNA (mean from nwt=8 or nKO=2 biologically independent samples; p = two-tailed unpaired t-test). (g) RNR1 or RNR3 overexpression increases mtDNA levels.
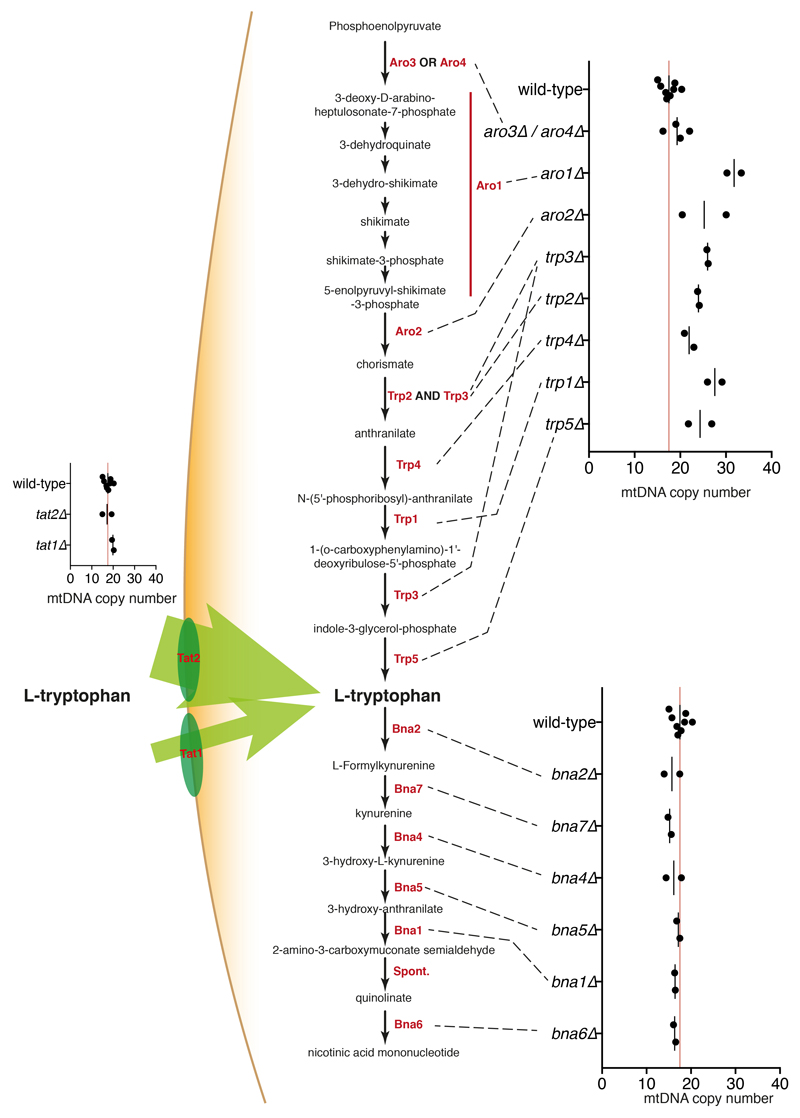
Mitochondrial DNA analyses also highlighted ~130 knockouts associated with increased mtDNA (rho++; Fig. 3a). Compared to other strains, rho++ strains collectively displayed higher deviation from diploidy (Fig. 3d) and were enriched in genes related to DNA repair/metabolism rather than to mitochondrial biology (Extended Data Fig. 6b). We hypothesised that DNA-repair defects might lead to rho++ phenotype via persistent DNA-damage response (DDR) activation. Indeed, genotoxin-mediated DDR activation in wild-type strains triggered increased mtDNA copy-number (Fig. 3e). mtDNA copy-number increases can arise from overexpression of ribonucleotide reductase (RNR) components28 that are under DDR control29; and accordingly, knockouts of RNR-gene transcriptional repressors (RFX1, TUP1, CYC8) led to mtDNA copy-number increases (Fig. 3f). Furthermore, of 16 rho++ strains selected for analysis, 9 displayed RNR induction, 6 displayed spontaneous Rad53 phosphorylation (another marker of DDR activation), and 13 were hypersensitive to hydroxyurea (HU), an RNR inhibitor causing replication stress (Extended Data Fig. 6c). Furthermore, HU-hypersensitive KO strains30,31 were enriched among rho++ strains (Extended Data Fig. 6d). Comparing mtDNA contents with systematic analyses of Rnr3 levels32 revealed that many KOs deleted in genes protecting genome stability displayed both increased Rnr3 levels and a rho++ phenotype (Extended Data Fig. 6e, green). Accordingly, overexpressing the RNR catalytic subunit Rnr3, and to a lesser extent Rnr1, increased mtDNA levels (Fig. 3g; overexpressing Rnr2 or Rnr4 did not). As Rnr1/Rnr3 overexpression increases dNTP levels33,34, these results suggested that elevated dNTP production increases mtDNA copy-number, perhaps by stimulating mtDNA replication. Curiously, among rho++ strains with normal Rnr3 levels were knockouts of genes encoding tryptophan biosynthesis-pathway enzymes (Extended Data Fig. 7). The basis for this connection requires further investigation.
Alleles suppressing mtDNA loss
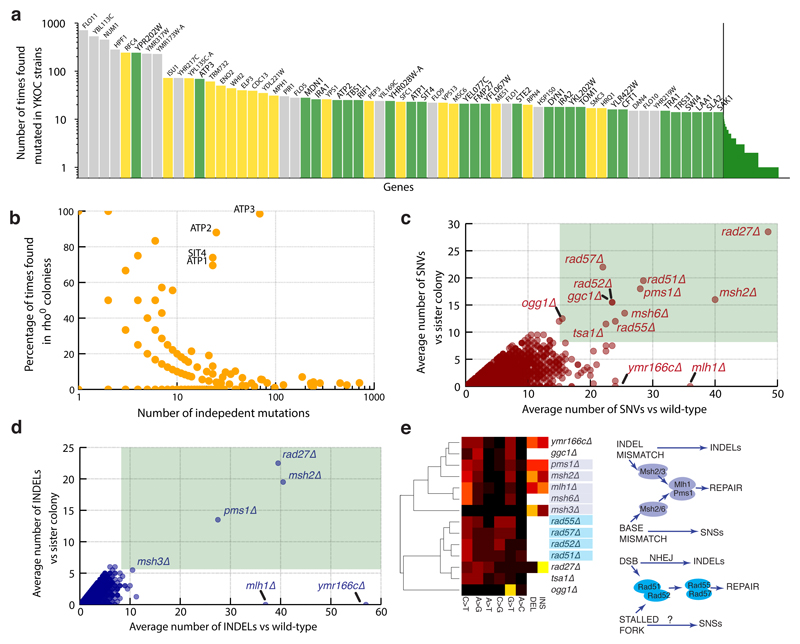
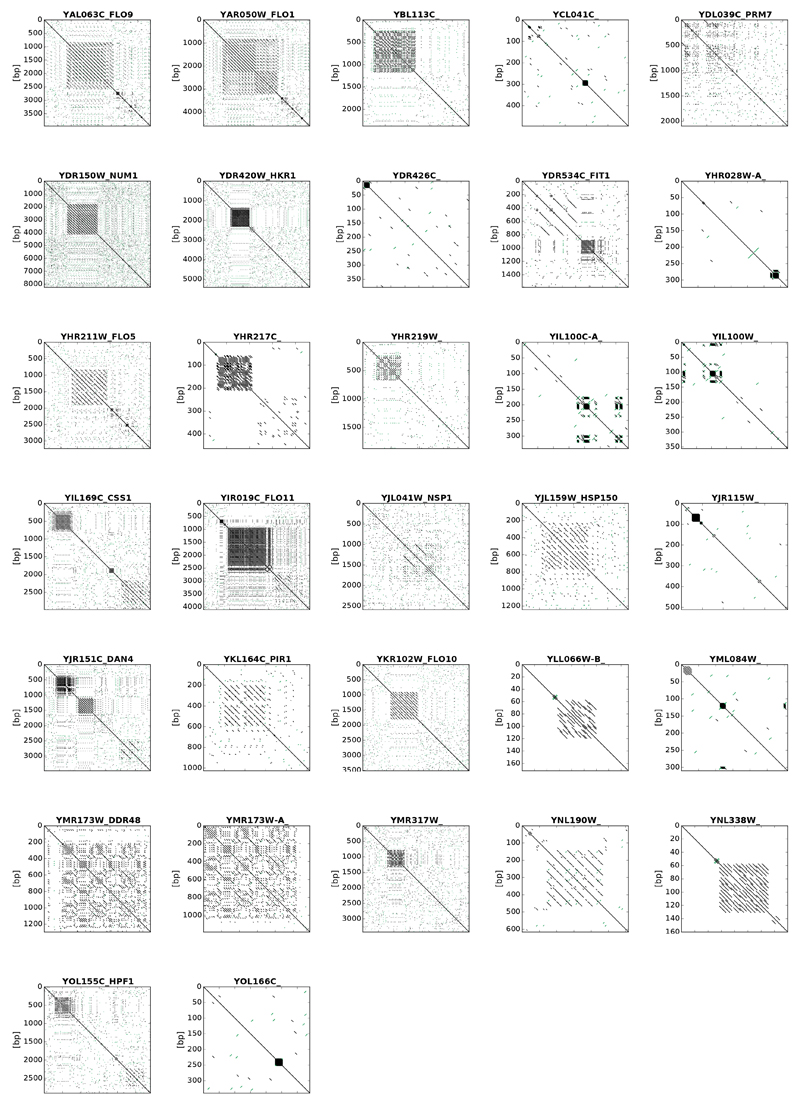
Extracting information on single-nucleotide variants (SNVs) and insertion/deletions (INDELs) across the YKOC revealed genes carrying higher than expected mutation numbers (Fig 4a). Inspecting their coding sequences revealed microsatellite features (homopolymers and/or small degenerate tandem repeats), suggesting that these variants had arisen via imprecise DNA replication or imprecise sequencing/read-mapping (Fig 4a, grey bars and Extended Data Fig 8). Another subset of frequently-mutated genes each carried one very frequent “founder” mutation (Fig 6a, yellow bars) found predominantly in KO strains generated by single YKOC consortium laboratories (Extended Data Fig 9). The remaining frequently-mutated genes included ATP1, ATP2 and ATP3, encoding subunits of the ATP-synthase complex recently identified as a cell-fitness hub6. Analysis of mutation prevalence revealed that ATP1, ATP2, ATP3 and SIT4 (a phosphatase acting on ATP-synthase35) mutations were frequent in rho0 strains but relatively rare in other strains. (Fig 4b). These results suggest that alteration of ATP-synthase function can promote fitness of rho0 cells.
Figure 4. HR defects yield a SNV signature.
(a) Number of “independent” mutations in the YKOC by gene: grey = genes with short repetitive regions; yellow = genes carrying “founder” mutations; green = other frequently-mutated genes. (b) Enrichment of ATP1-3 and SIT4 mutations in rho0 strains. (c-d) Average number of SNVs/INDELs in YKOC strains versus the wild-type (BY4743) and between different colonies of the same KO strain. (e) Clustering of hypermutator KO strains based on their SNV and INDEL patterns and schematic of potential underlying mutagenic processes.
HR defects yield a SNV signature
As YKOC strains have been cultured over many years, overall mutation numbers could highlight hyper-mutators. Thus, we estimated sequence divergence of two colonies of the same KO strain from each other and from wild-type (BY4743). Hyper-mutators are expected to show increases in both; and indeed, DNA-mismatch repair (MMR) defective strains were readily detected this way (Fig 4c-d; pms1Δ, msh2Δ, msh6Δ; only one mlh1Δ colony sequence was available). Many strains lacking HR components (rad51Δ, rad52Δ, rad55Δ, rad57Δ) also showed a similar phenotype, implying that HR deficiencies yield SNVs, possibly via mutagenic trans-lesion polymerases36,37. Distinct mutation patterns can be used to cluster genome-stability genes into functional categories38. Clustering of hypermutators that we identified based on their mutation profiles produced two main groups corresponding to known MMR and HR genes, and also clustered ymr166cΔ and ggc1Δ with the MMR group (Fig 4e). YMR166C is located upstream of MLH1, so its deletion could affect MLH1 expression19, while SNV abundance in ggc1Δ remains to be explained.
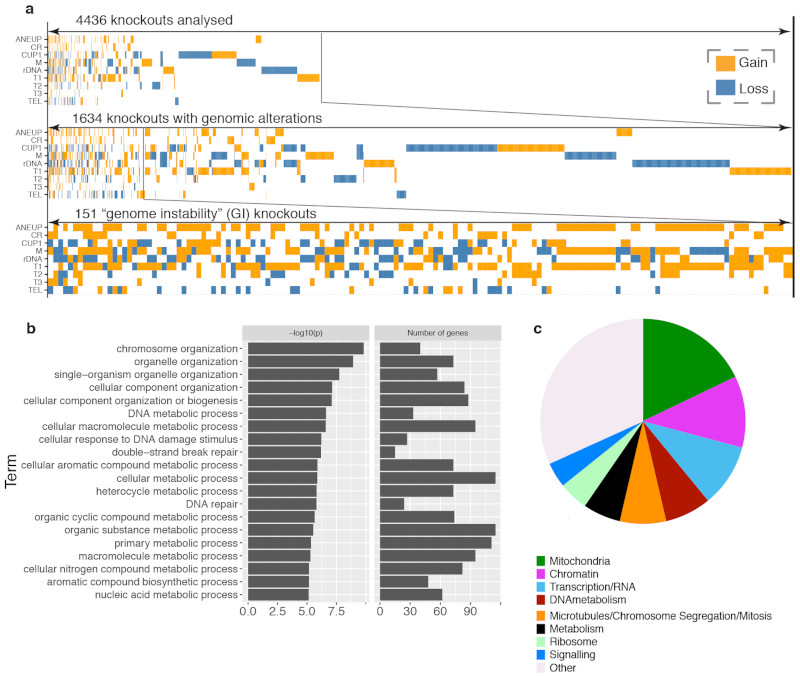
Our systematic survey of genomic and karyotypic features highlights impacts of gene knockouts on genome architecture and underscores the flexibility of the yeast genome to mitigate effects of gene loss. Overall, ~36% of YKOC strains carry some repetitive DNA/chromosomal abnormality; and among these, loss of 151 genes is associated with multiple alterations, suggesting that their gene-products protect against widespread genome instability (Extended Data Fig. 10a). While gene-ontology analysis revealed strong enrichments for genome biology (Extended Data Fig. 10b), the largest fraction of these genes encodes proteins controlling mitochondrial functions (Extended Data Fig. 10c). Further work is required to understand these connections and how nuclear and mitochondrial genome maintenance is intertwined. Crucially, our results highlight repetitive-DNA alterations as new types of mutation signatures, in addition to SNVs first identified in cancers39.It will be interesting to integrate this resource with data from future studies assessing propagated lineages of knockout strains, not only for repetitive-element numbers, but also their variability, and determine whether and how repetitive-element instability might relate to other types of genome instability. Sequencing genomes of strains bearing hypomorphic alleles of essential genes and of synthetic-sick double-mutants40 should also provide insights into processes impacting genomic stability. Such work may have medical relevance because, together with SNVs and INDELs, copy-number variations and aneuploidies are linked to developmental disorders, cancer and other diseases.
Methods
Duplication of the YKOC and colony isolation
The homozygous diploid YKOC was acquired from EUROSCARF in 2001, propagated for two batch expansions (10-20 cell generations) in liquid CSM (complete synthetic medium; 0.14% YNB, 0.5% ammonium sulphate, 0.077% complete supplement mixture [ForMedium], 2% (w/v) glucose and pH buffered to pH 5.8 with 1% (w/v) succinic acid) before being stored in 20% glycerol at –80°C for 13 years. A further duplication was made by thawing one copy of the collection and pinning it into new 96-well plates with CSM using a RoToR HDA robot (Singer Instruments Ltd). Inoculated plates were incubated at 30°C for three days and glycerol was added to a 25% final concentration before freezing at -80°C. From each well, single colonies were isolated on YPAD medium and grown for 2–8 days at 30°C. Two colonies per knockout were inoculated in 1.8ml YPAD and grown to saturation for 2–5 days, before collecting by centrifugation. Other strains and plasmids used in this work are described in Supplementary Table 5.
Genomic DNA extractions, library preparations and sequencing
Genomic DNA extractions and library preparations were carried out as previously described41. DNA from up to 96 colonies was multiplexed in each sequencing lane. Sequencing of the YKOC was carried out on Illumina HiSeqX machines. All other sequencing was carried out on Illumina HiSeqX or HiSeq2500 platforms.
Sequencing read alignment
Sequencing reads were aligned to the yeast reference genome (S288c_R64-1-1_Ensembl) using bwa mem with the following options: -t 16 -p -T 0; duplicates were marked with bamstreamingmarkduplicates (biobambam2 2.0.50).
Gene knockout validation
For each sequenced DNA sample (corresponding to one isolated colony), sequencing coverage across the ORF expected to be deleted in that sample was computed. An ORF coverage <15% of the relevant chromosome-wide median (CWM) was deemed to indicate full gene deletion. We noticed that some knockout strains (made by different laboratories) were not deleted for the entire ORF, but rather of a region of varying dimensions within the ORF itself, usually disrupting the start codon and likely producing ORF inactivation. To account for this, ORFs failing the previous criteria were evaluated for the presence of at least 9 consecutive bases with coverage <5% of the CWM. Samples matching these criteria are indicated as “partial deletions”. In each sample, UP and DN barcodes were read from reads matching, in normal and in reverse complement directions, the patterns /U1[ACGT]+U2/ and /D1[ACGT]+D2/ respectively. U1, U2, D1, D2 are the relevant unique flanking sequences (U1: GATGTCCACGAGGTCTCT; U2: CGTACGCTGCAGGTCGAC; D1: CGGTGTCGGTCTCGTAG; D2: ATCGATGAATTCGAGCTCG). For each sample the frequency of barcodes, observed at least 5 times and for a frequency > 20%, is reported in Supplementary Table 6, and noted if it does not match with the expected.
Gene knockout re-assignment
Any sample not carrying the expected deletion was reassigned to the correct knockout strain using information encoded in the unique barcodes, when possible. Samples re-assigned in this way were subsequently validated again for the presence of the deletion as described in the previous paragraph before any further work.
Development and validation of tools to study repetitive DNA instability
To study repetitive regions, we developed tools to measure copy-number variation from sequencing data, based on the concept that the number of sequencing reads generated by a certain locus is proportional to its copy number. This produces an apparent coverage increase which can be used for copy number estimation (Extended Data Fig. 2a). A strong correlation between rDNA copy-number measures derived from WGS and from gel electrophoresis indicates that WGS-based methods are at least as accurate as traditional methods, and re-sequencing the same DNA preparations revealed highly consistent measures (Extended Data Fig. 2b-c). This approach was employed to determine copy numbers of the repetitive CUP1 locus, the five yeast transposon (Ty1–Ty5) and the 2μ plasmid (Extended Data Fig. 1a). To extract information on telomere length, we measured the abundance of sequencing reads arising from telomeric DNA and demonstrated the ability of this method to detect biologically relevant differences by sequencing strains with normal, short or long telomeres (wild-type, tel1Δ and rif1Δ) and observing the expected telomere-length differences (Extended Data Fig. 1d-e). We determined the variability of these measures in a wild-type context by sequencing single colonies from two widely used genetic backgrounds. In addition to differences in the number of some Ty elements, this analysis revealed that compared to BY4743, W303 strains carry a larger rDNA locus, and a shorter CUP1 array, consisting of 4 repeats only. This last number was confirmed using long-read sequencing and identifying one read spanning the CUP1 locus and containing the expected 4 repeats (Extended Data Fig. 1f-g).
Quantification of rDNA and CUP1 repeat copy number
Quantification of rDNA and CUP1 copy-number was carried out using the S288C genome as a reference. Copy-number estimates were obtained by dividing the median coverage across the appropriate genomic region (rDNA: XII:452000-459000; CUP1: VIII:212986-213525) by the genome-wide median coverage and multiplying by 2 (this is because the S288C reference genome contains two copies of the minimal repeat unit).
Oxford Nanopore Technology (ONT) library preparation and sequencing
Yeast genomic DNA was prepared by using standard molecular biology techniques (spheroplasting, SDS lysis, K acetate precipitation, RNAse A digestion) without phenol/chloroform extraction. A sequencing library was prepared from purified gDNA with the rapid sequencing kit (SQK-RAD004, ONT) and following the manufacturer’s instructions. Sequencing data were acquired with MinKNOW 1.15.6 with live base-calling, and reads were aligned to the yeast reference genome with minimap2 (2.14-r883)42. Long reads aligning in the region of interest (VIII:213000-215000) were extracted and graphically aligned to the reference genome using FlexiDot43.
Quantification of Ty1–Ty5, 2μ and definition of genetic mating type
An artificial reference genome was constructed in which each “chromosome” contained the following genomic regions:
YDRWTy1-5= IV: 1203704-1215621;
YLRWTy2-1= XII: 938192-950150;
YILWTy3-1= IX: 202220-213647;
YHLWTy4-1= VIII: 82539-94761;
YCLWTy5-1= III: 679-7322;
MATa_HMR= III: 292388-295034;
MATalpha_HML= III: 11146- 14849;
2-micron= J01347.1.
Sequencing reads, extracted from bam files, were re-aligned to this reference genome using bwa mem with the following options: -t 16 -T 0; duplicates were marked with bamsormadup (biobambam2 2.0.87) with the following options: threads=16 SO=coordinate level=0 verbose=0 fixmate=1 adddupmarksupport=1; median coverage was calculated across the following regions and normalized by the genome wide median to obtain the copy number estimate (in number of copies per haploid genome; in the case of the 2-micron plasmid these estimates were multiplied by the expected ploidy to obtain the number of copies per cell; see also quantification of mtDNA copy number).
YDRWTy1-5: 4000-6999;
YLRWTy2-1: 4000-6999;
YILWTy3-1: 4000-6999;
YHLWTy4-1: 4000-6999;
YCLWTy5-1: 2000-2999;
MATa_HMR: 1400-2000;
MATalpha_HML: 1700-2700;
2-micron: 2000-4500;
Quantification of telomere length
Telomeric sequences were identified as reads containing a minimum number of instances of the following degenerate repeat unit (regex pattern: /(TG){1,3}TG{2,3}|C{2,3}A(CA){1,3}/44). A synthetic measure of telomere length was obtained by counting the number of telomeric reads in both orientations/read pairs and normalizing by the total number of reads. The best minimum required number of repeat units in a read was determined by testing every possibility between 1 and 20 and choosing the one (5 repeats) that maximised the difference between wild-type, tel1Δ and rif1Δ strains (Extended Data Figure 1d).
Southern blot telomere length analysis
A logistic regression model was used to prioritize strains with the longest and shortest telomeres. DNA was extracted and telomeric Southern blots were carried out as previously described45.
Quantification of chromosome aneuploidy
Chromosome ploidy was obtained by estimating the copy number of the centromere of each chromosome. This was obtained by dividing the coverage across a 10 kb window centred on the centromere by the genome-wide median and multiplying by 2 (assuming a largely diploid samples). Ploidy estimates <0.2 and >0.8 units were rounded to the closest unit (see next paragraph for details about how these thresholds were calculated); all others were maintained as rational numbers. Plots were obtained using Circos46 and masking all repetitive regions. Settings to reproduce these graphs are available in the software repository.
Determination of thresholds for “normal” ploidy
Analysis of centromere copy number for 255 diploid centromeres from wild type BY4743 strains (16 colonies, 16 centromeres/colony, excluding one triploid chromosome) revealed that virtually all estimates were between the values of 1.8 and 2.2. Statistical analysis indicates that by defining the ploidy of a centromere as altered when this is <1.8 or >2.2 incurs in a ~ 0.07% chance of false positive (type I error, p=0.000704, two tailed z-test). We define a strain as deviating from diploidy when any of the 16 chromosomes deviates from diploidy; this corresponds to a ~1.1% chance of wrongly defining a diploid strain as deviating from diploidy when it is not.
Quantification of chromosome instability
CIN rates were measured by the quantitative chromosome transmission fidelity (qCTF) assays20. To generate strains for measurement, deletion cassettes were amplified from the Yeast Knockout MATa Collection with primers annealing 400 bp up- and down-stream of the KanMX4 module, and then transformed into the qCTF strain (RLY8492) with the Frozen-EZ Yeast Transformation II Kit (Zymo; Catalog number T2001). qCTF assays were performed as described previously with minor adjustments: cells were not sonicated and were analyzed on an Attune™ NxT Acoustic Focusing Cytometer with Autosampler (Thermo; Catalog number A24861).
Quantification of chromosomal rearrangements
To determine the number and positions of chromosomal rearrangements (regions with ploidy differing from the ploidy of the chromosome at the centromere), we proceeded in two steps. First, we determined the average ploidy across the chromosome using 400 bp bins and noted regions in which ploidy was largely different from the ploidy of the chromosome (difference >0.4 units) and largely similar to the ploidy of the previous data point (difference <0.8 units). Second, we merged all regions where the end of one abnormal ploidy region was less than 20 kb from the beginning the next one and the ploidy of the two regions was similar (difference <0.8 units; this step is necessary to avoid one single rearrangement being split by a masked region within itself: the largest masked regions in the reference genome correspond to two consecutive transposons (20 kb). Finally, the number of rearrangements was calculated by counting the number of regions with abnormal ploidy (greater than [centromere ploidy + 0.5] or smaller than [centromere ploidy – 0.5]) larger than 20 kb. These data were also used to determine the position of the breakpoints of each rearrangement.
Mapping of breakpoints of chromosomal rearrangements
Observation of random breakpoint positions suggested these might be localised to transposons. To assess this, breakpoint positions were compared with positions of known transposons, LTRs, rDNA and sub-telomeric regions (<15 kb from chromosome end). A breakpoint was assigned one or more of the relevant categories if it mapped within 10 kb of any of these features. The list was simplified by removing redundant categories (i.e. when a breakpoint mapped to both a “transposon” and “LTR” it was just considered as a “transposon” since transposons also have nearby LTRs, but LTRs do not necessarily have a nearby transposon).
Quantification of mtDNA copy number
Mitochondrial DNA copy number was determined using the S288C genome as reference. Copy number estimates were obtained by dividing the median coverage across a region of the COX1 gene (Mito:14000-20000) by the genome-wide median and multiplying by the expected ploidy of the sample (haploid = 1; diploid = 2; this is because the same median coverage reflects different copy numbers in haploid and diploid samples). COX1 was chosen primarily because it represents the largest continuous stretch of DNA in which the sequencing coverage is stable (Extended Data Fig. 5a). Coverage instability most likely resulted from increased DNA breakage in AT-rich regions of the mitochondrial genome during DNA purification and/or preparation of sequencing libraries (Extended Data Fig. 5b). An independent estimate using a much smaller stable region corresponding to part of the COX3 gene (Mito:79213-80022) yielded similar results (Extended Data Fig. 5c). rho0 colonies were defined as having less than 1 mtDNA copy.
Correction of batch effects
To correct for batch effects caused by different library preparations and sequencing runs, we calculated for every genomic feature (rDNA, CUP1, Ty1-5, mtDNA, 2μ or telomeres) and for each sequencing run/lane the median of the copy-number estimates of the ~80-96 strains sequenced in that lane. All the estimates in each lane were then normalized by a factor obtained by dividing the median of that lane by the median of the lane containing, among other strains, the 8 wild-type samples.
rDNA and CUP1 copy number correction
Copy number of CUP1 and rDNA was corrected for the observed ploidy of chromosome VIII and XII respectively, multiplying the raw copy number value by the ratio between the expected and observed ploidy of the relevant chromosome.
Correlation study between CUP1 and rDNA
After correction the values for CUP1 and rDNA were scaled to have a mean = 0 and SD = 1. The correlation (C) for each deletion strain (with n different samples) was calculated as the mean of the product of CUP1 (Xi) and rDNA (Yi) normalized values, with a further penalisation so that:
where di is the Euclidean distance between the vector (Xi,Yi)and the |X|=|Y|diagonal. This factor introduces an exponential decay on the final correlation value when the CUP1 and rDNA values are very different from each other, controlling the cases where only one of the two elements shows extreme values.
mtDNA quantification by qPCR and comparison with WGS data
Genomic DNA obtained as described above was analyzed by qPCR using Fast SYBR™ Green Master Mix (Thermo; Catalog number 4385612). Relative mtDNA levels were determined by normalization to genomic DNA. Primers used were:
| gDNA (GAL1) | Up: TGCTTTGTCAAATGGATCATATGG |
| Low: CCTGGAACCAAGTGAACAGTACAA | |
| mtDNA | Up: CACCACTAATTGAAAACCTGTCTG |
| Low: GATTTATCGTATGCTCATTTCCAA |
For comparison purposes, estimation of mtDNA copy number from WGS data was also carried out using the following genomic regions corresponding to qPCR amplicons:
| Mito:25574-25686 | for mtDNA |
| II:280382-280459 | for GAL1 (qPCR control, instead of genomewide median) |
DNA damage treatments
Wild-type cells were inoculated in 1.8 ml cultures and grown overnight to saturation in YPD. The following day (day 1), 10 μl of each culture was used to inoculate new mini-cultures in YPD or YPD supplemented with DNA damage inducing drugs (MMS: 0.01%; CPT: 20μM; HU: 100 mM). Remaining cells were harvested and frozen. The same was repeated for the following days. DNA extractions were carried out in parallel at the end of the experiment.
Quantification of RNR expression
Relevant strains were grown to exponential phase. Hot phenol extraction method was used to isolate total RNA. Quantity and purity were analyzed using a NanoDrop 1000. 10μg of total RNA were treated with TURBO DNAse (Invitrogen; Catalog number AM2238). RNA was purified using RNA Clean & Concentrator Kit (Zymo; Catalog number R1016). cDNA was then prepared using Superscript III reverse transcriptase (Invitrogen; Catalog number 18080). The expression level of individual transcripts was determined by qPCR using Fast SYBR™ Green Master Mix (Thermo; Catalog number 4385612). Relative levels were determined by normalization to the ACT1 mRNA in each sample. Primers used were:
| RNR1 | Up: GCTCTATATACCCGCTACGAGAAA |
| Low: TCCTTGTAAACAACGAAAGGTGTA | |
| RNR2 | Up: TATCCATGACTGGAACAACAGAAT |
| Low: GTGGAGAAGTTTTCAACCAAGTTT | |
| RNR3 | Up: AGGTCGTGGTAAAACAATTAAAGC |
| Low: TGTTGGTTTGTCTTCCTGTTACAT | |
| RNR4 | Up: GGTAACTTGTTAGCCTTGTCCATT |
| Low: CATAATCTGGAACCCGTAGAAACT | |
| ACT1 | Up: GAAATGCAAACCGCTGCTCA |
| Low: TACCGGCAGATTCCAAACCC |
RNR overexpression experiments
Yeast strains carrying genes encoding for ribonucleotide reductase subunits (RNR1, RNR2, RNR3, RNR4) under the control of the GAL1-10 promoter were grown at 30°C overnight in YPAD in 96-well plate format (deep well, 1.8 ml culture). Cells were then pelleted, resuspended in fresh YPA + 2% raffinose, diluted 1:20 in a new well, and incubated overnight. The following day, cells were diluted 1:20 in a new well in either YPA + 2% raffinose or YPA + 2% raffinose + 2% galactose. The same procedure was repeated on the following days. For each set of wells, samples for DNA extraction and sequencing were collected ~48hrs after inoculation.
Analysis of SNVs and INDELs
Mutation calling was performed against the EF4.69 revision of the yeast genome with samtools mpileup with the following options -g -t DP,DV -C0 -pm3 -F0.2 -d10000 and bcftools call with the following options -vm -f GQ; mutations were initially filtered using vcftools with the following options: -H -f +/d=15/q=25/SnpGap=7 and mutations present in the wild-type BY4743 strains were removed with bedtools intersect using all the wild-type samples as reference. Mutations were subsequently filtered with vcftools excluding variants with genotype quality (GQ) <91; mapping quality (MQ) <30; or depth (DP) <10. Prediction of the effects of variant was carried out using the Ensembl variant effect predictor47 as previously described41.
Extended Data
Extended Data Figure 1. Statistics of YKOC analyses and distribution of repetitive DNA estimates across the YKOC.
(a) Colonies that did not carry the expected deletion (red) were reassigned by reading the barcode inserted with the deletion marker; deletion of an alternative gene was then confirmed by loss of sequencing coverage. (b) Number of strains proceeding through the steps of the pipeline for data generation, and analysis used to create the dataset on which this work is based. (c) Distribution of copy-number estimates for the indicated repeats across the YKOC. Strains are sorted by the average across the colonies sequenced, and the estimate of each colony is shown; red zones represent values >3 standard deviations of the wild-type distribution (n=8 biological independent samples for wild-type strains; n=1 biological sample for 258 KO strains; n=2 biologically independent samples for 4093 KO strains; n=3 biologically independent samples for 30 KO strains; n=4 biologically independent samples for 72 KO strains; n=5 biologically independent samples for 1 KO strain). (d) Correlations between relative copy-number changes at rDNA and CUP1 tandem-repeat loci; average correlations in all colonies of each KO strain are shown.(n=8 biological independent samples for wild-type strains; n=1 biological sample for 258 KO strains; n=2 biologically independent samples for 4093 KO strains; n=3 biologically independent samples for 30 KO strains; n=4 biologically independent samples for 72 KO strains; n=5 biologically independent samples for 1 KO strain). (e) No overall correlation for rDNA and CUP1 copy-number estimates across all colonies sequenced. (f) Distribution of copy-number estimates for the 2μ plasmid across the YKOC and gene ontology analysis of the hits. 2μ copy numbers did not follow a normal distribution with the maximum standard deviation increasing linearly with the mean copy number; this is consistent with the mode of 2μ amplification, which is activated by expression of the in cis gene FLP1 when the copy number crosses a lower threshold (we estimate this at 20-25 copies); different durations of FLP1 expression will result in different copy number increases. Also in line with this amplification mechanism, we detected an enrichment in gene-knockouts connected to gene silencing is strains with high 2μ copy number.
Extended Data Figure 2. Development of tools to study repetitive DNA instability.
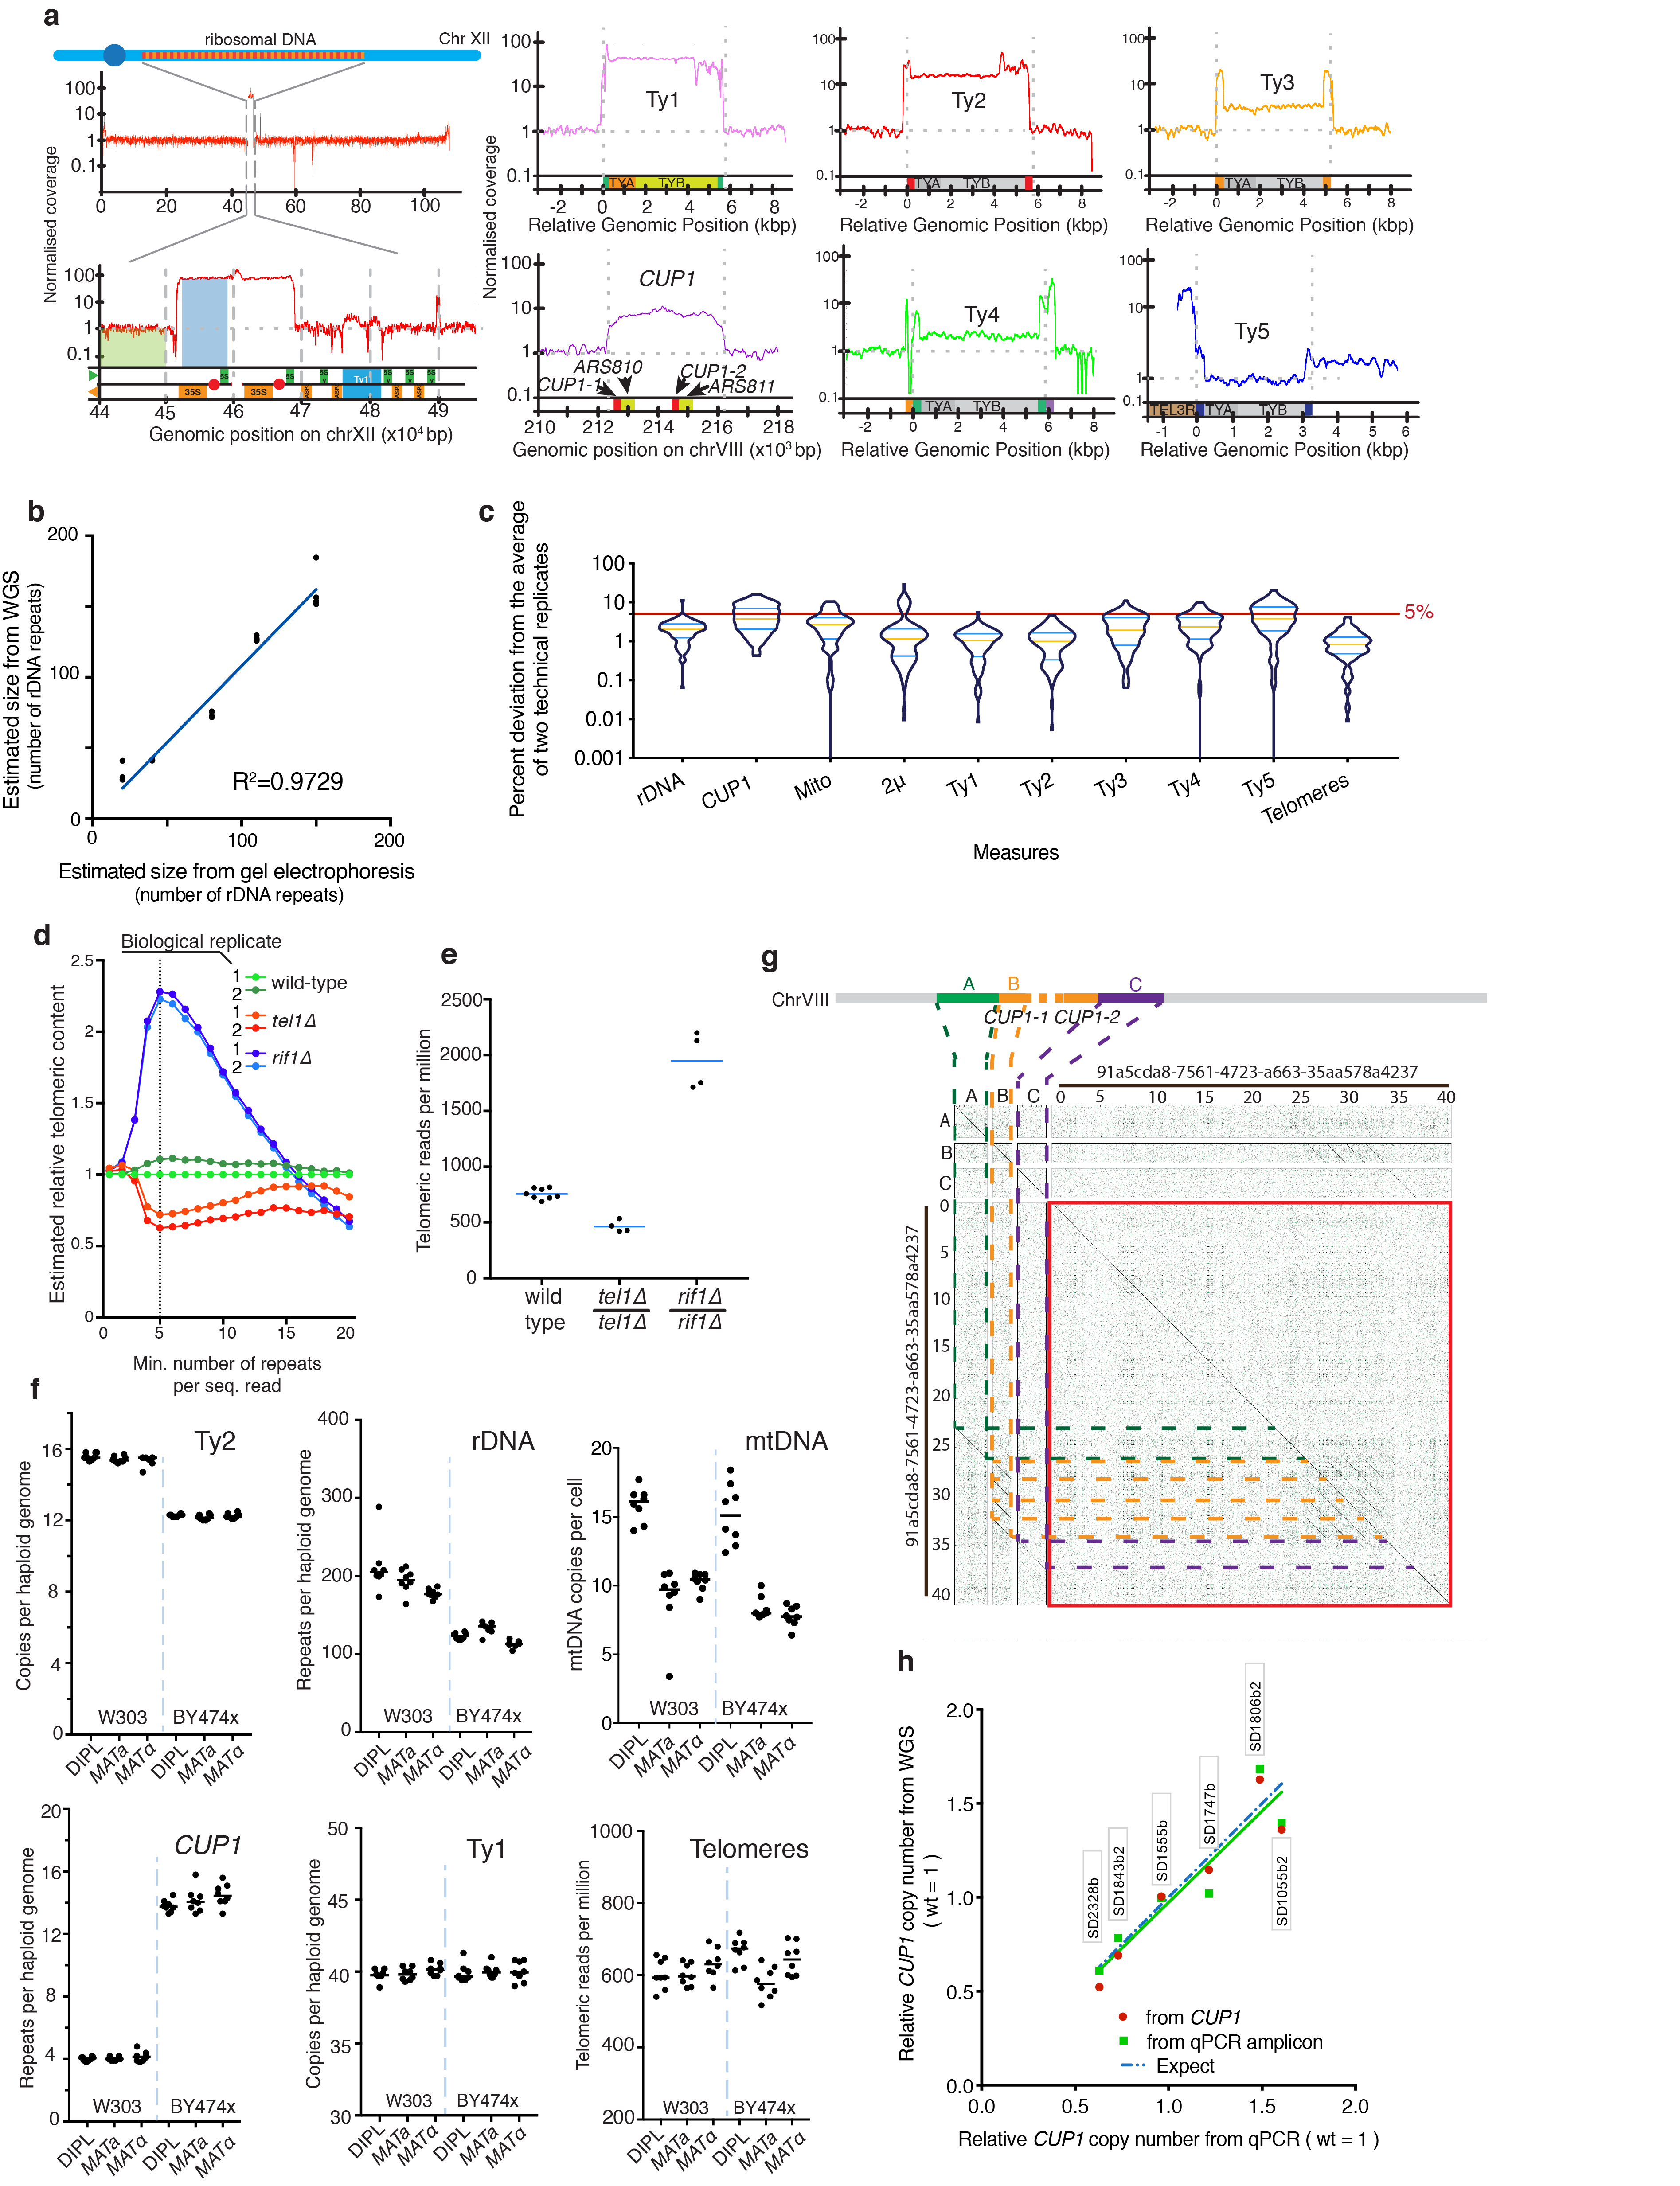
(a) Left: schematic of yeast chromosome XII. The apparent increase in sequencing coverage maps to rDNA repeats. Right: similar apparent coverage increases mapped to CUP1 and Ty transposon loci. (b) Whole-genome sequencing (WGS) estimates of rDNA-repeat copy number linearly correlate with estimates obtained by pulsed-field gel electrophoresis (n=3-4 biologically independent samples per strain). (c) Percent deviation of two sequencing technical replicates from their average (n=2 technical replicates derived from n=89 biologically independent samples; median: yellow line; quartiles: blue line). measurements were within 5% of their average. Notable exceptions were Ty5 and CUP1, probably due to their relatively low repeat numbers. (d) Relative estimated content of telomeric repeats in indicated strains, normalized to estimated content of one wild-type colony, is plotted as a function of the minimum number of telomeric repeats in a sequencing read required to classify that read as telomeric (n=2 biologically independent samples per strain). (e) Telomere length estimations for wild-type, tel1Δ and rif1Δ strains obtained calculating the relative abundance of telomeric reads (mean from n=4-8 biologically independent samples per strain). (f) Estimations of rDNA, CUP1, Ty1, Ty2, and mtDNA copy numbers, and telomeric DNA content for MATa, MATα and diploid strains in W303 and BY4743 backgrounds (median from n=8 biologically independent samples per strain). (g) A long read spanning the CUP1 locus derived from ONT (Oxford nanopore) sequencing of a W303 (K699) genomic library. (h) Comparison of CUP1 copy number estimated by qPCR or WGS; the same DNA samples (as indicated in labels) were analyzed. Two estimates were extracted from WGS data: “from CUP1” indicates estimation using a large region of the CUP1 locus and the genome-wide median for reference (the same method used for the entire YKOC); “from qPCR amplicon” indicates a small region of CUP1 and a small region of GAL1 for reference (the same regions used for qPCR).
Extended Data Figure 3. Southern blot analysis and functional connections between TLM genes.
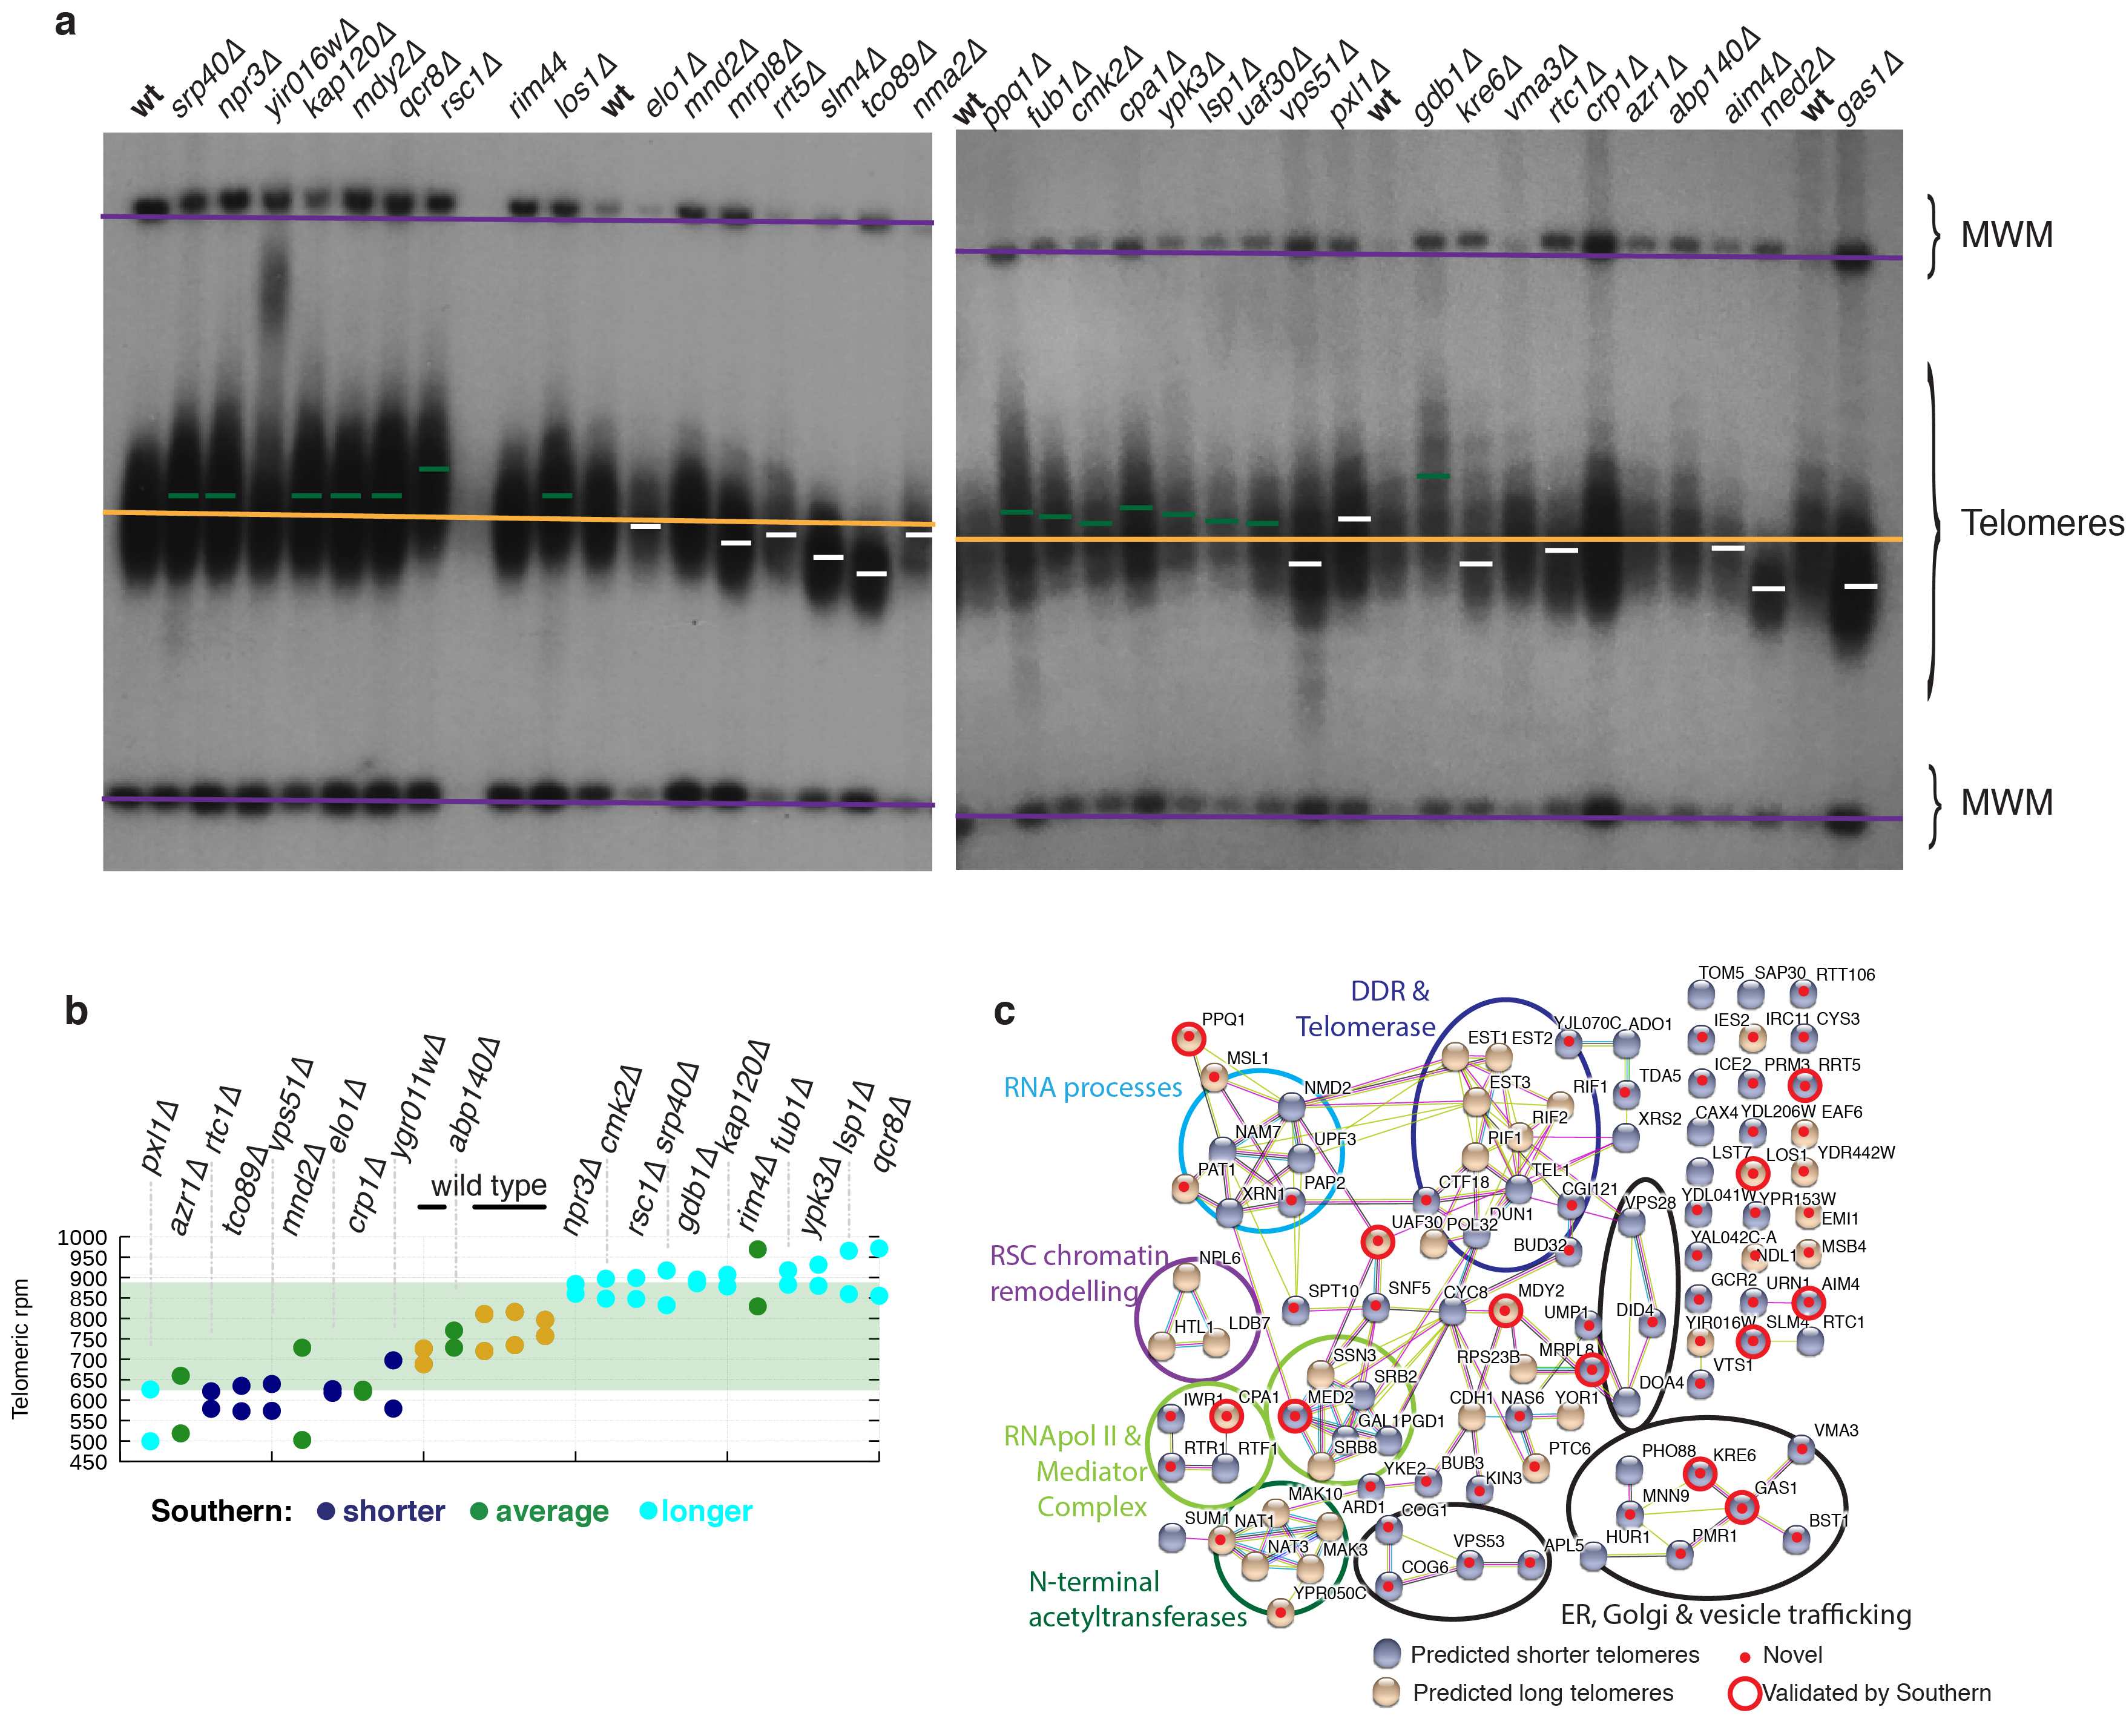
(a) Gel electrophoresis and Southern blot analysis of telomeres for 14 novel predicted TLML strains (hits = strains with two or more colonies with measures >3 times the SD of the wild-type distribution) and 21 strains failing such stringent hit-selection criteria (non–hits) but still displaying relatively high or low telomere length estimates (representative images from two independent experiments).. Purple lines: location of molecular weight markers; orange line: average telomere length for wild-type samples; green dashes: average telomere lengths for strains predicted to have longer telomeres; white dashes: average telomere lengths for strains predicted to have shorter telomeres (b) Validation of KOs failing TLM selection criteria but still displaying high or low telomere counts. (c) Network-graph analysis of KOs affecting telomere length highlighting novel genes validated by Southern blotting.
Extended Data Figure 4. Examples of aneuploidies and chromosomal rearrangements in the YKOC.
(a) Example of a strain with fractional aneuploidy of chromosome XII, likely reflecting clonal heterogeneity. (b) Distribution of fractional and non-fractional aneuploidies per chromosome (n=8843 biologically independent samples). (c) Knockout of genes encoding ribosomal protein subunits frequently leads to gain of the chromosome carrying the paralog gene. (d) Ploidy plots of chromosome II for two different colonies of the hta1Δ, swi4Δ, and spt10Δ KO strains: hta1Δ cells (deleted in one of the two genes encoding histone H2A) accumulate a specific amplification of a genome region containing the paralog HTA2, a centromere, and two origins of replication). This is most likely transmitted as a circular genetic element formed by recombination between two adjacent transposon sequences. Only two other YKOC strains were found to carry the same genetic element and these were spt10Δ and swi4Δ, encoding factors controlling the transcription of cell-cycle regulated genes, including histones.
Extended Data Figure 5. Calculation of mtDNA copy number.
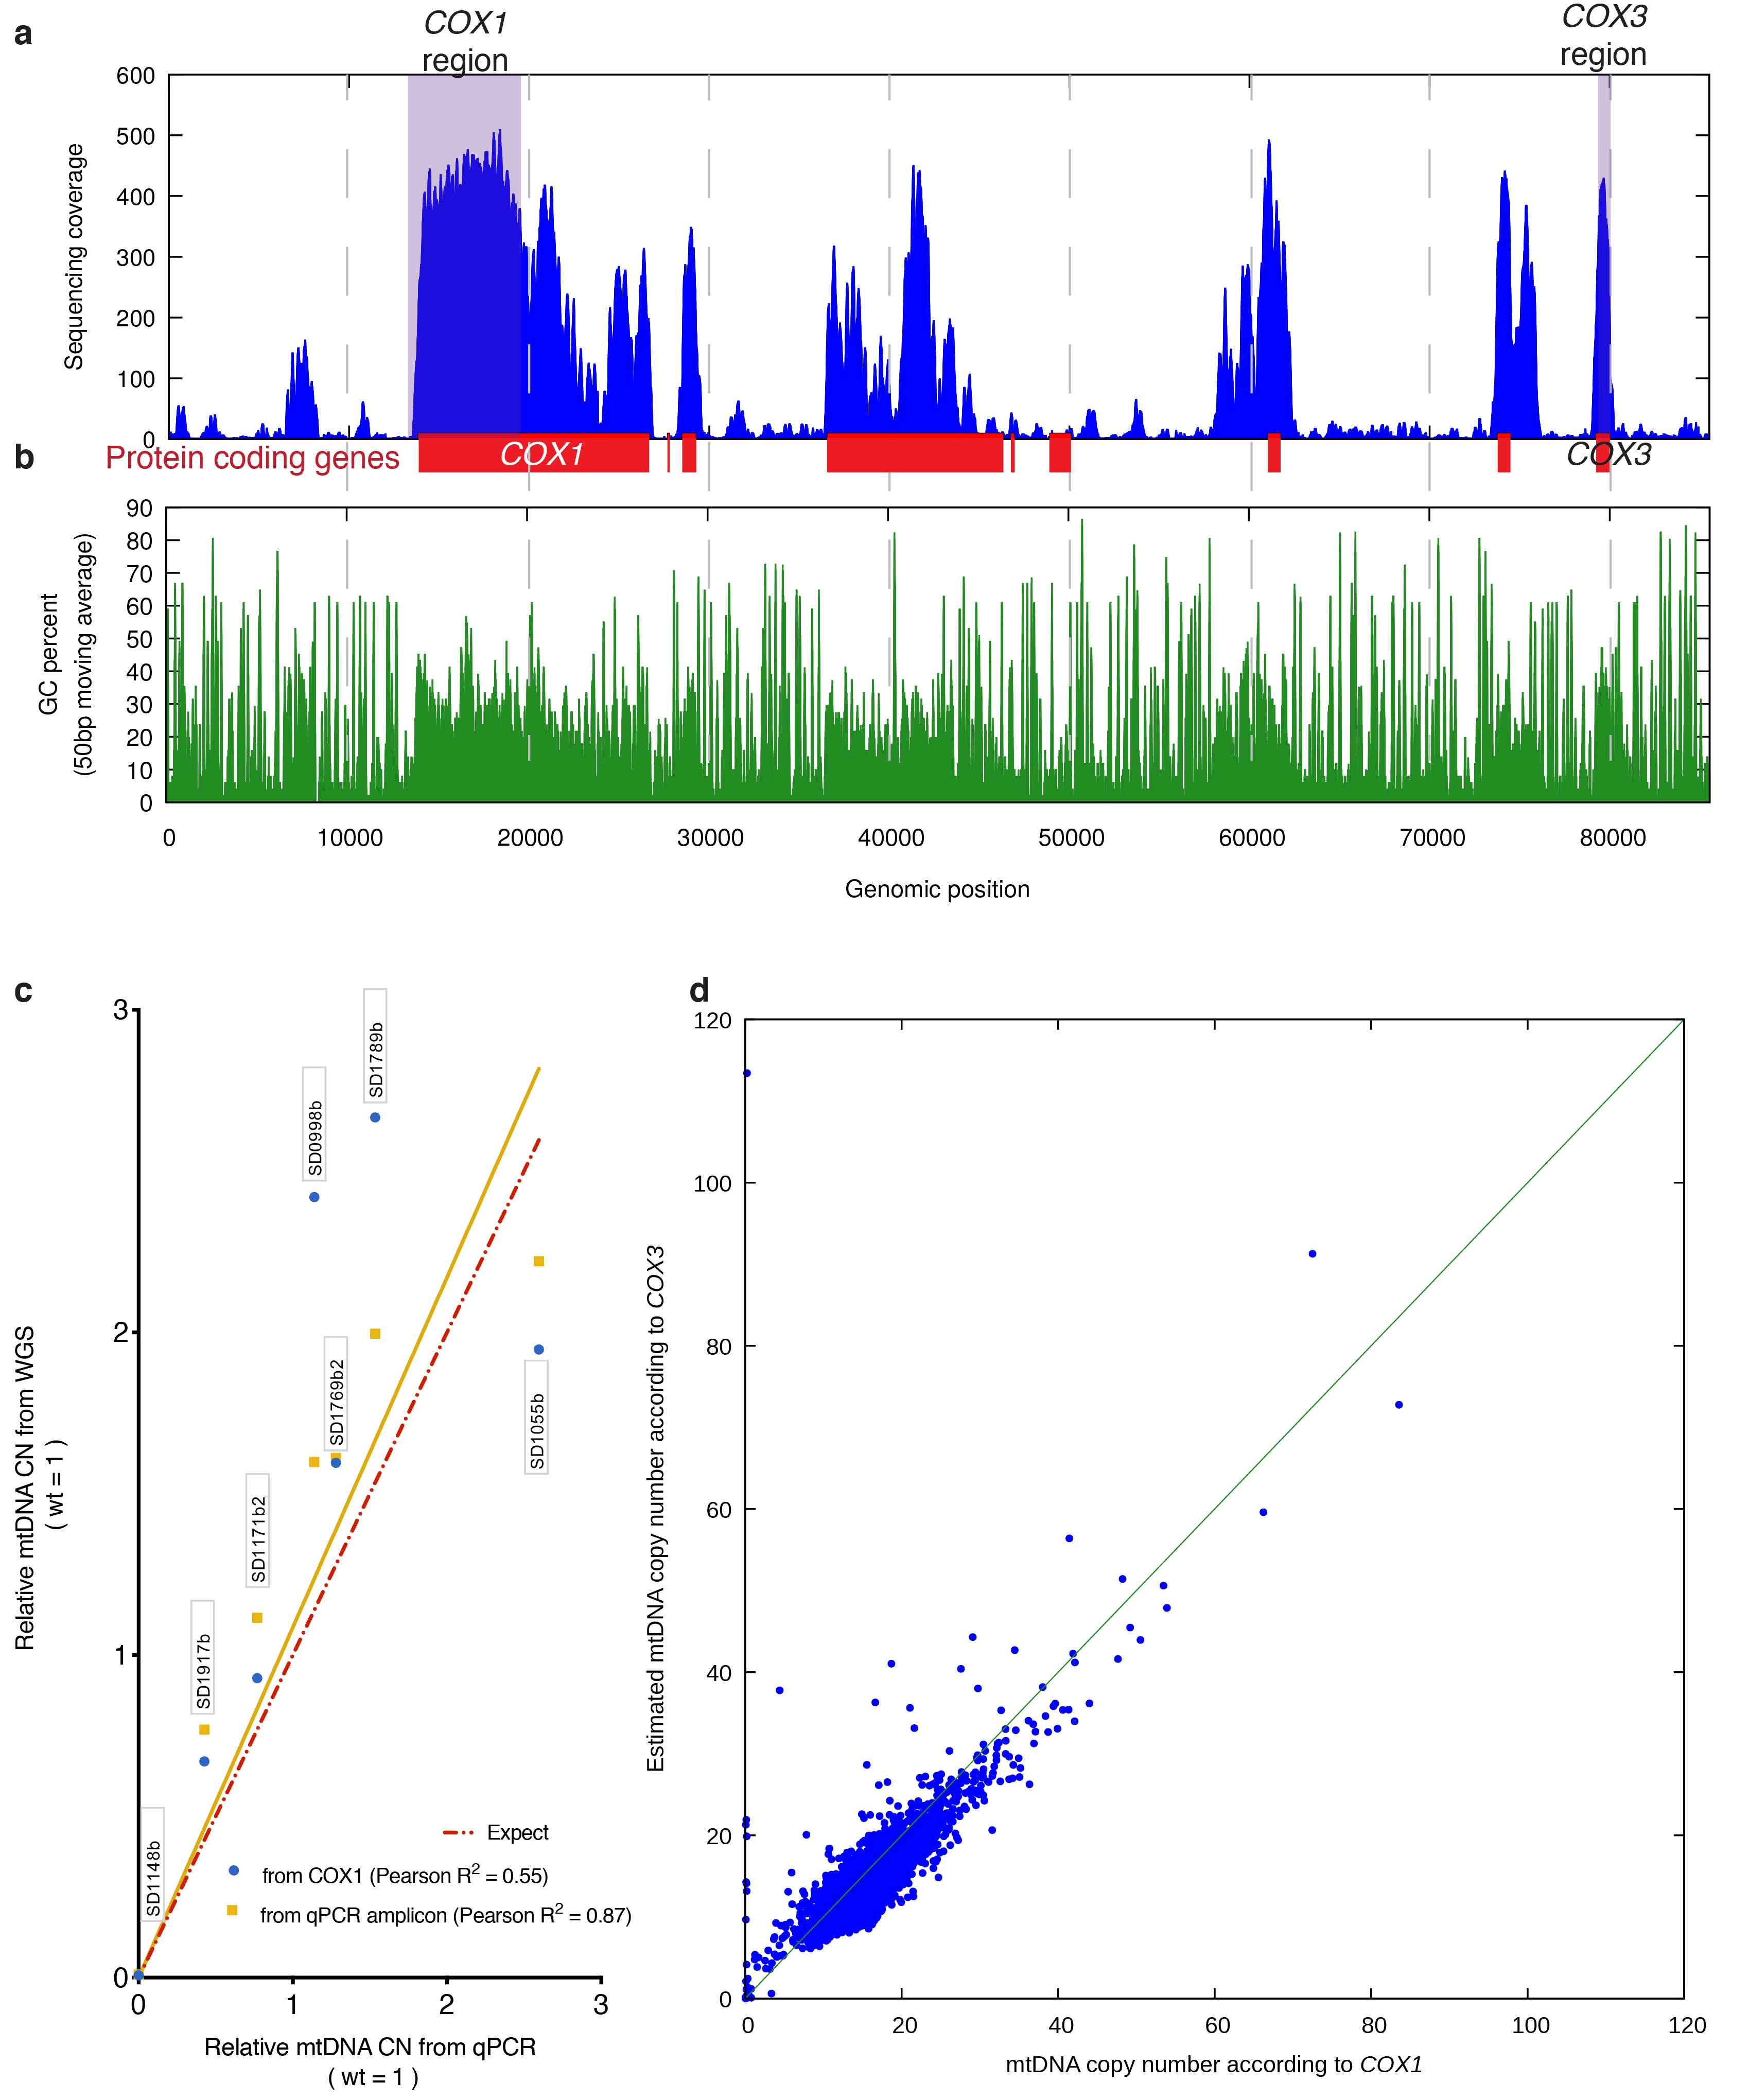
(a) Sequencing coverage across the mitochondrial genome of a wild-type haploid (BY4741; accession ERS616991). Shaded areas indicate regions (loosely corresponding to COX1 and COX3 genes) used to estimate total mtDNA content. (b) mtDNA regions of low sequence coverage correspond to regions with strongly reduced GC content. (c) Comparison of mtDNA content estimated by qPCR and by WGS. The same DNA samples (as indicated by labels) were analyzed by qPCR and WGS. Two estimates were extracted from WGS data: “from COX1” indicates estimation using a large region of the COX1 gene and the genome-wide median for reference (the same method used for the entire YKOC); “from qPCR amplicon” indicates a small region of COX1 and a small region of GAL1 for reference (the same regions used for qPCR). (d) Correlation between estimates of mtDNA content using COX1 or COX3 region on all sequenced strains belonging to the YKOC (Pearson R2=0.7596).
Extended Data Figure 6. Connections between mtDNA and nuclear genome alterations.
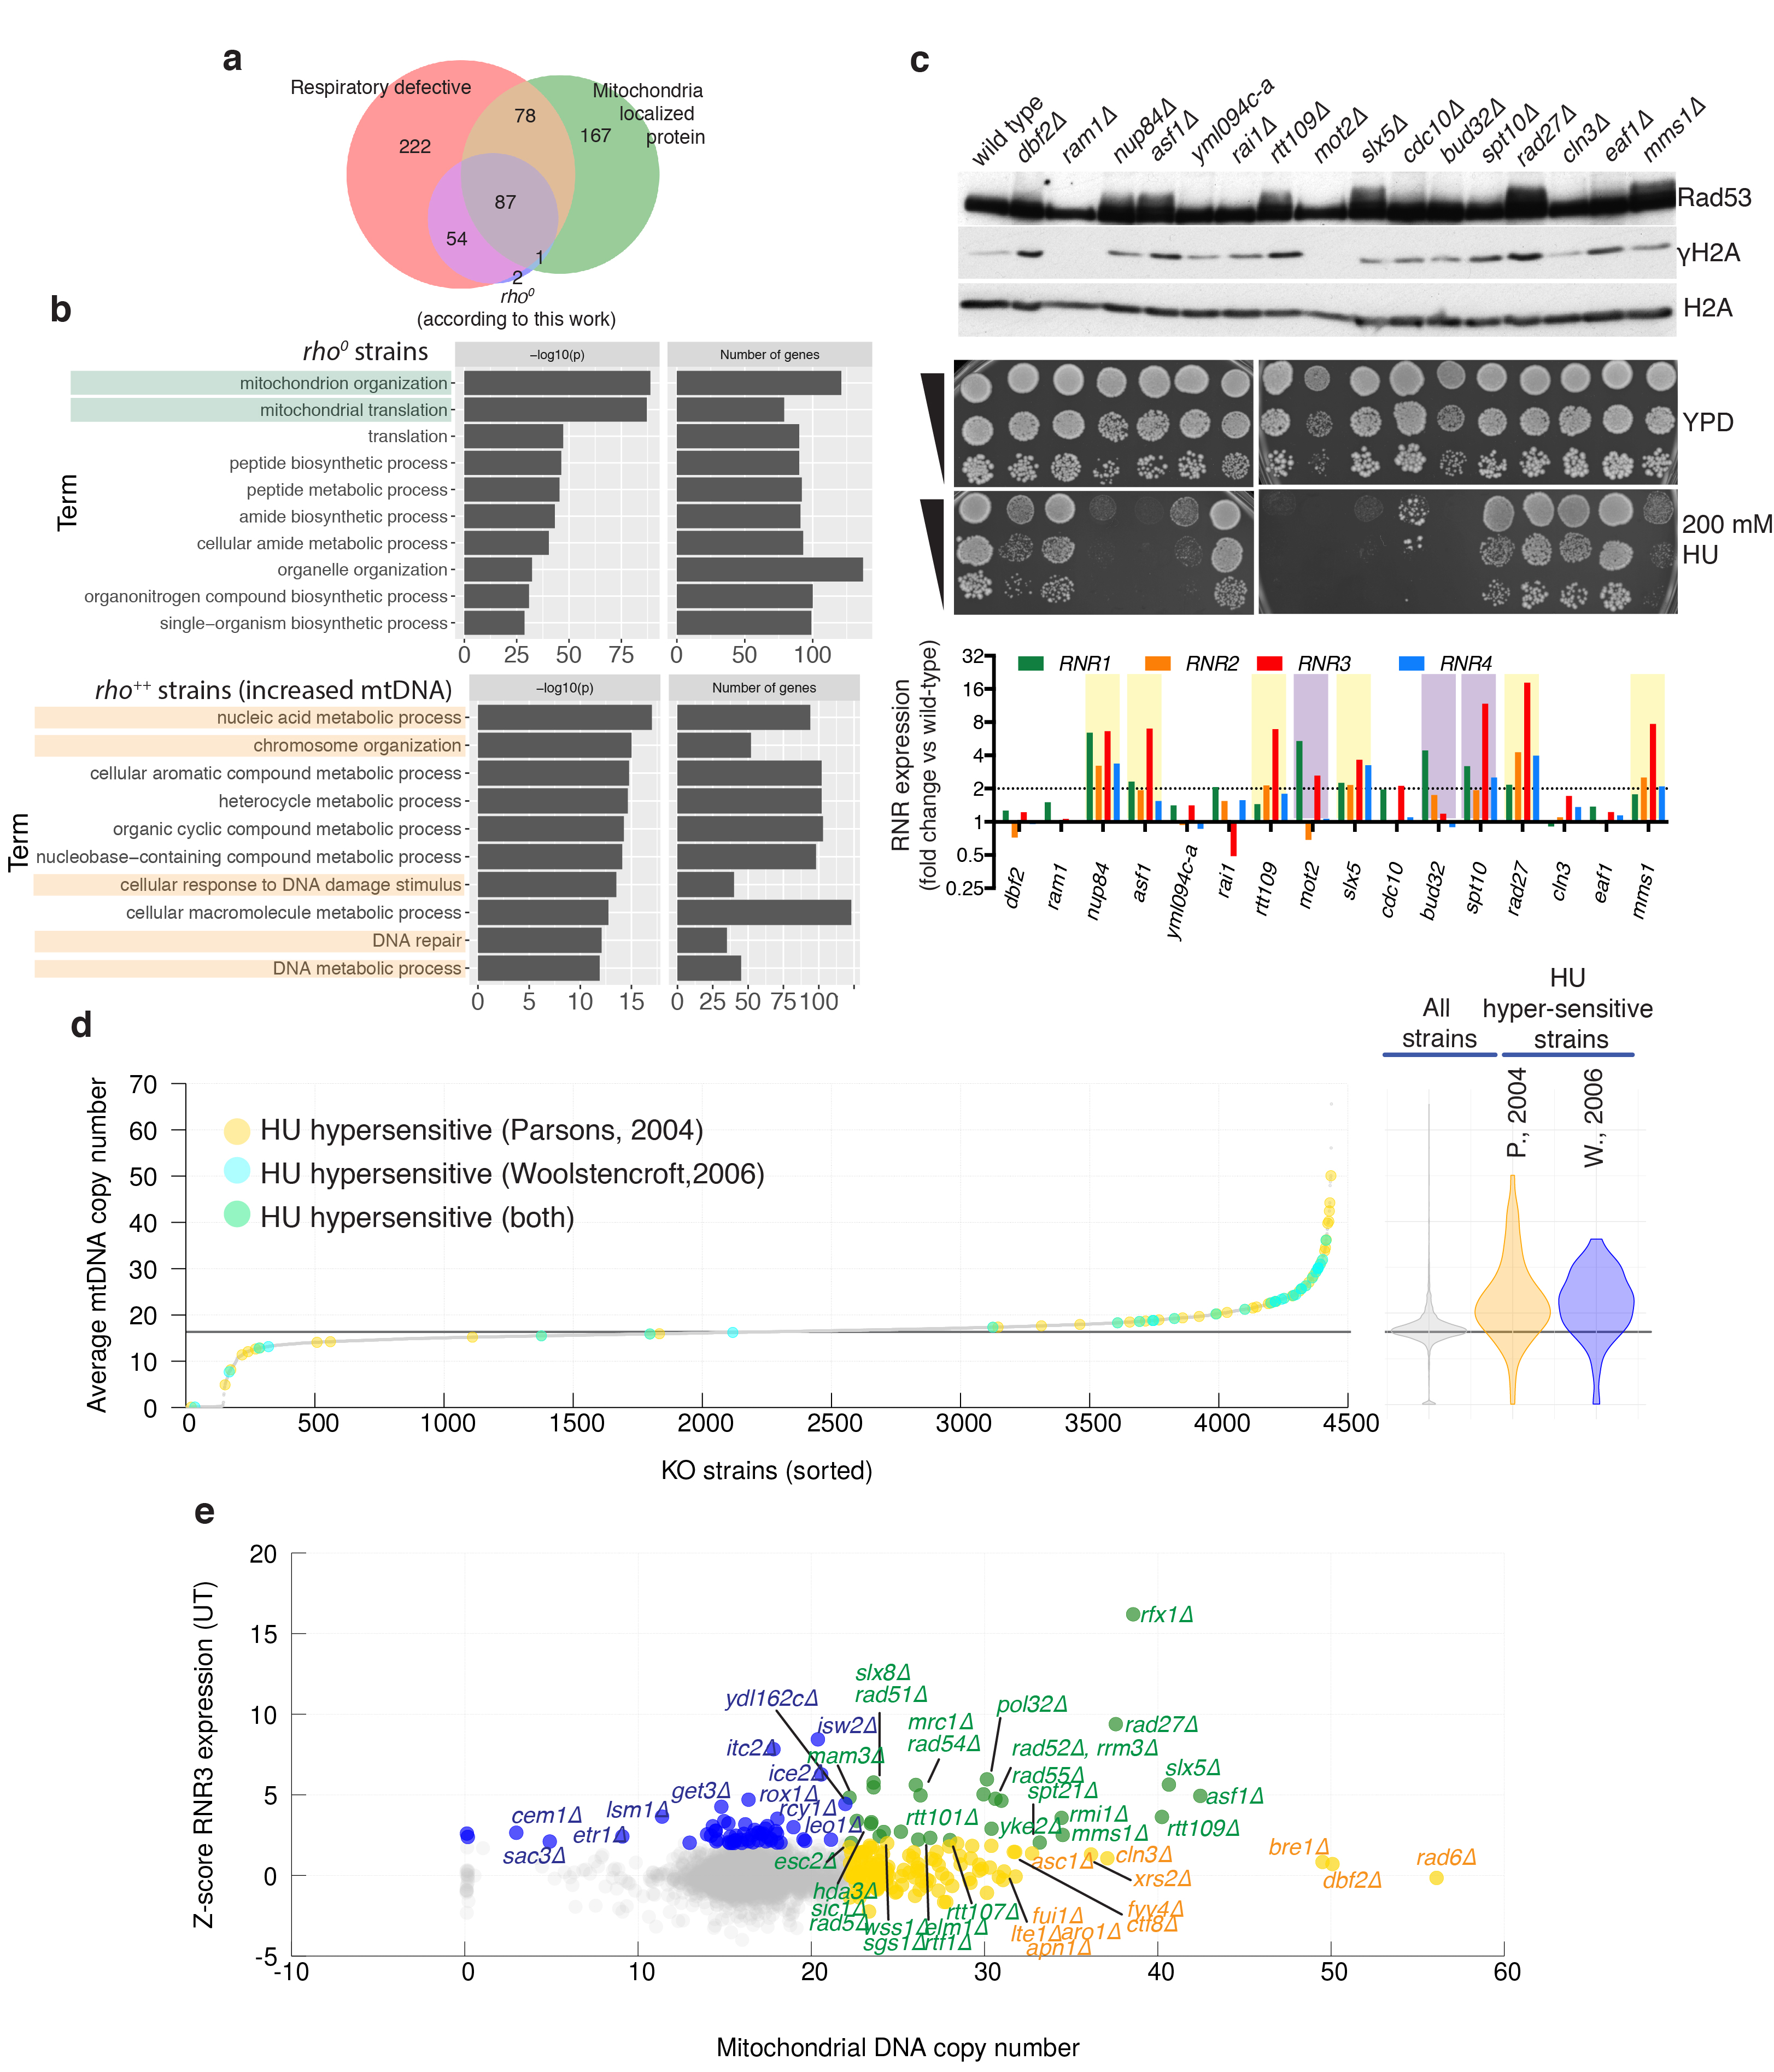
(a) Venn diagram showing overlap between genes identified as rho0 by our sequencing, genes encoding mitochondria proteins (source48), and gene knockouts for which respiratory growth was annotated as ‘absent’ (source SGD: http://www.yeastgenome.org). (b) Gene-ontology of rho0 strains (estimated mtDNA copy number <1) and rho++ strains (estimated mtDNA copy number >20.3; Bonferroni corrected p-values). (c) Sixteen gene-knockouts from the top end of the mtDNA distribution were assessed for spontaneous DDR activation by Rad53 and histone H2A phosphorylation (representative images from two technical replicates, source data in Supplementary Figure 1), and RNR expression (average from 3 technical replicates, one biological sample per strain). Strains with increased RNR expression (violet) or increased RNR expression and Rad53 hyperphosphorylation (yellow) are highlighted. Serial dilutions of the same cultures were also tested for hydroxyurea (HU) sensitivity. (d) Comparisons of mtDNA estimates with systematic analysis of HU sensitivity; HU-sensitive strains are highlighted in different colours depending on the study (Parsons: n=62 and Woolstencroft: n=33 biologically independent samples). (e) Comparison of predicted mtDNA copy-number and RNR3 expression levels: KOs with increased Rnr3 protein levels (blue, Z-score >2); KOs with increased mtDNA (yellow, mtDNA >22.2); KOs with both measures increased (green); n=4436 by KO averages of n=8843 biologically independent samples.
Extended Data Figure 7. mtDNA in KOs for genes encoding tryptophan metabolism enzymes.
Pathway for tryptophan biosynthesis from phosphoenolpyruvate, tryptophan import, and NAD biosynthesis from tryptophan are depicted along with mtDNA copy number estimates for strains lacking each of the enzymes in the pathways (mean from nwt = 8 or nKO = 2 biologically independent samples).
Extended Data Figure 8. Genes frequently carrying mutations contain repetitive regions.
Self dot-plots highlighting degenerate repetitive regions in the DNA sequence of genes found to be frequently mutated in the YKOC. Plots were obtained using FlexiDot.
Extended Data Figure 9. Most frequent YKOC mutations and their distributions between different source laboratories.
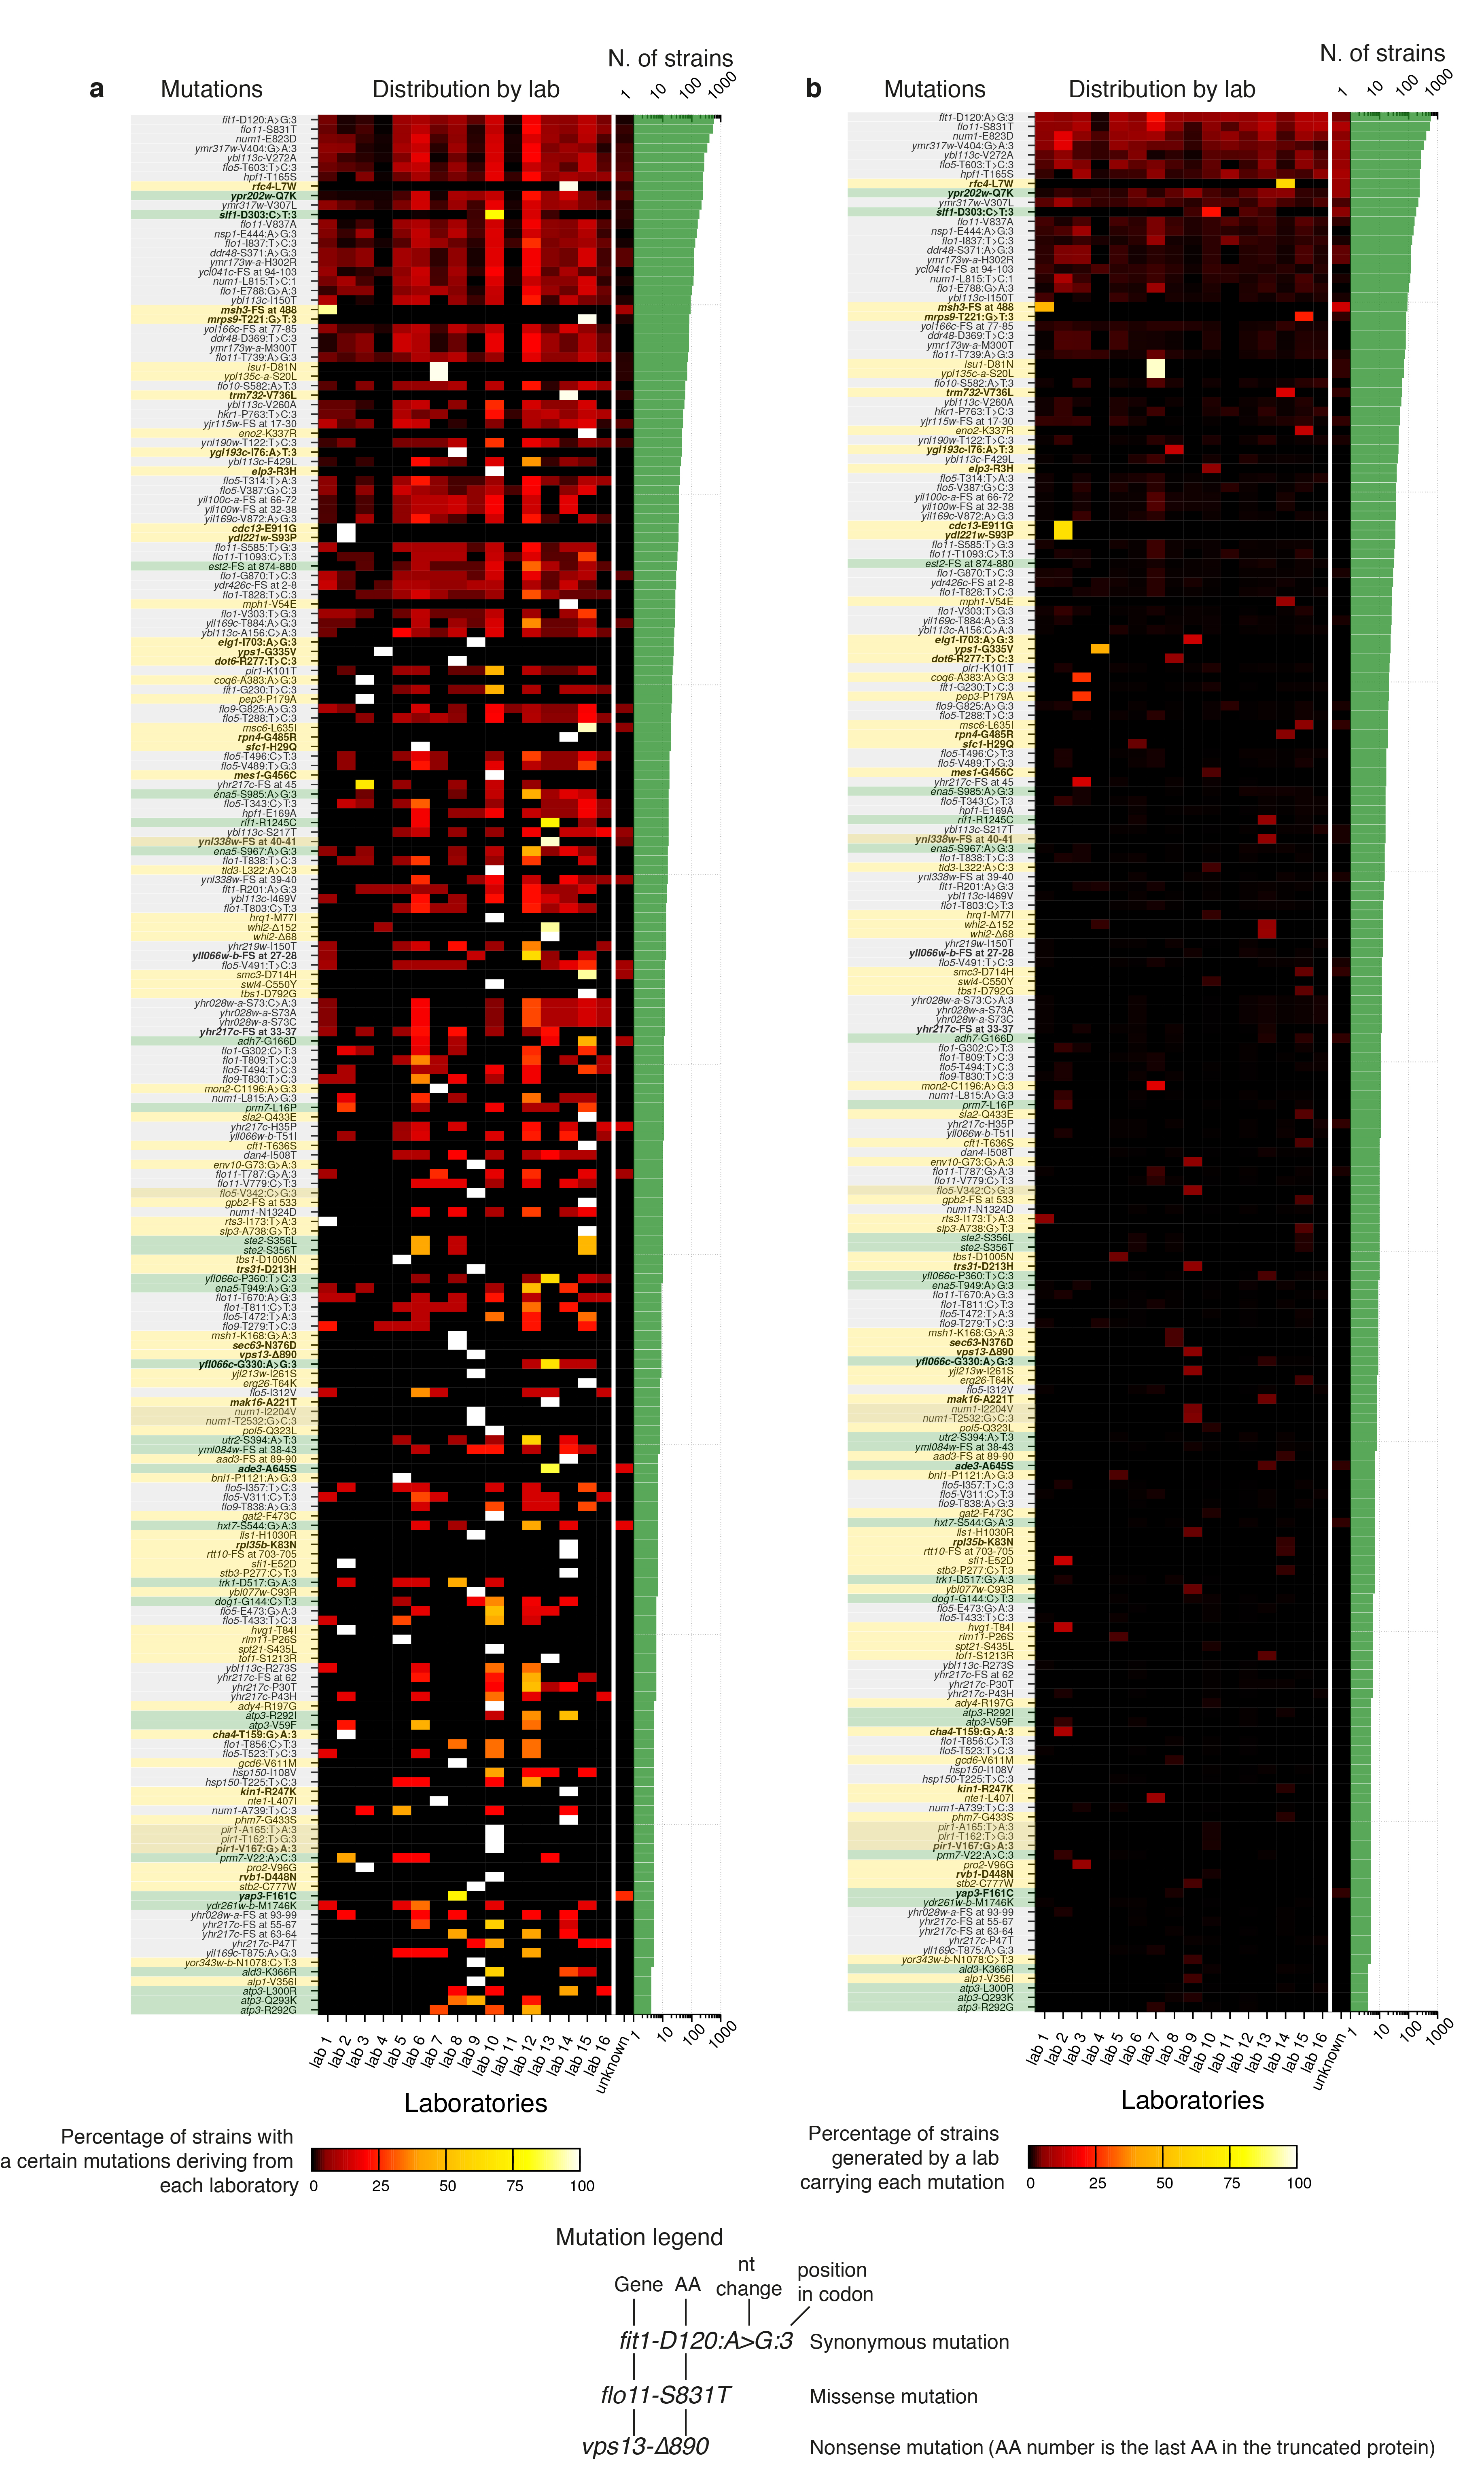
Most frequent mutations, with predicted effects on genes, detected in the YKOC (top 200) and their distribution among different source laboratories. (a) Left: the mutation is indicated by its predicted effect, and the background indicates whether it is a mutation in a gene with degenerate repeats (grey), a mutation coming from founder effect (yellow), or a frequently mutated site (green); boldface indicates homozygous mutation. Centre: heatmap of the distribution of the most frequent mutations by laboratory in which the strain carrying that mutation was produced (100% indicates that all the strains with a certain mutation were generated in the same laboratory). Right: number of strains carrying the mutation. (b) Not all strains derived from each laboratory share founder mutations: as in (a), but a value of 100% in the heatmap indicates that all the strains generated by a certain laboratory have that mutation.
Extended Data Figure 10. Overview of genomic instability caused by non-essential gene knockouts.
(a) Overview of results from our genome instability screens. Strains with an abnormal copy number for different genomic features, aneuploidies and chromosomal rearrangements (CR) are represented by coloured boxes. (b) Gene ontology analysis for 151 GI genes, defined as KOs showing three or more abnormal features. The number of genes in each GO category as well as Holm-Bonferroni corrected p-values are reported. (c) GI genes were manually sorted into classes based on their function, inferred from annotations in SGD.
Supplementary Material
Supplementary Information is available in the online version of the paper.
Acknowledgements
We thank J. Warringer for providing the YKOC and discussing results; E. Alonso-Perez for help with YKOC management; the Cancer Genome Project and DNA Sequencing pipelines at the Wellcome Sanger Institute for help with sample submission, tracking, library preparation and sequencing; C. Bradshaw for help with HPC cluster and nanopore sequencing; R. Wellinger for providing mutant strains; V. Mustonen, I. Vazquez-Garcia, M. Stratton, D. Adams, S. Nik-Zainal, and members of the SPJ laboratory for advice. This research was supported by: Wellcome Strategic Award 101126/Z/13/Z (COMSIG); Wellcome Investigator Award 206388/Z/17/Z; Wellcome PhD Fellowship 098051 to MH; Cancer Research UK Programme Grant C6/A18796; Cancer Research UK C6946/A24843 and Wellcome WT203144 Institute Core Funding; and the National Institutes of Health R35 GM118172 to RL.
Footnotes
Data availability: The primary sequencing data have been deposited in the European Nucleotide Archive in the study ERP109205 under the accession numbers detailed in Supplementary Table 1. Gene-specific information is available interactively at the address http://sgv.gurdon.cam.ac.uk.
Code availability. The custom code used for the analysis of primary sequencing data is available at the address https://github.com/fabiopuddu/augur-fermentorum (v0.5) and it relies on Slurm workload manager (version 15.08.13); Samtools Version: 1.3.1 (using htslib 1.3.1); VCFtools (v0.1.13); Bcftools Version: 1.3.1 (using htslib 1.3.1); BWA Version: 0.7.12-r1039; Python 2.7.12; Perl (v5.22.1); Gnuplot (Version 5.0 patchlevel 3). Code for secondary analyses is available on request.
Author contributions The project was conceived by F.P. and S.P.J.; YKOC duplication was carried out by I.S. and F.P.; single colony isolation and DNA extractions were carried out by A.S. and S.W.; data analyses were carried out by F.P., M.H. and I.A.; logistic regression and telomere length analysis were carried out by R.S., R.M., S.K. and M.K.; CIN measurements were performed by J.Z. and M.G. under R.L.’s supervision; validation experiments were designed by F.P. and carried out by F.P. and G.M.-Z.; the manuscript was written by F.P. and S.P.J., with contributions by G.M.-Z., M.H., M.K., I.S., J.Z., I.A., and R.L.
Author Information Reprints and permissions information is available at www.nature.com/reprints.
The authors declare no competing financial or non-financial interests.
Readers are welcome to comment on the online version of the paper.
References
- 1.Tong AH, et al. Systematic genetic analysis with ordered arrays of yeast deletion mutants. Science (New York, N.Y.) 2001;294:2364–2368. doi: 10.1126/science.1065810. [DOI] [PubMed] [Google Scholar]
- 2.Giaever G, et al. Functional profiling of the Saccharomyces cerevisiae genome. Nature. 2002;418:387–391. doi: 10.1038/nature00935. [DOI] [PubMed] [Google Scholar]
- 3.Giaever G, Nislow C. The yeast deletion collection: a decade of functional genomics. Genetics. 2014;197:451–465. doi: 10.1534/genetics.114.161620. [DOI] [PMC free article] [PubMed] [Google Scholar]
- 4.Hughes TR, et al. Widespread aneuploidy revealed by DNA microarray expression profiling. Nature genetics. 2000;25:333–337. doi: 10.1038/77116. [DOI] [PubMed] [Google Scholar]
- 5.Lehner KR, Stone MM, Farber RA, Petes TD. Ninety-six haploid yeast strains with individual disruptions of open reading frames between YOR097C and YOR192C, constructed for the Saccharomyces genome deletion project, have an additional mutation in the mismatch repair gene MSH3. Genetics. 2007;177:1951–1953. doi: 10.1534/genetics.107.079368. [DOI] [PMC free article] [PubMed] [Google Scholar]
- 6.van Leeuwen J, et al. Exploring genetic suppression interactions on a global scale. Science (New York, N.Y.) 2016;354:aag0839–aag0839. doi: 10.1126/science.aag0839. [DOI] [PMC free article] [PubMed] [Google Scholar]
- 7.Ide S, Saka K, Kobayashi T. Rtt109 prevents hyper-amplification of ribosomal RNA genes through histone modification in budding yeast. PLoS genetics. 2013;9:e1003410. doi: 10.1371/journal.pgen.1003410. [DOI] [PMC free article] [PubMed] [Google Scholar]
- 8.Saka K, Takahashi A, Sasaki M, Kobayashi T. More than 10% of yeast genes are related to genome stability and influence cellular senescence via rDNA maintenance. Nucleic acids research. 2016;44:4211–4221. doi: 10.1093/nar/gkw110. [DOI] [PMC free article] [PubMed] [Google Scholar]
- 9.Claypool JA, et al. Tor pathway regulates Rrn3p-dependent recruitment of yeast RNA polymerase I to the promoter but does not participate in alteration of the number of active genes. Molecular biology of the cell. 2004;15:946–956. doi: 10.1091/mbc.E03-08-0594. [DOI] [PMC free article] [PubMed] [Google Scholar]
- 10.Mansisidor A, et al. Genomic Copy-Number Loss Is Rescued by Self-Limiting Production of DNA Circles. Molecular Cell. 2018;72:583–593.e4. doi: 10.1016/j.molcel.2018.08.036. [DOI] [PMC free article] [PubMed] [Google Scholar]
- 11.Carlsson M, Gustavsson M, Hu G-Z, Murén E, Ronne H. A Ham1p-Dependent Mechanism and Modulation of the Pyrimidine Biosynthetic Pathway Can Both Confer Resistance to 5-Fluorouracil in Yeast. PloS one. 2013;8:e52094. doi: 10.1371/journal.pone.0052094. [DOI] [PMC free article] [PubMed] [Google Scholar]
- 12.Askree SH, et al. A genome-wide screen for Saccharomyces cerevisiae deletion mutants that affect telomere length. Proc Natl Acad Sci U S A. 2004;101:8658–8663. doi: 10.1073/pnas.0401263101. [DOI] [PMC free article] [PubMed] [Google Scholar]
- 13.Gatbonton T, et al. Telomere length as a quantitative trait: genome-wide survey and genetic mapping of telomere length-control genes in yeast. PLoS genetics. 2006;2:e35. doi: 10.1371/journal.pgen.0020035. [DOI] [PMC free article] [PubMed] [Google Scholar]
- 14.Rog O, Smolikov S, Krauskopf A, Kupiec M. The yeast VPS genes affect telomere length regulation. Curr Genet. 2005;47:18–28. doi: 10.1007/s00294-004-0548-y. [DOI] [PubMed] [Google Scholar]
- 15.Murray AW, Schultes NP, Szostak JW. Chromosome length controls mitotic chromosome segregation in yeast. Cell. 1986;45:529–536. doi: 10.1016/0092-8674(86)90284-9. [DOI] [PubMed] [Google Scholar]
- 16.Sullivan M, Higuchi T, Katis VL, Uhlmann F. Cdc14 phosphatase induces rDNA condensation and resolves cohesin-independent cohesion during budding yeast anaphase. Cell. 2004;117:471–482. doi: 10.1016/s0092-8674(04)00415-5. [DOI] [PubMed] [Google Scholar]
- 17.Indjeian VB, Stern BM, Murray AW. The centromeric protein Sgo1 is required to sense lack of tension on mitotic chromosomes. Science (New York, N.Y.) 2005;307:130–133. doi: 10.1126/science.1101366. [DOI] [PubMed] [Google Scholar]
- 18.Daniel JA, Keyes BE, Ng YPY, Freeman CO, Burke DJ. Diverse functions of spindle assembly checkpoint genes in Saccharomyces cerevisiae. Genetics. 2006;172:53–65. doi: 10.1534/genetics.105.046441. [DOI] [PMC free article] [PubMed] [Google Scholar]
- 19.Ben-Shitrit T, et al. Systematic identification of gene annotation errors in the widely used yeast mutation collections. Nature methods. 2012;9:373–378. doi: 10.1038/nmeth.1890. [DOI] [PubMed] [Google Scholar]
- 20.Zhu J, et al. Single-Cell Based Quantitative Assay of Chromosome Transmission Fidelity. G3 (Bethesda) 2015;5:1043–1056. doi: 10.1534/g3.115.017913. [DOI] [PMC free article] [PubMed] [Google Scholar]
- 21.Argueso JL, et al. Double-strand breaks associated with repetitive DNA can reshape the genome. Proc Natl Acad Sci U S A. 2008;105:11845–11850. doi: 10.1073/pnas.0804529105. [DOI] [PMC free article] [PubMed] [Google Scholar]
- 22.Vernon M, Lobachev K, Petes TD. High rates of ‘unselected’ aneuploidy and chromosome rearrangements in tel1 mec1 haploid yeast strains. Genetics. 2008;179:237–247. doi: 10.1534/genetics.107.086603. [DOI] [PMC free article] [PubMed] [Google Scholar]
- 23.Lemoine FJ, Degtyareva NP, Lobachev K, Petes TD. Chromosomal translocations in yeast induced by low levels of DNA polymerase a model for chromosome fragile sites. Cell. 2005;120:587–598. doi: 10.1016/j.cell.2004.12.039. [DOI] [PubMed] [Google Scholar]
- 24.Yona AH, et al. Chromosomal duplication is a transient evolutionary solution to stress. Proc Natl Acad Sci U S A. 2012;109:21010–21015. doi: 10.1073/pnas.1211150109. [DOI] [PMC free article] [PubMed] [Google Scholar]
- 25.Rancati G, et al. Aneuploidy underlies rapid adaptive evolution of yeast cells deprived of a conserved cytokinesis motor. Cell. 2008;135:879–893. doi: 10.1016/j.cell.2008.09.039. [DOI] [PMC free article] [PubMed] [Google Scholar]
- 26.Selmecki AM, et al. Polyploidy can drive rapid adaptation in yeast. Nature. 2015;519:349–352. doi: 10.1038/nature14187. [DOI] [PMC free article] [PubMed] [Google Scholar]
- 27.Veatch JR, McMurray MA, Nelson ZW, Gottschling DE. Mitochondrial Dysfunction Leads to Nuclear Genome Instability via an Iron-Sulfur Cluster Defect. Cell. 2009;137:1247–1258. doi: 10.1016/j.cell.2009.04.014. [DOI] [PMC free article] [PubMed] [Google Scholar]
- 28.Taylor SD, et al. The conserved Mec1/Rad53 nuclear checkpoint pathway regulates mitochondrial DNA copy number in Saccharomyces cerevisiae. Molecular biology of the cell. 2005;16:3010–3018. doi: 10.1091/mbc.E05-01-0053. [DOI] [PMC free article] [PubMed] [Google Scholar]
- 29.Huang M, Zhou Z, Elledge SJ. The DNA replication and damage checkpoint pathways induce transcription by inhibition of the Crt1 repressor. Cell. 1998;94:595–605. doi: 10.1016/s0092-8674(00)81601-3. [DOI] [PubMed] [Google Scholar]
- 30.Parsons AB, et al. Integration of chemical-genetic and genetic interaction data links bioactive compounds to cellular target pathways. Nature biotechnology. 2004;22:62–69. doi: 10.1038/nbt919. [DOI] [PubMed] [Google Scholar]
- 31.Woolstencroft RN, et al. Ccr4 contributes to tolerance of replication stress through control of CRT1 mRNA poly(A) tail length. J Cell Sci. 2006;119:5178–5192. doi: 10.1242/jcs.03221. [DOI] [PubMed] [Google Scholar]
- 32.Hendry JA, Tan G, Ou J, Boone C, Brown GW. Leveraging DNA damage response signaling to identify yeast genes controlling genome stability. G3 (Bethesda) 2015;5:997–1006. doi: 10.1534/g3.115.016576. [DOI] [PMC free article] [PubMed] [Google Scholar]
- 33.Sabouri N, Viberg J, Goyal DK, Johansson E, Chabes A. Evidence for lesion bypass by yeast replicative DNA polymerases during DNA damage. Nucleic acids research. 2008;36:5660–5667. doi: 10.1093/nar/gkn555. [DOI] [PMC free article] [PubMed] [Google Scholar]
- 34.Huang M, Elledge SJ. Identification of RNR4, encoding a second essential small subunit of ribonucleotide reductase in Saccharomyces cerevisiae. Molecular and cellular biology. 1997;17:6105–6113. doi: 10.1128/mcb.17.10.6105. [DOI] [PMC free article] [PubMed] [Google Scholar]
- 35.Pereira C, Pereira AT, Osório H, Moradas-Ferreira P, Costa V. Sit4p-mediated dephosphorylation of Atp2p regulates ATP synthase activity and mitochondrial function. Biochim Biophys Acta. 2018;1859:591–601. doi: 10.1016/j.bbabio.2018.04.011. [DOI] [PubMed] [Google Scholar]
- 36.Endo K, Tago Y-I, Daigaku Y, Yamamoto K. Error-free RAD52 pathway and error-prone REV3 pathway determines spontaneous mutagenesis in Saccharomyces cerevisiae. Genes Genet Syst. 2007;82:35–42. doi: 10.1266/ggs.82.35. [DOI] [PubMed] [Google Scholar]
- 37.Liefshitz B, Parket A, Maya R, Kupiec M. The role of DNA repair genes in recombination between repeated sequences in yeast. Genetics. 1995;140:1199–1211. doi: 10.1093/genetics/140.4.1199. [DOI] [PMC free article] [PubMed] [Google Scholar]
- 38.Zou X, et al. Validating the concept of mutational signatures with isogenic cell models. Nature communications. 2018;9 doi: 10.1038/s41467-018-04052-8. 1744. [DOI] [PMC free article] [PubMed] [Google Scholar]
- 39.Nik-Zainal S, et al. Mutational processes molding the genomes of 21 breast cancers. Cell. 2012;149:979–993. doi: 10.1016/j.cell.2012.04.024. [DOI] [PMC free article] [PubMed] [Google Scholar]
- 40.Costanzo M, et al. A global genetic interaction network maps a wiring diagram of cellular function. Science (New York, N.Y.) 2016;353:aaf1420–aaf1420. doi: 10.1126/science.aaf1420. [DOI] [PMC free article] [PubMed] [Google Scholar]
- 41.Herzog M, et al. Detection of functional protein domains by unbiased genome-wide forward genetic screening. Sci Rep. 2018;8 doi: 10.1038/s41598-018-24400-4. 6161. [DOI] [PMC free article] [PubMed] [Google Scholar]
- 42.Li H. Minimap2: pairwise alignment for nucleotide sequences. Bioinformatics (Oxford, England) 2018;34:3094–3100. doi: 10.1093/bioinformatics/bty191. [DOI] [PMC free article] [PubMed] [Google Scholar]
- 43.Seibt KM, Schmidt T, Heitkam T. FlexiDot: highly customizable, ambiguity-aware dotplots for visual sequence analyses. Bioinformatics (Oxford, England) 2018;34:3575–3577. doi: 10.1093/bioinformatics/bty395. [DOI] [PubMed] [Google Scholar]
- 44.Shampay J, Szostak JW, Blackburn EH. DNA sequences of telomeres maintained in yeast. Nature. 1984;310:154–157. doi: 10.1038/310154a0. [DOI] [PubMed] [Google Scholar]
- 45.Rubinstein L, et al. Telomere length kinetics assay (TELKA) sorts the telomere length maintenance (tlm) mutants into functional groups. Nucleic acids research. 2014;42:6314–6325. doi: 10.1093/nar/gku267. [DOI] [PMC free article] [PubMed] [Google Scholar]
- 46.Krzywinski M, et al. Circos: an information aesthetic for comparative genomics. Genome research. 2009;19:1639–1645. doi: 10.1101/gr.092759.109. [DOI] [PMC free article] [PubMed] [Google Scholar]
- 47.McLaren W, et al. Deriving the consequences of genomic variants with the Ensembl API and SNP Effect Predictor. Bioinformatics (Oxford, England) 2010;26:2069–2070. doi: 10.1093/bioinformatics/btq330. [DOI] [PMC free article] [PubMed] [Google Scholar]
- 48.Huh W-K, et al. Global analysis of protein localization in budding yeast. Nature. 2003;425:686–691. doi: 10.1038/nature02026. [DOI] [PubMed] [Google Scholar]
Associated Data
This section collects any data citations, data availability statements, or supplementary materials included in this article.


