Abstract
The pod-shaped TiO2 nano burst tubes (TiO2 NBTs) were prepared by the combination of electrospinning and impregnation calcination with oxalic acid (H2C2O4), polystyrene (PS) and tetrabutyl titanate. The silver nanoparticles (AgNPs) were loaded onto the surface of TiO2 NBTs by ultraviolet light reduction method to prepare pod-shaped Ag@TiO2 NBTs. In this work, we analysed the effect of the amount of oxalic acid on the cracking degree of TiO2 NBTs; the effect of the concentration of AgNO3 solution on the particle size and loading of AgNPs on the surface of TiO2 NBTs. Scanning electron microscopy and transmission electron microscopy investigated the surface morphology of samples. X-ray diffraction and X-ray photoelectron spectroscopy characterized the structure and composition of samples. Rhodamine B (RhB) solution was used to evaluate the photocatalytic activity of pod-shaped TiO2 NBTs and Ag@TiO2 NBTs. The results showed that TiO2 NBTs degraded 91.0% of RhB under ultraviolet light, Ag@TiO2 NBTs degraded 95.5% under visible light for 75 and 60 min, respectively. The degradation process of both samples was consistent with the Langmuir–Hinshelwood first-order kinetic equation. Therefore, the catalytic performance of the sample is: Ag@TiO2 NBTs > TiO2 NBTs > TiO2 nanotubes.
Keywords: nanocomposites, pod-shaped, TiO2, morphology control, photocatalysis
1. Introduction
Titanium dioxide (TiO2) is a multifunctional semiconductor metal oxide, which has attracted an extensive range of research attention because of its unique optical, electronic and antibacterial properties. In practical applications, TiO2 is not toxic, has super-hydrophilicity and can completely contact with food [1] and does not affect human health. TiO2 shows good development prospects in many fields. At present, TiO2 has been widely used as a multifunctional material in the fields of solar cells [2], sensors [3], ceramics [4,5], especially photocatalysts [6–8] in many environmental pollution control programmes. Photocatalytic technology based on nano-TiO2 materials provides a cheap, non-toxic, energy-efficient and highly efficient method for degrading organic pollutants in air and water [9–12]. As an indirect bandgap semiconductor material, TiO2 has typical semiconductor energy band characteristics. The energy band consists of a valence band (VB) filled with electron orbits, an empty orbital conduction band (CB) without electrons and a band gap (Eg) between the VB and the CB. When TiO2 is not excited, electrons in the VB do not automatically transition to the CB. Only when the energy excited by the photons is greater than Eg, the electrons in the VB absorb the energy of the photon transition into the CB, and holes are generated in the VB, ‘electron–hole pairs’ (e−–h+) are formed [13–16]. As the research groups continue to explore, the morphological structure of TiO2 is also constantly changing. Nanorods, nanotubes, nanoflowers, nanoparticles and nanofibres have been studied and prepared. Although notable advances have been made, the high recombination rate of the photogenerated electron/hole pairs and the low utilization rate of ultraviolet hinder its further application in industry.
In order to improve the ability of TiO2 to degrade organic pollutants, researchers have made many efforts. Coupling TiO2 with other semiconductor or precious metal matrix composites or heterostructures provides a beneficial solution for defects in photocatalytic applications [17–20]; e.g. doping noble metals Au, Ag and Pt to increase the photocatalytic efficiency of TiO2. Because the decorative precious metal forms a Schottky barrier with TiO2, the separation of photogenerated carriers is significantly enhanced, and the interface electron transfer process is promoted. The interface charge transfer process in composite systems is promoted. Moreover, some precious metal nanoparticles (MNPs) can interact strongly with light in the visible region because of their extraordinary localized surface plasmon resonance (LSPR) characteristics [21–25]. This is due to the collective oscillation of electrons near the surface of the MNPs. At present, there are many studies on improving the photocatalytic activity of TiO2 by using the LSPR characteristics of noble MNPs under visible light irradiation [26–28]. Among the precious metals, Ag is most suitable for industrial applications because of its low cost, non-toxicity and ease of preparation. The AgNPs are photochemically reduced by UV irradiation and deposited on the TiO2 photocatalyst, which is a very simple method for synthesizing Ag@TiO2 [29,30].
Here, we describe a method for preparing the novel pod-shaped TiO2 nano burst tubes (NBTs) by electrospinning and impregnation calcination [6,31–34]. AgNPs were successfully loaded on the surface of TiO2 NBTs by UV reduction to obtain Ag@TiO2 NBTs. Scanning electron microscopy (SEM) and transmission electron microscopy (TEM) were used to observe surface morphology and size of the samples. The results of X-ray diffraction (XRD) and X-ray photoelectron spectroscopy (XPS) showed that the sample was mainly anatase TiO2, and the TiO2 NBTs were successfully modified after loading AgNPs. The DRS measurement results fully demonstrated that the addition of AgNPs improves the light absorption efficiency of the samples. The special cracking structure of pod-shaped TiO2 NBTs and Ag@TiO2 NBTs can effectively capture light and have a large surface area and more active sites [35]. Therefore, the sample could increase the rate of electron transfer process and reduce the recombination of charge carriers, thereby improving the catalytic ability of the sample. The current work provides a new form of support for metal and metal oxide particles, which has a high potential value for future photocatalytic research.
2. Material and methods
2.1. Materials
Polystyrene (PS) was provided by Shanghai Youngling Electromechanical Technology Co., Ltd (the PS with Mw = 150 000 g mol−1). Tetrabutyl titanate (TBOT 97%), N,N-dimethylformamide (DMF), AgNO3 and Rhodamine B (RhB) were purchased from Aladdin Industrial Corporation. Absolute ethanol and oxalic acid (H2C2O4) were bought from Beijing chemical works. All chemicals were of analytic grade and used without further purification.
2.2. Preparation of pod-shaped TiO2 NBTs
An amount of 1.15 g of PS was dissolved in 3.85 g of DMF, 0, 0.005, 0.015, 0.025 and 0.050 g of H2C2O4 were added to the mixture (where the mass fraction of H2C2O4 is 0%, 0.1%, 0.3%, 0.5% and 1.0%, respectively). Magnetic stirring was carried out for 6 h at 60°C. When the humidity of the environment was about 30%, the spinning solution was transferred to a syringe which was connected to a high voltage of 14 kV. The flow rate of the spinning solution was controlled at 1.0 ml h−1, the distance between the needle and the rotating receiver was 16 cm and PS/H2C2O4 fibre membrane was obtained. The fibre membrane was immersed in a TBOT/ethanol solution for 15 min, wherein the mass ratio of TBOT to ethanol solution was 1 : 10. When the fibres were completely infiltrated, they were taken out and placed in a 60°C oven for drying. Finally, the dried PS/H2C2O4/TBOT fibre membrane was placed in a tube furnace and calcined to 550°C (electronic supplementary material, figure S1 shows why the calcination temperature is set to 550°C), wherein the heating rate was 3°C min−1 and the holding time was 30 min. The pod-shaped TiO2 NBTs with different morphology were obtained after annealing. The samples were marked for TiO2(0%), TiO2(0.1%), TiO2(0.3%), TiO2(0.5%) and TiO2(1.0%).
2.3. Preparation of pod-shaped Ag@TiO2 NBTs
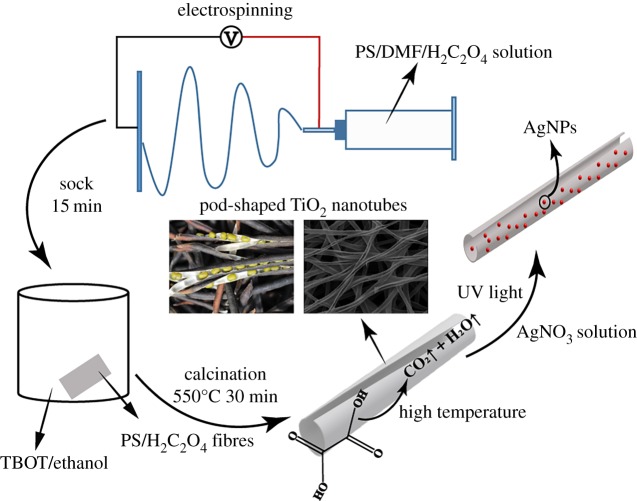
The TiO2(0.3%) sample was immersed in an AgNO3 solution and magnetically stirred for 30 min in the dark with concentrations of AgNO3 of 0.01, 0.05 and 0.1 M, respectively. The speed was set to just suspend the sample in the AgNO3 solution to avoid damaging the sample. Finally, the mixture was placed under ultraviolet irradiation for 5 min and washed thoroughly with distilled water. Then, the composite was dried in an oven at 60°C to obtain pod-shaped Ag@TiO2 NBTs, which were named (0.01 M)Ag@TiO2(0.3%), (0.05 M)Ag@TiO2(0.3%) and (0.10 M)Ag@TiO2(0.3%), respectively. The synthesis process of pod-shaped Ag@TiO2 NBTs is shown in scheme 1.
Scheme 1.
The schematic of the synthesis process for pod-shaped Ag@TiO2 NBTs.
2.4. Catalyst characterization
The surface morphology of pod-shaped TiO2 NBTs and Ag@TiO2 NBTs was observed by SEM (SSX-550, Shimadzu) equipped with energy-dispersive X-ray analysis and TEM (Tecnai F20, FEI). The crystal structure properties of pod-shaped TiO2 NBTs and Ag@TiO2 NBTs were studied by X-ray diffractometry (XRD, XRD-7000, Shimadzu) with Cu Kα (λ = 0.15418 nm) as radiation source and the scanning range from 20° to 80°. The thermogravimetric differential thermal curves (TG-DTA, HCT-3, Beijing Henven Scientific Instrument Factory) of the H2C2O4 and precursor nanofibres were analysed. The specific surface area of the sample was measured by specific surface and pore size analysis instrument (3H-2000PS1, BeiShiDe instrument). XPS was performed on a VG ESCALAB LKII instrument with Mg-Kα-ADES (hv = 1253.6 eV) source at a residual gas pressure of below 1028 Pa. The optical properties of samples were evaluated using a diffuse reflectance ultraviolet–visible spectrophotometer (DRS, TU-1950, Beijing Purkinje General) with BaSO4 as reference. The absorbance of RhB at 554 nm was measured by ultraviolet–visible spectrophotometer.
2.5. Photocatalytic activity measurement
By using the degradation rate of RhB solution, the photocatalytic activity of pod-shaped TiO2 NBTs was investigated. To ensure the mixture reached the adsorption–desorption equilibrium, the mixture of RhB and samples was magnetically stirred in the dark for 2 h. The mixture was exposed to irradiation of high-pressure mercury lamp (360 W). The 5 ml solution was extracted from the mixture every 15 min and centrifuged to determine the concentration of RhB in the solution by UV–visible spectrum.
The photocatalytic experimental procedure of three samples of pod-shaped Ag@TiO2 NBTs was the same as the above process, and the TiO2(0.3%) as a blank comparison. The difference was that the visible light was irradiated with 360 W, and the sampling interval was 10 min.
3. Results and discussion
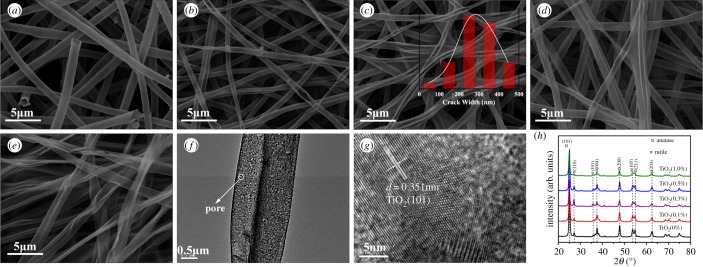
Figure 1 shows SEM images of five samples, TEM and high-resolution TEM (HRTEM) images of the sample TiO2(0.3%) and the XRD patterns of five samples. According to figure 1a, it can be known that when the mass fraction of H2C2O4 is 0%, PS and DMF were used to configure the spinning solution, and the diameter of TiO2(0%) is about 0.8–1.5 µm. As shown in figure 1b–d, the diameter of the sample was gradually reduced as H2C2O4 was added; the diameter range was maintained at 0.6–1.2 µm. It can be clearly seen from figure 1a–e that the morphology of the TiO2 NBTs has changed due to the difference in the amount of H2C2O4 added. The greater the amount of H2C2O4 added, the greater the degree of cracking of the TiO2 NBTs. It can be clearly seen from the illustration in figure 1c that the crack width of the TiO2(0.3%) is 70.0% at 200–400 nm. The TiO2(1.0%) has been transformed from a tubular shape to a sheet shape with a width of 0.7–2.4 µm from figure 1e, so TiO2 is not only a planar structure in space but also a pleated form. In summary, the cracking process of TiO2 NBTs is very similar to the ripening process of pod. Therefore, it was described as pod-shaped TiO2 NBTs. As shown in figure 1f, the TEM image of sample TiO2(0.3%), the presence of many pore structures can clearly be observed. Figure 1g is an HRTEM image of TiO2 (0.3%), and the lattice spacing d of the sample was measured to be 0.351 nm.
Figure 1.
SEM images of five samples: (a–e) were sampled at TiO2(0%), TiO2(0.1%), TiO2(0.3%), TiO2(0.5%) and TiO2(1.0%), respectively (the illustration in (c) shows the sample crack width statistics), (f) TEM image and (g) HRTEM image of sample TiO2(0.3%) and (h) the XRD patterns of the five samples.
Figure 1h depicts the XRD patterns of TiO2(0%), TiO2(0.1%), TiO2(0.3%), TiO2(0.5%) and TiO2(1.0%). The main diffraction peaks of TiO2 at 25.28°, 37.80°, 48.05°, 53.89°, 55.06° and 62.69° can be indexed to (101), (004), (200), (105), (211) and (204) direction, which characterizes the anatase structure of TiO2 (JCPDS 21-1272). The 25.28° diffraction peak is sharpest and points to the anatase TiO2 (101) crystal plane. The lattice spacing of the anatase TiO2 (101) crystal plane is 0.351 nm, which is the same as the HRTEM image measurement. The main diffraction peaks of TiO2 at 27.45° and 36.09° are indexed to the (110) and (101) directions, which characterize the rutile-type TiO2 (JCPDS 21-1276). The diffraction peaks in the (110) and (101) directions are considered as by-product peaks. The peak of the XRD pattern corresponding to the TiO2 rutile structure is very small, indicating that the purity of the sample is acceptable.
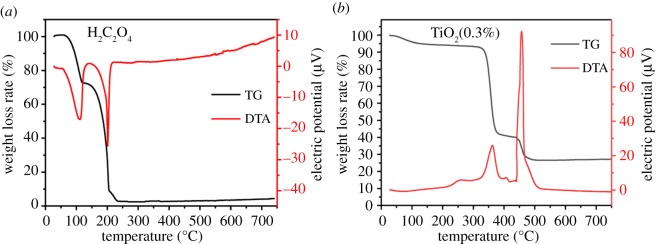
The result of TG-DTA analysis of pure oxalic acid and PS/TBOT composite fibre samples with H2C2O4 content of 0.3% is shown in figure 2. As can be seen from figure 2a, the complete decomposition temperature of pure H2C2O4 is 250°C, and H2C2O4 has been completely decomposed when PS has not been decomposed. Figure 2b shows that the thermal decomposition process of the sample was divided into three stages. The first stage occurred between 70 and 350°C. The sample lost water and H2C2O4 decomposed to release CO2 gas. The second stage is 350–450°C, which represents the decomposition of PS organic components and some of the organics produced by TBOT hydrolysis. The third stage is 450–700°C, mainly including PS main chain degradation and amorphous TiO2 to anatase phase 2 processes.
Figure 2.
TG-DTA analysis of (a) H2C2O4 and (b) TiO2(0.3%) precursor fibre soaked in TBOT.
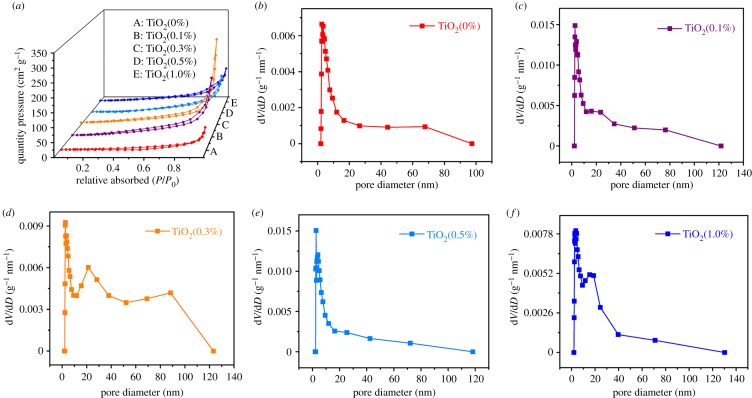
As shown in figure 3a, the specific surface areas of the samples were 28.16, 65.35, 67.55, 43.42 and 51.89 m2 g−1. Sample TiO2(0.3%) has large specific surface area, which may be due to 0.3% H2C2O4 in the sample. In the calcining process, H2C2O4 decomposes to release CO2 gas and water vapour at high temperature, which thins the tube wall and leaves holes, causes the tube wall to break under the impact of a large amount of gas. All samples exhibited the same hysteresis loop in the range of 0.3–1.0 P/P0, indicating a similar pore structure between samples. Figure 3b–f shows the BJH pore size distribution of five samples, and the porous structure of the sample was investigated. The total pore volumes of TiO2(0%), TiO2(0.1%), TiO2(0.3%), TiO2(0.5%) and TiO2(1.0%) were 0.14, 0.36, 0.52, 0.25 and 0.23 cm3 g−1, respectively. The average pore diameters were 14.05, 16.12, 25.39, 13.74 and 14.57 nm, respectively. The TiO2(0.3%) NBTs (figure 3d) have the largest total pore volume and average pore size, while having the largest specific surface area. It also showed excellent performance in photocatalytic performance testing.
Figure 3.
(a) Nitrogen sorption–desorption isotherms of the samples and (b–f) BJH pore size distribution of five samples.
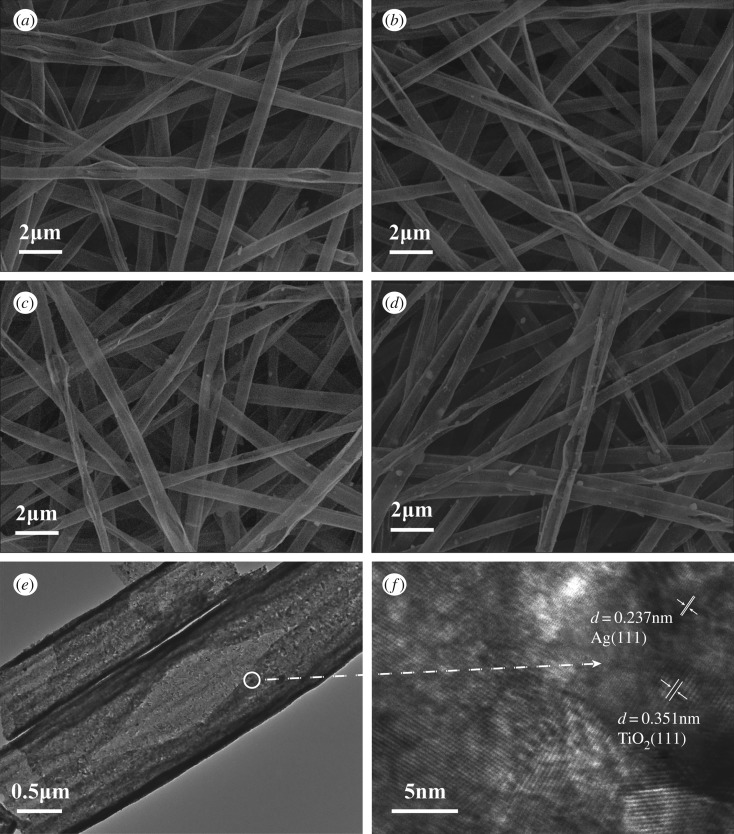
The morphology of samples TiO2(0.3%), (0.01 M)Ag@TiO2(0.3%), (0.05 M)Ag@TiO2(0.3%) and (0.10 M)Ag@TiO2(0.3%) was also characterized by SEM and TEM (the EDS spectrum of the loaded silver nanoparticle sample is shown in electronic supplementary material, figure S2). Figure 4a shows the morphology of the TiO2 NBTs when the amount of H2C2O4 is 0.3%. Figure 4b–d shows images of AgNPs deposited on the surface of pod-shaped TiO2 NBTs when the concentration of AgNO3 solution is 0.01, 0.05 and 0.10 M, respectively. It can be seen from the images that by controlling the concentration of AgNO3 solution, effect the deposition amount of AgNPs on the surface of the pod-shaped TiO2 NBTs. From the TEM image of the sample (0.05 M)Ag@TiO2(0.3%) (figure 4e), the presence of AgNPs on the surface of sample could not be clearly observed. Therefore, an HRTEM image of the sample is also required to demonstrate the growth of AgNPs on the surface of the pod-shaped TiO2 NBTs. The lattice spacing of 0.237 and 0.351 nm was found in figure 4f, thus demonstrating the existence of AgNPs.
Figure 4.
SEM images of four samples: (a–d) were sampled at TiO2(0.3%), (0.01 M)Ag@TiO2(0.3%), (0.05 M)Ag@TiO2(0.3%) and (0.10 M)Ag@TiO2(0.3%), respectively; (e) TEM image and (f) HRTEM image of sample (0.05 M)Ag@TiO2(0.3%).
Figure 5 shows an XRD pattern of pod-shaped TiO2(0.3%) and (0.05 M)Ag@TiO2(0.3%) samples. The crystal structure of a specific sample TiO2(0.3%) has been seen in figure 1h. Therefore, the diffraction peak corresponding to Ag is mainly analysed in figure 5. Because the deposition amount of AgNPs was too low to be detected, the Ag peak was not clearly observed at the position of 38.1°, 44.3° and 64.5°. Therefore, XPS analysis of the sample is required to further demonstrate the presence of silver nanoparticles in the sample.
Figure 5.
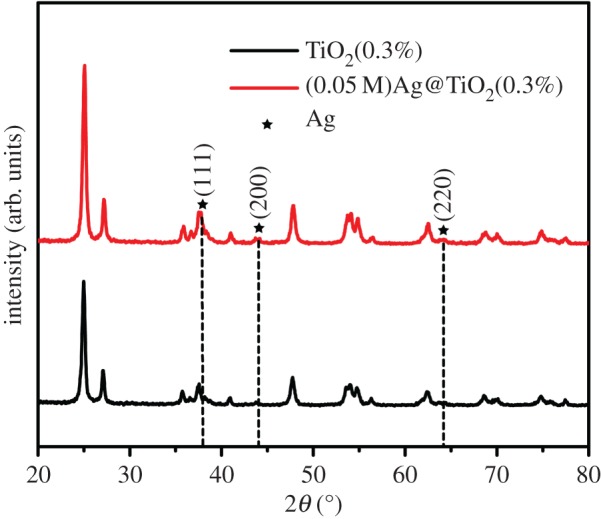
The XRD patterns of the samples TiO2(0.3%) and (0.05 M)Ag@TiO2(0.3%).
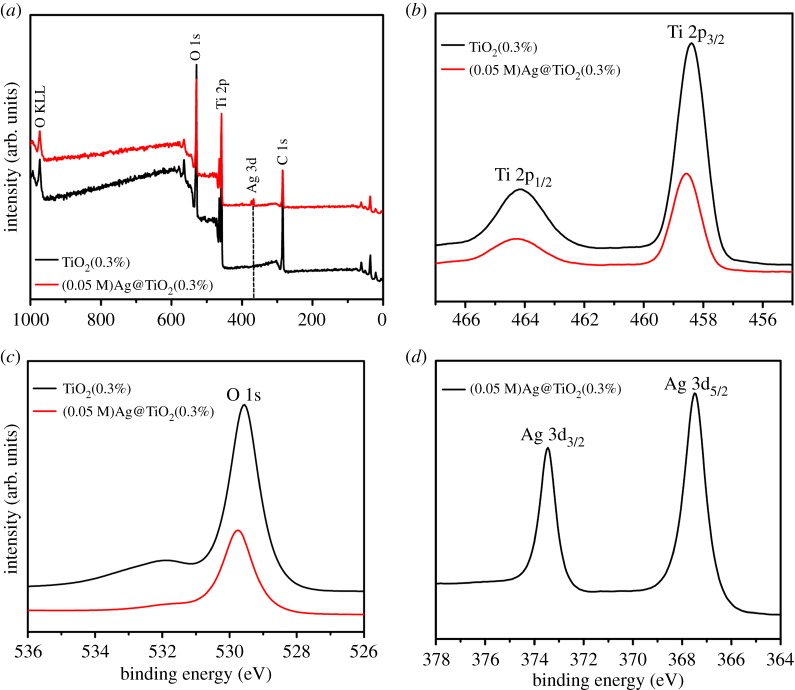
XPS analysis was used to determine the chemical composition and bonding configuration of the prepared samples. The entire spectrum of TiO2(0.3%) and (0.05 M)Ag@TiO2(0.3%) (0–1000 eV) is shown in figure 6a. According to figure 6b,c, it can be concluded that the Ti 2p3/2 and Ti 2p1/2 binding energies of the sample TiO2(0.3%) are 458.38 and 464.16 eV, respectively. When AgNPs are deposited onto the TiO2(0.3%) by photoreduction, the binding energies of Ti 2p3/2, Ti 2p1/2 and peaks were converted to 458.57 and 464.28 eV, respectively. At the same time, the peak value of O 1s increased from 529.55 to 529.75 eV. These data are significantly higher than the corresponding values for sample TiO2(0.3%). This transformation means that there is an electron interaction between the sample TiO2(0.3%) and Ag. Therefore, the binding energy of Ti 2p and O 1s increases with the increase in the lower Fermi level of Ag, and the electrons on the surface of TiO2 will be transferred to AgNPs, resulting in a decrease in the electron cloud density of Ti ions. Figure 6d provides a high-resolution XPS spectrum of Ag in sample (0.05 M)Ag@TiO2(0.3%) with a peak of 367.48 eV at Ag 3d5/2 and a standard value of 368.2 eV for bulk metal Ag. The binding energy of AgNPs was significantly reduced. The electrons of AgNPs are transferred to the surface of TiO2, thereby reducing the electron cloud density of silver ion. Therefore, XPS analysis fully demonstrates the existence of Ag nanoparticles.
Figure 6.
XPS spectra of sample TiO2(0.3%) and (0.05 M)Ag@TiO2(0.3%). (a) TiO2(0.3%) and (0.05 M)Ag@TiO2(0.3%) for complete measurement spectra, (b) Ti 2p peak, (c) O 1s peak and (d) Ag 3d peak.
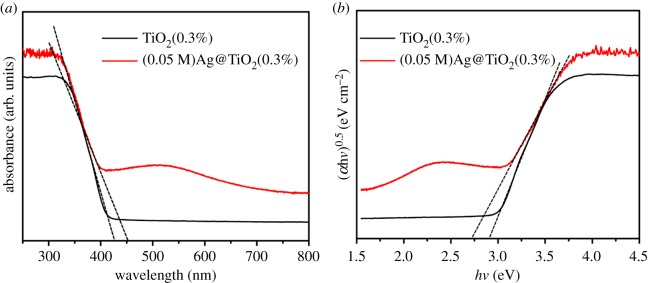
As we all know, the photocatalytic efficiency of photocatalytic materials is closely related to the light absorbance and wavelength range. The light absorption characteristics of the sample under different wavelengths of ultraviolet light can be detected by ultraviolet–visible diffuse reflectance spectroscopy (DRS). It can be seen from figure 7a that the adsorption spectra of the TiO2(0.3%) and (0.05 M)Ag@TiO2(0.3%) are different. (0.05 M)Ag@TiO2(0.3%) has a broad absorption spectrum in the range of 250–600 nm, and its ability to absorb light is stronger than that of sample TiO2(0.3%). By loading AgNPs, the absorbance in the visible region increases, while increasing the photoactivity of the sample under visible light. Because AgNPs are dispersed on the pod-shaped TiO2 NBTs, under visible light irradiation, electrons in AgNPs are excited by light to form LSPR effect, which is more conducive to increasing visible light activity. The semiconductor forbidden band width was determined by the equation Eg (eV) = 1240/λg (absorption threshold, λg (nm)) [36], the tangent axes of the TiO2(0.3%) and (0.05 M)Ag@TiO2(0.3%) were 424.66 and 454.21 nm, respectively, and the forbidden band widths (Eg) of the two samples were 2.92 and 2.73 eV, respectively. The absorption light range of TiO2(0.3%) loaded with silver nanoparticles moves in the visible light direction. Therefore, the sensitivity of sample (0.05 M)Ag@TiO2(0.3%) to light is enhanced. Figure 7b shows the Tauc plot [37] of TiO2(0.3%) and (0.05 M)Ag@TiO2(0.3%). According to the tangent position in figure 7b, the band gap energy of TiO2(0.3%) also was estimated to be 2.92 eV, and the (0.05 M)Ag@TiO2(0.3%) band gap energy of deposited AgNPs was 2.73 eV. Therefore, figure 7 shows the absorption light range of TiO2(0.3%) loaded with AgNPs moves towards the visible light direction, and the forbidden band width is reduced, which improves the light utilization efficiency of the sample.
Figure 7.
UV–Vis diffuse reflectance spectra (a) and Tauc plot (b) of samples TiO2(0.3%) and (0.05 M)Ag@TiO2(0.3%).
As shown in figure 8a, the mixed solution of RhB and five samples degrades under the irradiation of high-pressure mercury lamp. Before the catalytic degradation experiment, the solution containing 10 mg of different nanofibres was magnetically stirred for 2 h in a dark environment to reach an adsorption–desorption equilibrium. C0 and Ct are the initial concentration of RhB solution (10 mg l−1, 10 ml) and the concentration at time t. It can be seen from figure 8b that the degradation process of RhB conforms to the Langmuir–Hinshelwood first-order kinetic reaction for the low-concentration substrates, and the kinetics equation can be expressed as: ln C0/Ct = kt (the degradation rate constants (k, min−1) were 0.3677, 0.3149, 0.7277, 0.3320 and 0.1708 for the five samples). The TiO2(0.3%) has the highest degradation rate constant, which directly indicates that TiO2(0.3%) has the best catalytic performance.
Figure 8.
(a) Photocatalytic activities of samples photocatalyst on photodegradation of RhB under ultraviolet-light irradiation and (b) the corresponding kinetic studies; (c) UV–Vis absorption spectrum of degradation of RhB with sample TiO2(0.3%); (d) the repeatability of four cycles of TiO2(0.3%) test.
Absorption spectra of the solution were measured by UV–Vis spectroscopy, and RhB solution had a strong absorption peak at 554 nm (figure 8c). When the catalytic time was 60 min, the sample TiO2(0.3%) had the best catalytic effect and successfully degraded 91.0% of RhB. When determining the surface area of the sample, the surface area of TiO2(0.3%) is the largest of all samples, which also means that the TiO2 surface has more pores and active sites. Thus, many nanocrystals and interfaces can further promote the diffusion of photogenerated electrons/holes throughout the structure, and the unique pod-shaped TiO2 NBTs can provide an additional route for the light generated by the degradation process to generate charge. In addition, figure 8d shows the degradation efficiency of the TiO2(0.3%) recovered four times. After four reuses, the degradation efficiency of sample TiO2(0.3%) was 94.0%. The photocatalytic activity of sample decreased with the increase in the number of times of recovery. The reason may be that the morphology of pod-shaped TiO2 NBTs changes as the degradation experiment proceeds. In the case of multiple agitation, TiO2 is broken down from pod-shaped into sheet shape.
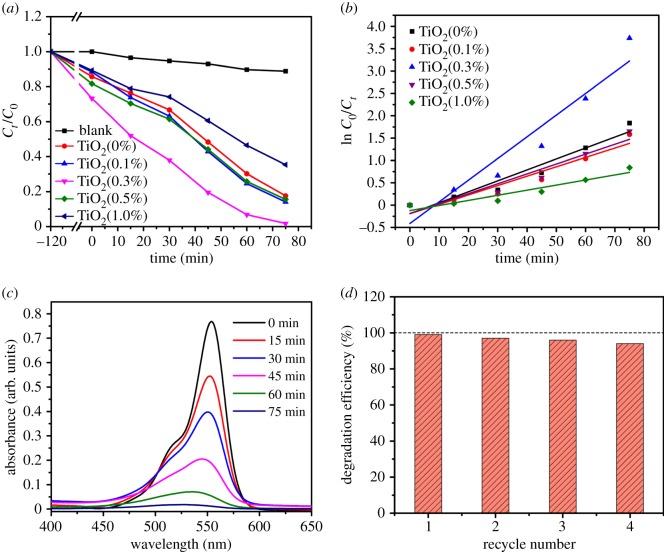
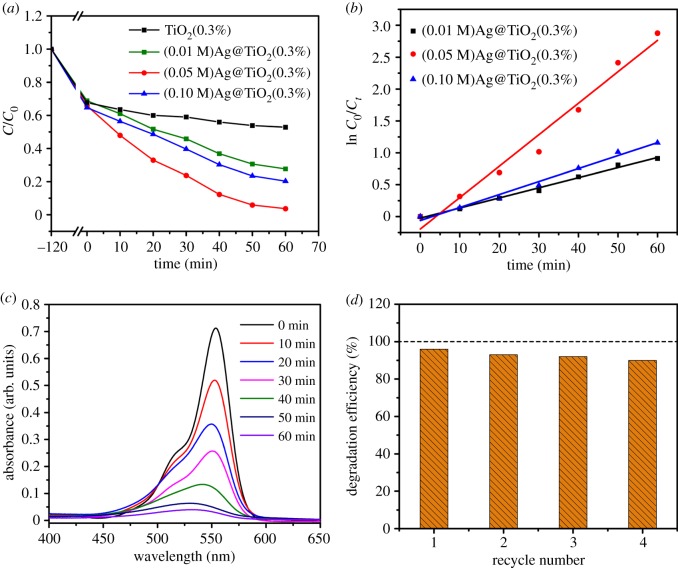
In order to increase the photocatalytic activity of TiO2(0.3%), pod-shaped TiO2 NBTs were prepared by using three different concentrations of AgNO3 solution. The sample degraded the RhB solution under irradiation with visible light. Figure 9a shows the concentration change curve of RhB. Figure 9b shows that (0.01 M)Ag@TiO2(0.3%), (0.05 M)Ag@TiO2(0.3%) and (0.10 M)Ag@TiO2(0.3%) were also consistent with the first-order kinetic equation; therefore, the degradation rate constants (k, min−1) of the three samples were 0.159, 0.0493 and 0.0204, respectively.
Figure 9.
(a) Photocatalytic degradation rate of the sample under visible light and (b) kinetic studies; (c) UV–Vis absorption spectrum of the sample (0.05 M)Ag@TiO2(0.3%) degrading RhB; (d) the four-cycle repeatability test of the sample (0.05 M)Ag@TiO2(0.3%).
Figure 9c shows the UV–Vis absorption spectrum of the degradation of RhB by sample (0.05 M)Ag@TiO2(0.3%) alone. The results showed that the photocatalytic degradation efficiency of sample (0.05 M)Ag@TiO2(0.3%) was much higher than that of TiO2(0.3%), (0.01 M)Ag@TiO2(0.3%) and (0.10 M)Ag@TiO2(0.3%) after 60 min irradiation with visible light. Among them, the degradation efficiency of (0.05 M)Ag@TiO2(0.3%) was 95.5%, while the degradation efficiency of other samples was 23.5, 59.4 and 69.2%. (0.05 M)Ag@TiO2(0.3%) showed the best degradation effect. Meanwhile, the degradation efficiency of the sample recovered four times is shown in figure 9d, and as the number of recoveries increases, the degradation efficiency of the (0.05 M)Ag@TiO2(0.3%) sample also decreases. After four reuses, the degradation efficiency of the sample was 90%. The reason is that after the sample is recovered, AgNPs may be detached from the surface of the sample TiO2(0.3%) and the morphology of pod-shaped TiO2 NBTs is also changing, which affects the catalytic effect.
The SEM image of pod-shaped TiO2(0.3%) and (0.05 M)Ag@TiO2(0.3%) NBTs before and after the catalytic experiment is shown in electronic supplementary material, figure S3.
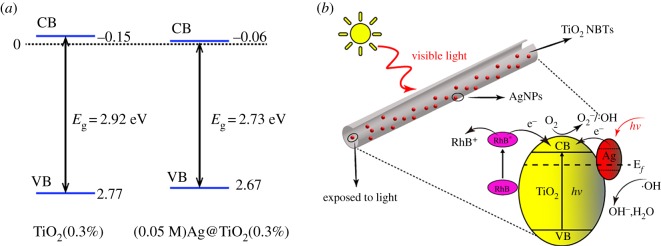
Figure 10a shows band edge (VB, CB) position of TiO2(0.3%) and (0.05 M)Ag@TiO2(0.3%) NBTs. Based on the bandgap energy obtained in figure 7, the empirical equation is used to calculate the position of the CB and the VB in the sample: ECB = X − Ee − Eg/2 and EVB = ECB + Eg [38], where ECB is the CB edge potential, EVB is the VB edge potential, and X is the electronegativity of the semiconductor, which is the arithmetic mean of the electronegativity of constituent atoms and first ionization energy. Ee is the energy of free electrons on the hydrogen scale (approx. 4.5 eV), and Eg is the band gap energy of the semiconductor. The band edge positions (VB, CB) of TiO2(0.3%) were 2.77 and −0.15 eV; the band edge positions of (0.05 M)Ag@TiO2(0.3%) were 2.67 and −0.06 eV. According to the band edge position (VB, CB) of TiO2(0.3%) and (0.05 M)Ag@TiO2(0.3%), it can be known that when the AgNPs are deposited on the surface of TiO2, the forbidden band width and band edge of the sample are effectively reduced. Therefore, (0.05 M)Ag@TiO2(0.3%) has a good catalytic effect.
Figure 10.
(a) Band edge (VB, CB) position of TiO2(0.3%) and (0.05 M)Ag@TiO2(0.3%) NBTs; (b) schematic diagram of charge separation and transfer of pod-shaped Ag@TiO2 NBTs under visible light irradiation.
The transfer behaviour of charge during degradation is shown in figure 10b. The reaction equation is as follows:
| 3.1 |
| 3.2 |
| 3.3 |
| 3.4 |
| 3.5 |
| 3.6 |
| 3.7 |
| 3.8 |
| 3.9 |
RhB can be excited by visible light [39]. When Ag@TiO2 nanocomposites are used as photocatalysts, the RhB molecule was adsorbed onto the surface of the nanocomposite. As shown in figure 10b, RhB* excited by visible light irradiation injects photoelectrons into the CB of the anatase phase, and the RhB molecule is converted to RhB+ and undergoes further reaction to form the final product (equations (3.1), (3.2) and (3.9) are used as references). On the other hand, under visible light illumination, electrons in AgNPs are excited by light to form an LSPR effect, which results in visible light activity. At the same time, since Ag has a large work function, a Schottky barrier is formed at the Ag@TiO2 interface. AgNPs absorb visible light and generate photogenerated electron/hole pairs, the generated electrons are transferred to the CB of the anatase phase (equations (3.4) and (3.5)). Obviously, the reaction increases the electron transport path, which also prevents the recombination of photogenerated electrons and holes. At the same time, the degradation efficiency of RhB is also improved. Through the above-described transfer behaviour of photogenerated electrons, holes accumulate on the surface of AgNPs. Photogenerated electrons accumulate in the CB of the anatase phase and participate in the formation of superoxide anion radicals (·O2−), which combine with H+ and e− to form hydroxyl radicals (·OH) and hydroxide ions (OH−) (equations (3.5) and (3.6)). The holes (h+) accumulated on the surface of AgNPs react with H2O and OH− in the RhB solution to form hydroxyl radicals (·OH) (equations (3.7) and (3.8)). Finally, RhB+ reacts with hydroxyl radicals (·OH) to form environmentally friendly CO2 and H2O (equation (3.9)).
4. Conclusion
This paper proposes a new method for preparing pod-shaped TiO2 NBTs by electrospinning technology and impregnation calcination. AgNPs were successfully loaded on the surface of TiO2 NBTs by photoreduction to obtain Ag@TiO2 NBTs. The special cracking structure of pod-shaped TiO2 NBTs and Ag@TiO2 NBTs can effectively capture light and have a large surface area and more active sites. At the same time, the process of catalyst degradation of RhB is consistent with the first-order kinetic reaction of the Langmuir–Hinshelwood low-concentration substrate. They exhibited an excellent capacity of catalytic degradation of RhB solution. The current work provides a new form of carrier for metal and metal oxide particles, which has the high potential value for future photocatalytic research.
Supplementary Material
Acknowledgements
This paper was made better thanks to helpful comments from Shengzhe Zhao, Mingxu Chu, Chaoyue Zhao, Caijiao Ying and Yafeng Yuan.
Data accessibility
Data available from the Dryad Digital Repository: https://doi.org/10.5061/dryad.bd74r0t [40].
Authors' contributions
S.W. made substantial contributions to conception, design, analysis, interpreted data and drafted the manuscript; Z.H. participated in data analysis and the design of the study; T.D., R.L. and S.L. carried out the statistical analyses and collected field data; Z.C. conceived of the study, designed the study and critically revised the manuscript. All authors gave final approval for publication.
Competing interests
We have no competing interests.
Funding
This work was funded by Jilin Province Innovation Capacity Building Funds Project (2019lC0050-9); Jilin Province Key Technology R&D Project (20180101212NY) and Changchun Science and Technology Project (18DY023).
References
- 1.Zhu Z, Cai H, Sun D-W. 2018. Titanium dioxide (TiO2) photocatalysis technology for nonthermal inactivation of microorganisms in foods. Trends Food Sci. Technol. 75, 23–35. ( 10.1016/j.tifs.2018.02.018) [DOI] [Google Scholar]
- 2.Huang L, et al. 2018. Low-temperature photochemical activation of sol-gel titanium dioxide films for efficient planar heterojunction perovskite solar cells. J. Alloys Compd. 735, 224–233. ( 10.1016/j.jallcom.2017.11.027) [DOI] [Google Scholar]
- 3.Nallal M, Anantha Iyengar G, Pill-Lee K. 2017. New titanium dioxide-based heterojunction nanohybrid for highly selective photoelectrochemical–electrochemical dual-mode sensors. ACS Appl. Mater. Interfaces 9, 37 166–37 183. ( 10.1021/acsami.7b10519) [DOI] [PubMed] [Google Scholar]
- 4.Zhao C, Wu J. 2018. Effects of secondary phases on the high-performance colossal permittivity in titanium dioxide ceramics. ACS Appl. Mater. Interfaces 10, 3680–3688. ( 10.1021/acsami.7b18356) [DOI] [PubMed] [Google Scholar]
- 5.Mahdavi HR, Arzani M, Mohammadi T. 2018. Synthesis, characterization and performance evaluation of an optimized ceramic membrane with physical separation and photocatalytic degradation capabilities. Ceram. Int. 44, 10 281–10 292. ( 10.1016/j.ceramint.2018.03.035) [DOI] [Google Scholar]
- 6.Zhang F, Cheng Z, Cui L, Duan T, Anan A, Zhang C, Kang L. 2016. Controllable synthesis of Ag@TiO2 heterostructures with enhanced photocatalytic activities under UV and visible excitation. RSC Adv. 6, 1844–1850. ( 10.1039/c5ra17762f) [DOI] [Google Scholar]
- 7.Wang C, Hu L, Chai B, Yan J, Li J. 2018. Enhanced photocatalytic activity of electrospun nanofibrous TiO2/g-C3N4 heterojunction photocatalyst under simulated solar light. Appl. Surf. Sci. 430, 243–252. ( 10.1016/j.apsusc.2017.08.036) [DOI] [Google Scholar]
- 8.Liu J, et al. 2016. Photocatalytic activity of TiO2 polycrystalline sub-micron fibers with variable rutile fraction. Appl. Catal., B 187, 154–162. ( 10.1016/j.apcatb.2015.12.040) [DOI] [Google Scholar]
- 9.Gao Y, Fan X-B, Zhang W-F, Zhao Q-S, Zhang G-L, Zhang F-B, Li Y. 2014. Enhanced photocatalytic degradation of methyl orange by Au/TiO2 nanotubes. Mater. Lett. 130, 1–4. ( 10.1016/j.matlet.2014.05.076) [DOI] [Google Scholar]
- 10.Gautam A, Kshirsagar A, Biswas R, Banerjee S, Khanna PK. 2016. Photodegradation of organic dyes based on anatase and rutile TiO2 nanoparticles. RSC Adv. 6, 2746–2759. ( 10.1039/c5ra20861k) [DOI] [Google Scholar]
- 11.Rashed MN, Eltaher MA, Abdou AN. A. 2017. Adsorption and photocatalysis for methyl orange and Cd removal from wastewater using TiO2/sewage sludge-based activated carbon nanocomposites. R. Soc. open sci. 4, 170834 ( 10.1098/rsos.170834) [DOI] [PMC free article] [PubMed] [Google Scholar]
- 12.Vallejo W, Rueda A, Diaz-Uribe C, Grande C, Quintana P. 2019. Photocatalytic activity of graphene oxide-TiO2 thin films sensitized by natural dyes extracted from Bactris guineensis. R. Soc. open sci. 6, 181824 ( 10.1098/rsos.181824) [DOI] [PMC free article] [PubMed] [Google Scholar]
- 13.Nada AA, Nasr M, Viter R, Miele P, Roualdes S, Bechelany M. 2017. Mesoporous ZnFe2O4@TiO2 nanofibers prepared by electrospinning coupled to PECVD as highly performing photocatalytic materials. J. Phys. Chem. C 121, 24 669–24 677. ( 10.1021/acs.jpcc.7b08567) [DOI] [Google Scholar]
- 14.Chen C, Ma W, Zhao J. 2010. Semiconductor-mediated photodegradation of pollutants under visible-light irradiation. Chem. Soc. Rev. 39, 4206–4219. ( 10.1039/b921692h) [DOI] [PubMed] [Google Scholar]
- 15.Yen YC, Lin CC, Chen PY, Ko WY, Tien TR, Lin KJ. 2017. Green synthesis of carbon quantum dots embedded onto titanium dioxide nanowires for enhancing photocurrent. R. Soc. open sci. 4, 161051 ( 10.1098/rsos.161051) [DOI] [PMC free article] [PubMed] [Google Scholar]
- 16.Mandal S, Jain N, Pandey MK, Sreejakumari SS, Shukla P, Chanda A, Som S, Das S, Singh J. 2019. Ultra-bright emission from Sr doped TiO2 nanoparticles through r-GO conjugation. R. Soc. open sci. 6, 190100 ( 10.1098/rsos.190100) [DOI] [PMC free article] [PubMed] [Google Scholar]
- 17.Li X, Zhuang Z, Li W, Pan H. 2012. Photocatalytic reduction of CO2 over noble metal-loaded and nitrogen-doped mesoporous TiO2. Appl. Catal., A 429, 31–38. ( 10.1016/j.apcata.2012.04.001) [DOI] [Google Scholar]
- 18.Rosseler O, Shankar MV, Karkmaz-Le Du M, Schmidlin L, Keller N, Keller V. 2010. Solar light photocatalytic hydrogen production from water over Pt and Au/TiO2 (anatase/rutile) photocatalysts: influence of noble metal and porogen promotion. J. Catal. 269, 179–190. ( 10.1016/j.jcat.2009.11.006) [DOI] [Google Scholar]
- 19.Wang S, Bai L, Ao X. 2018. Preparation and photocatalytic application of a S, Nd double doped nano-TiO2 photocatalyst. RSC Ad. 8, 36 745–36 753. ( 10.1039/c8ra06778c) [DOI] [PMC free article] [PubMed] [Google Scholar]
- 20.Bakar SA, Ribeiro C. 2016. Rapid and morphology controlled synthesis of anionic S-doped TiO2 photocatalysts for the visible-light-driven photodegradation of organic pollutants. RSC Adv. 6, 36 516–36 527. ( 10.1039/c6ra03819k) [DOI] [Google Scholar]
- 21.Li J, Cushing SK, Bright J, Meng F, Senty TR, Zheng P, Bristow AD, Wu N. 2012. Ag@Cu2O core-shell nanoparticles as visible-light plasmonic photocatalysts. ACS Catal. 3, 47–51. ( 10.1021/cs300672f) [DOI] [Google Scholar]
- 22.Chen J-J, Wu JC, Wu PC, Tsai DP. 2012. Improved photocatalytic activity of shell-isolated plasmonic photocatalyst Au@ SiO2/TiO2 by promoted LSPR. J. Phys. Chem. C. 116, 26 535–26 542. ( 10.1021/jp309901y) [DOI] [Google Scholar]
- 23.Nogawa T, Isobe T, Matsushita S, Nakajima A. 2012. Preparation and visible-light photocatalytic activity of Au- and Cu-modified TiO2 powders. Mater. Lett. 82, 174–177. ( 10.1016/j.matlet.2012.05.031) [DOI] [Google Scholar]
- 24.Chen L, Peng Y, Wang H, Gu Z, Duan C. 2014. Synthesis of Au@ZIF-8 single- or multi-core–shell structures for photocatalysis. Chem. Commun. 50, 8651–8654. ( 10.1039/c4cc02818j) [DOI] [PubMed] [Google Scholar]
- 25.Kowalska E, Abe R, Ohtani B. 2009. Visible light-induced photocatalytic reaction of gold-modified titanium (IV) oxide particles: action spectrum analysis. Chem. Commun. 2009, 241–243. ( 10.1039/b815679d) [DOI] [PubMed] [Google Scholar]
- 26.Wang M, Ye M, Iocozzia J, Lin C, Lin Z. 2016. Plasmon-mediated solar energy conversion via photocatalysis in noble metal/semiconductor composites. Ad. Sci. 3, 1600024 ( 10.1002/advs.201600024) [DOI] [PMC free article] [PubMed] [Google Scholar]
- 27.Zhou X, Liu G, Yu J, Fan W. 2012. Surface plasmon resonance-mediated photocatalysis by noble metal-based composites under visible light. J. Mater. Chem. 22, 21 337–21 354. ( 10.1039/c2jm31902k) [DOI] [Google Scholar]
- 28.Bumajdad A, Madkour M. 2014. Understanding the superior photocatalytic activity of noble metals modified titania under UV and visible light irradiation. Phys. Chem. Chem. Phys. 16, 7146–7158. ( 10.1039/c3cp54411g) [DOI] [PubMed] [Google Scholar]
- 29.Lin Y-C, Lee H-S. 2010. Effects of TiO2 coating dosage and operational parameters on a TiO2/Ag photocatalysis system for decolorizing Procion red MX-5B. J. Hazard. Mater. 179, 462–470. ( 10.1016/j.jhazmat.2010.03.026) [DOI] [PubMed] [Google Scholar]
- 30.Liang Y-C, Wang C-C, Kei C-C, Hsueh Y-C, Cho W-H, Perng T-P. 2011. Photocatalysis of Ag-loaded TiO2 nanotube arrays formed by atomic layer deposition. J. Phys. Chem. C. 115, 9498–9502. ( 10.1021/jp202111p) [DOI] [Google Scholar]
- 31.Cheng Z, Zhao S, Kang L, Li M, Gao Z. 2018. A novel preparation of hollow TiO2 nanotubes and pine-cone shaped CdS nanoparticles coated for enhanced ultraviolet and visible light photocatalytic activity. Mater. Lett. 214, 80–83. ( 10.1016/j.matlet.2017.10.021) [DOI] [Google Scholar]
- 32.Ohlmaier-Delgadillo F, Castillo-Ortega MM, Ramírez-Bon R, Armenta-Villegas L, Rodríguez-Félix DE, Santacruz- Ortega H, del Castillo-Castro T, Santos-Sauceda I. 2016. Photocatalytic properties of PMMA-TiO2 class I and class II hybrid nanofibers obtained by electrospinning. J. Appl. Polym. Sci. 133, 48 ( 10.1002/app.44334) [DOI] [Google Scholar]
- 33.Liu T, Lv D, Cao B, Wang H. 2012. Preparation of novel nano/submicrofiber catalyst containing nano-TiO2 particles. J. Appl. Polym. Sci. 126, 1977–1982. ( 10.1002/app.35577) [DOI] [Google Scholar]
- 34.Zhao S, Cheng Z, Kang L, Li M, Gao Z. 2017. The facile preparation of Ag decorated TiO2/ZnO nanotubes and their potent photocatalytic degradation efficiency. RSC Adv. 7, 50 064–50 071. ( 10.1039/c7ra09466c) [DOI] [Google Scholar]
- 35.Bao L, Meng M, Sun K, Li W, Zhao D, Li H, He M. 2014. Selective adsorption and degradation of rhodamine B with modified titanium dioxide photocatalyst. J. Appl. Polym. Sci. 131, 40890 ( 10.1002/app.40890) [DOI] [Google Scholar]
- 36.Sun B, Smirniotis PG, Boolchand P. 2005. Visible light photocatalysis with platinized rutile TiO2 for aqueous organic oxidation. Langmuir 21, 11 397–11 403. [DOI] [PubMed] [Google Scholar]
- 37.Xu Z, Zhang J, Liu H, Kuang P, Wang S, Fu X. 2017. Preparation of silver/silver bromide/titanium dioxide/graphene oxide nanocomposite for photocatalytic degradation of 4-chlorophenol. Nanomater. Nanotechnol. 7, 1847980417724046. [Google Scholar]
- 38.Mohan S, Subramanian B, Bhaumik I, Gupta PK, Jaisankar SN. 2014. Nanostructured Bi(1−x)Gd(x)FeO3—a multiferroic photocatalyst on its sunlight driven photocatalytic activity. RSC Adv. 4, 16 871–16 878. ( 10.1039/c4ra00137k) [DOI] [Google Scholar]
- 39.Molla MA Islam, Tateishi I, Furukawa M, Katsumata H, Suzuki T, Kaneco S. 2017. Evaluation of reaction mechanism for photocatalytic degradation of dye with self-sensitized TiO2 under visible light irradiation. Open J. Inorg. Non-met. Mater. 7, 1–7. ( 10.4236/ojinm.2017.71001) [DOI] [Google Scholar]
- 40.Wang S, Han Z, Di T, Li R, Liu S, Cheng Z.. 2019. Data from: Preparation of pod-shaped TiO2 and Ag@TiO2 nano burst tubes and their photocatalytic activity Dryad Digital Repository. ( 10.5061/dryad.bd74r0t) [DOI] [PMC free article] [PubMed]
Associated Data
This section collects any data citations, data availability statements, or supplementary materials included in this article.
Data Citations
- Wang S, Han Z, Di T, Li R, Liu S, Cheng Z.. 2019. Data from: Preparation of pod-shaped TiO2 and Ag@TiO2 nano burst tubes and their photocatalytic activity Dryad Digital Repository. ( 10.5061/dryad.bd74r0t) [DOI] [PMC free article] [PubMed]
Supplementary Materials
Data Availability Statement
Data available from the Dryad Digital Repository: https://doi.org/10.5061/dryad.bd74r0t [40].


