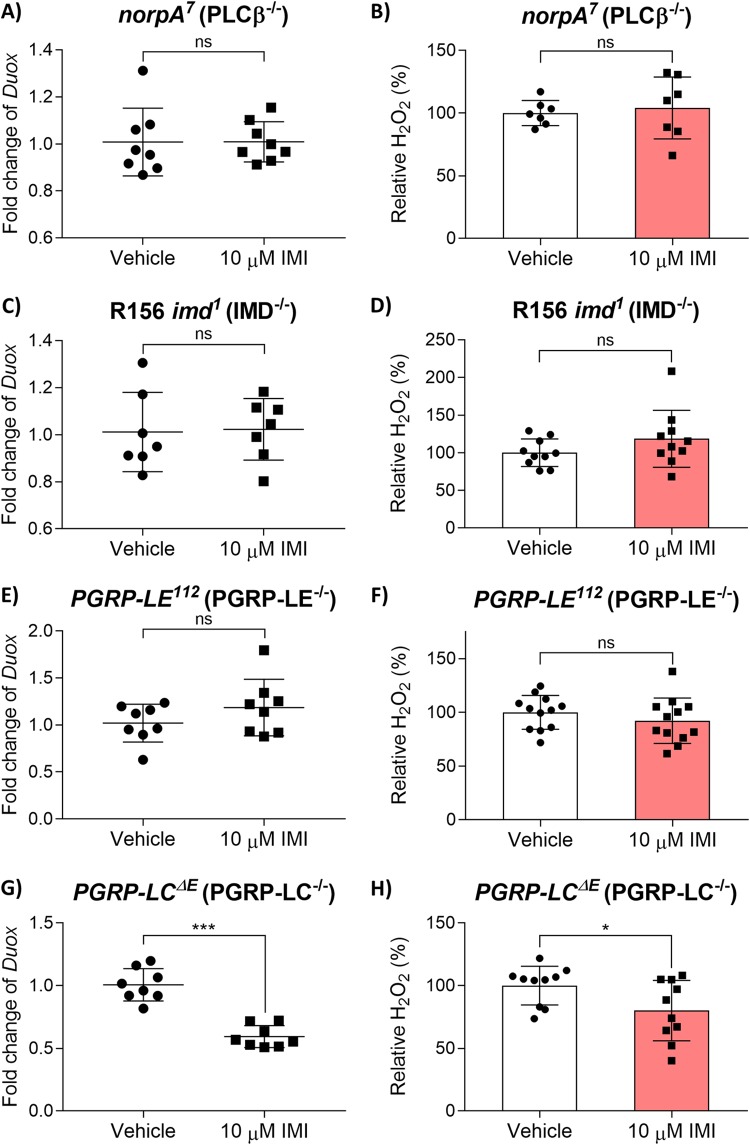
FIG 3.
IMI impairs Duox pathway expression via the Imd pathway. (A and B) norpA7 (PLC-β−/−) flies exposed to 10 μM IMI or vehicle (DMSO) for 5 days. (A) Duox gene expression data points are displayed as mean fold change (relative to RpLP0) of 8 biological replicates with 5 pooled female flies in each group. Error bars represent mean ± SD (Mann-Whitney test). (B) Whole-body H2O2 displayed as mean relative % of H2O2 ± SD (unpaired, two-tailed t test) from 7 biological replicates (each consisting of 3 flies). (C and D) R156 imd1 (IMD−/−) flies exposed to 10 μM IMI or vehicle (DMSO) for 5 days. (C) Duox gene expression data points are displayed as mean fold change (relative to RpLP0) from 7 biological replicates with 5 pooled female flies in each group. Error bars represent mean ± SD (Mann-Whitney test). (D) Whole-body H2O2 displayed as mean relative % of H2O2 ± SD (unpaired, two-tailed t test) from 10 biological replicates (each consisting of 3 flies). (E and F) PGRP-LE112 (PGRP-LE−/−) flies exposed to 10 μM IMI or vehicle (DMSO) for 5 days. (E) Duox gene expression data points are displayed as mean fold change (relative to RpLP0) from 8 biological replicates with 5 pooled female flies in each group. Error bars represent mean ± SD (Mann-Whitney test). (F) Whole-body H2O2 displayed as mean relative % of H2O2 ± SD (unpaired, two-tailed t test) from 12 biological replicates (each consisting of 3 flies). (G and H) PGRP-LCΔE (PGRP-LC−/−) flies exposed to 10 μM IMI or vehicle (DMSO) for 5 days. (G) Duox gene expression data points are displayed as mean fold change (relative to RpLP0) from 8 biological replicates with 5 pooled female flies in each group. Error bars represent mean ± SD (Mann-Whitney test). (H) Whole-body H2O2 displayed as mean relative % of H2O2 ± SD (unpaired, two-tailed t test) from 10 biological replicates (each consisting of 3 flies). In box plot diagrams, boxes represent first and third quartile values, while black lines denote medians. Whiskers encompass maximum and minimum values. *, P < 0.05; **, P < 0.01; ***, P < 0.001; ****, P < 0.0001; ns, not significant.

