

Abstract
Functional hyperemia in the rat cortex was investigated using high-speed optical coherence tomography (OCT) angiography and Doppler OCT. OCT angiography (OCTA) was performed to image the hemodynamic stimulus-response over a wide field of view. Temporal changes in vessel diameters in different vessel compartments, which were determined as the diameters of erythrocyte flows in OCT angiograms, were measured in order to monitor localized hemodynamic changes. Our results showed that the dilation of arterioles at the site of activation was accompanied by the dilation of upstream arteries. Relatively negligible dilation was observed in veins. An increase in the OCTA signal was observed during stimulus in multiple capillaries, which may imply that capillary blood flow increases as a result of the expanded arterial blood volume. These results agree with previous observations using two-photon laser scanning microscopy (TPLSM). Doppler OCT was performed to quantitatively measure stimulus-induced blood flow response in pial arteries. The measurement showed small but clear hemodynamic response in upstream arteries with diameters exceeding 100 m. Our results demonstrate the potential of OCTA and Doppler OCT for the investigation of neurovascular coupling in small animal models.
Keywords: Angiography, cerebral blood flow, Doppler imaging, neurovascular coupling, optical coherence tomography
Introduction
Various functional neuroimaging techniques, such as positron emission tomography (PET),1 blood-oxygen-level-dependent functional magnetic resonance imaging (BOLD fMRI),2 and optical intrinsic signal imaging (OISI)3 have been used to investigate neurovascular coupling, a close interplay between neural activity and the subsequent response in cerebral blood flow (CBF). However, precise interpretation of the signals acquired using these imaging modalities is hindered by complex interactions between various hemodynamic parameters and insufficient spatial resolution.4,5 Two-photon laser scanning microscopy (TPLSM) enabled separate measurement of pure hemodynamic parameters, blood volume, and flow speed with microscopic resolution. TPLSM has played an important role in investigating the hemodynamic response to the neural activity.6–8 However, limited imaging field of TPLSM allows assessment of only a limited number of vessel segments within a narrow focal depth, and monitoring regional hemodynamic responses has been performed by scanning a relatively small number of vessels one at a time.
Optical coherence tomography (OCT) has recently emerged as a high-resolution imaging technique that provides high-speed wide-field imaging of three-dimensional (3D) cerebral microvasculature and quantitative measurement of blood flow.9–12 Several studies have been performed to investigate neurovascular coupling in the rodent brain using OCT, utilizing high imaging speeds and the ability to resolve flow in the depth direction.13–15 However, the potential of high speed OCT to achieve rapid volume acquisition rates has not been fully utilized to investigate fine spatiotemporal characteristics of regional hemodynamic response over a wide field of view.
In this study, the sensory-evoked hemodynamic changes in arteries, arterioles, veins, venules, and capillaries in responses to single-whisker stimulation were investigated using OCTA over a 1.45 mm × 1.45 mm field of view. Our results agree with previous findings that there is a significant arterial contribution to the stimulus-induced increase in blood volume. Arterioles, which play the key role of supplying blood from upstream arteries to subcortical tissues, showed location-dependent response characteristics. An increase in the speckle decorrelation signal in capillaries was observed during stimulus, which implies an overall increase in capillary blood flow as a result of the expanded arterial volume. Finally, the blood flow response in pial arteries was quantitatively measured using Doppler OCT. It was observed that sensory stimulation induced slight dilation of upstream arteries which led to an increase in blood flow transmitted to downstream arterioles. These results demonstrate the potential of high-speed OCT for investigation of neurovascular coupling in the rodent brain.
Materials and methods
Animal preparation
All animal experimental procedures were approved by Korea Advanced Institute of Science and Technology (KAIST) Institutional Animal Care and Use Committee (IACUC) guidelines and all efforts were made to minimize the number of animals used and their suffering, in accordance with the Animal Research: Reporting in Vivo Experiments (ARRIVE) guidelines. Male Sprague-Dawley rats (N = 10, 290–340 g) were anesthetized with isoflurane during surgical procedures (3% for induction, and 2–2.5% for surgery, v/v) with the gas mixture of 40% oxygen and 60% air. After left femoral venous catheterization, the left femoral artery was catheterized to monitor blood pressure and collect blood for blood gas analysis. The head of the animal was fixed in a stereotaxic frame and a circular cranial window with a diameter of 4 mm was implanted on the right somatosensory cortex (centered at 2.5 mm posterior and 6 mm lateral to bregma) to access the whisker barrel region. Right temporalis muscle was retracted without incision while making the window. After the skull was opened, the dura was carefully removed using fine forceps. The exposed cortex was immediately covered with 1.3–1.5% agarose (A9793, Sigma Aldrich, MO, USA) dissolved in the artificial cerebrospinal fluid and the window was sealed with a cover glass and dental cement. A custom head holder was positioned over the window to suppress motion artifacts during imaging. Ketamine–xylazine were administered intravenously (40 mg/kg/h-4 mg/kg/h) through the venous catheter and isoflurane discontinued. After the verification of adequate depth of anesthesia, the animal was intubated and artificially ventilated via the mechanical ventilator (55-7061, Harvard Apparatus, MA, USA). Followed by a bolus intravenous injection of ketamine-xylazine (20 mg/kg-2 mg/kg), the infusion rate was changed to 20 mg/kg/h-2 mg/kg/h, which is typically used in other functional studies.16,17 Vecuronium bromide (bolus: 2 mg/kg, maintenance dose: 2 mg/kg/h) was infused along with ketamine–xylazine to reduce motion artifacts. The animal was monitored for at least 50 min before the initiation of OCT imaging to ensure adequate anesthetic transition. Throughout the experiment, body temperature was maintained at 36.5–37.5℃ via a heating pad (55-7020, Harvard Apparatus, MA, USA) and blood pressure was monitored using a blood pressure transducer (72-4497, Harvard Apparatus, MA, USA) to ensure that the mean blood pressure was within the range of 80–120 mmHg. Heart rate, SpO2, and end-tidal pCO2 were also continuously monitored (Physio-Suite, Kent Scientific, CT, USA). Arterial blood gas analysis was performed periodically using a blood gas analyzer (i-stat1, ABBOTT, IL, USA) to maintain normal physiology (SO2 = 95–98%, PaCO2 = 35–45 mmHg, and PaO2 = 80–120 mmHg).
Swept-source OCT with OISI system
A schematic of the imaging system used in this study is shown in Figure 1. A wavelength-swept laser (WSL) with a center wavelength of 1.3 m and an A-line rate of 240 kHz were used as the light source. The system has an axial resolution of 10 m in tissue. A customized lens assembly was used as an objective (NA = 0.13, focal length = 30 mm) to achieve a 10 m transverse resolution, which provided a nearly isotropic resolution in three-dimensions. The incident optical power on the sample was 20 mW. Phase-stabilization was performed for quantitative Doppler OCT imaging. An additional interferometer was used to generate the optical clock signal for phase-stabilization as shown in dashed box A in Figure 1.18 At the rate of 240,000 A-lines/s, the maximum measurable flow speed without phase wrapping was ±55.7 mm/s in tissue when the direction of flow was parallel to the OCT beam. However, since the majority of pial arteries beneath the cranial window lies at an angle of 70–90° with respect to the imaging beam, the upper limit of the measurement becomes ±163 mm/s, sufficient for measuring the arterial flow in our experiment. The OISI system was designed to share the same objective lens with OCT as shown in the dashed box B in Figure 1. An LED with a center wavelength of 565 nm (M565L3, Thorlabs Inc., NJ, USA) in combination with a band-pass filter (560 ± 5 nm) was used for OISI imaging. Two-dimensional images of the exposed cortex were acquired using a CCD camera (acA780, BASLER, Ahrensburg, Germany). A flip mirror was used to switch between OCT and OISI.
Figure 1.

A schematic of the OCT and the OISI system. DAQ: data acquisition device; WSL: wavelength-swept laser; MZI: Mach-Zehnder interferometer; BR: balanced receiver; FBG: fiber Bragg grating; RM: reference mirror; CCD: charge-coupled device; GS: galvanometric mirror scanner; FM: flip mirror.
Hemodynamic analysis using OCTA and Doppler OCT
3D angiograms were acquired over a 1.45 mm × 1.45 mm area. Maximum projection (MP) was performed over 500 m from the tissue surface in the depth direction on the volumetric angiogram to facilitate visualization and analysis. OCTA was performed by computing speckle decorrelation normalized to have values between 0 and 1 from a pair of sequentially acquired B-scans at the same location.19 A total of four (or three) speckle decorrelation images from five (or four) repeated B-scans were averaged to generate a single cross-sectional angiogram. Since decorrelation signal increases with the speed of the red blood cell (RBC), it can be used as an indicator of RBC flow.13,20 The number of A-lines per B-scan was set to 700 with a scan duty cycle of 80% so that the inter B-scan time interval was 2.9 ms. The inter B-scan time interval determines the slowest detectable flow and the fastest distinguishable flow.20 We found that with the inter B-scan time interval of 2.9 ms, the blood flow speeds in most of the capillaries lie between the slowest detectable limit and the fastest distinguishable limit, which allowed us to qualitatively detect changes in capillary flow speed using OCTA. The imaging optics was designed to provide a field of view of 2 mm × 2 mm. However, we observed that vessel boundaries become slightly blurry due to the optical aberration at the edges of the OCT angiogram, and we decided to focus on the 1.45 mm × 1.45 mm field at the center. Although it is possible to achieve a larger imaging field at the expense of the transverse resolution, the current imaging field of view was chosen to obtain 10 m 3D isotropic resolution. The measurement depth was determined by the depth of focus of the OCT imaging optics. While OCT enables imaging of cortical layer more than 1 mm in depth by using near infrared light, vessels located deeper than 500 m from the cortical surface were not easily identified due to relatively small depth of focus.21 Therefore, our study focused on the hemodynamic change that occurred within a volume of 1.45 mm × 1.45 mm × 500 m. Diameters of various vascular compartments: arteries, veins, arterioles, and venules were measured using en face OCT angiograms, from which the vessel diameters were determined as the widths of the erythrocyte flows. Before measuring the diameter, the angiogram was binarized with the threshold value of 0.43 to clearly define the vessel boundaries by removing surrounding capillaries, most of which had decorrelation signals lower than 0.43. The decorrelation signals in the majority of arteries, arterioles, veins, and venules were already close to the saturation limit and the mean decorrelation value of those vessels was 0.58 ± 0.04 (mean ± SD). The decorrelation signals in capillaries were typically lower than those in larger vessels due to their low flow speed, and the mean decorrelation value in capillaries was 0.27 ± 0.02 (mean ± SD). The threshold value of 0.43 was chosen as a mean of 0.58 and 0.27. The width of the vessel measured in the binarized OCT angiogram was defined as the vessel diameter. Doppler cross-sectional images were obtained by computing phase differences between sequential A-lines. A total of 5000 A-lines were acquired per B-scan with a scan duty cycle of 95%. Each of the final Doppler images was generated by averaging three Doppler cross-section images repeatedly acquired at the same location to improve image quality. The cross-sectional area and the mean flow speed of the vessel were measured for quantitative analysis of arterial blood flow changes. A pial artery was scanned across the width of the vessel in the fast scan (x-) direction. Each vessel in the cross-sectional Doppler image was segmented, and the cross-sectional area was measured by multiplying the number of pixels within the closed contour encompassing the vessel by the size of a pixel. The mean value of velocities for all pixels within the vessel contour was taken as the mean velocity. The velocity was calculated using the following equation22
( = center wavelength of the light source, = phase difference between two A-lines at a given depth position z, = refractive index of tissue = time interval between the A-lines, and = angle between the OCT beam and the vessel).
Following the Doppler imaging, a single volumetric angiogram of 500 m × 500 m × 500 m was acquired to measure the angle between the OCT beam and the vessel at the center (see Supplementary Figure S3 for more details). Total blood flow of the artery was derived by multiplying the mean flow speed by the cross sectional vessel area, where the direction of the flow was perpendicular to the vessel area. The flow velocity that corresponds to radian is the maximum detectable velocity, limited by phase wrapping artifacts. The minimum detectable velocity is determined by the phase noise of the system, measured as 0.2 radians in the brain tissue. Therefore, the flow velocity corresponding to radians is the minimum detectable velocity of the system. The velocity is inversely proportional to cosine of the angle as shown in the above equation, and the relative changes of the flow speed were calculated by measuring only the phase difference as the direction of flow remained fixed during imaging. All image processing was performed using MATLAB (The MathWorks Inc., MA, USA).
Stimulation paradigm and imaging protocols
Stimulation paradigm
A single whisker was stimulated using a mechanical stimulator composed of a bender actuator (E-650.00, PI) and a piezo bender (PL140.11, PI). The whisker was placed at the tip of the bender using a custom holder. All whiskers at the ipsilateral and contralateral sides were removed except one contralateral E1 whisker, which was trimmed to a length of 10 mm. A 5 Hz sinusoidal stimulation pulse made the whisker vibrate with an amplitude of 2–3 mm at 2 mm from the mystacial pad.
OISI protocol
OISI was performed before and after OCT imaging to identify the center of response and to verify that the amplitude of the response is maintained during anesthesia. The site of activation was manually selected so that it included the region with prominent signal changes. Two-dimensional images were continuously acquired with a CCD camera for 30 s. Two seconds after the onset of image acquisition, a 5 Hz whisker stimulus was applied for 2 s. In order to generate the OISI image, a total of 30 stimulation trials were repeated with an inter-stimulus interval of 28 s and averaged prior to computing the fractional intensity difference between the baseline and response images.23
OCTA protocol 1
A conventional raster scanning OCTA protocol was applied to monitor hemodynamic changes in response to stimuli of a relatively long duration (Figure 2(a)). Six volumetric angiograms were acquired continuously. Each volumetric angiogram was acquired in 7.3 s and comprised 500 cross-sectional angiograms uniformly distributed with a 2.9-m spacing in the slow scan (y-) direction. No stimulus was applied during the acquisition of the first three volumes. The stimulus was initiated with the onset of the acquisition of the fourth volume and it lasted until the end of the last volume acquisition. The first three and the last three angiograms were averaged separately to generate the baseline and response images, respectively.
Figure 2.

OCTA scanning protocols. (a) A repeated raster scanning protocol was implemented to monitor hemodynamic changes in response to stimuli of a duration of 21.9 s. The first three and the last three volumes were averaged separately to generate the baseline and response images, respectively. The effective temporal resolution was 21.9 s. (b) A single composite volume was acquired over four stimulation trials in order to image hemodynamic responses with high temporal resolution. The effective temporal resolution was 0.7 s.
OCTA protocol 2
The OCTA protocol to achieve a high volume acquisition rate is illustrated in Figure 2(b). In order to observe rapid hemodynamic responses, we repeatedly acquired 47 volumes. Each volume consisted of 60 cross-sectional angiograms uniformly distributed with a 24 m spacing in the slow scan (y-) direction each. The stimulus was initiated with the onset of the acquisition of the third volume and it lasted until the end of the sixth volume acquisition. As a result, a total of four OCT volumes (third, fourth, fifth, and sixth volumes) were acquired during stimulus. Following the acquisition of the first 47 volumes, three more sets of 47 volumetric angiogram acquisitions were repeated with the identical stimulation protocol but with cross-sectional angiograms constituting each set of volumes shifted by 6 m, 12 m, and 18 m in the slow scan direction. Combining these data resulted in a temporal series of 3D angiograms with stimuli of 2.8 s duration and an inter-stimulus interval of 30.1 s, where each 3D angiogram consisted of 240 cross-sections (60 cross-sections × 4 trials) over a 1.45 mm × 1.45 mm field of view with a temporal resolution of 0.7 s. The aforementioned procedure was repeated eight times, which provided eight 3D angiograms for each time point with respect to the stimulus onset. These eight 3D angiograms were averaged in order to suppress the effects of spontaneous vasomotion, and cardiac and respiratory cycles.8
Doppler OCT protocol 1
Cross-sectional Doppler OCT imaging was performed to investigate spontaneous changes in arterial blood flow. No sensory stimulus was applied during the imaging. A single pial artery was repeatedly scanned at a fixed y position. Each cross-sectional Doppler image was acquired in 0.0625 s, which was sufficient for resolving pulsatility.
Doppler OCT protocol 2
Another Doppler OCT protocol was used to measure functionally evoked changes in arterial blood flow. A pial artery was repeatedly scanned over a 0.5 mm × 0.12 mm field of view. Scanning was performed over vertical strips of 0.12 mm at 10 horizontal positions. Each volume was acquired in 0.625 s. Scanning at 10 different positions enabled measurement of the average blood flow response over the vessel segment. A total of 69 Doppler volumes were acquired sequentially during a single stimulation trial. A stimulus was applied for 3.75 s, starting at the acquisition of the fourth Doppler volume. The aforementioned procedure was repeated 12 times with the inter-stimulus interval of 39.4 s and data from the 12 stimulation trials were averaged to measure the changes in arterial blood flow.
Results
Measuring hemodynamic changes using OCTA protocol 1
Figure 3(a) shows a CCD image of the cranial window showing arteries (A1 and A2) and veins (V1 and V2) located on the pial surface. The corresponding OISI image is shown in Figure 3(b). Figure 3(c) represents an en face OCT angiogram of the region of activation, indicated by a white square in Figure 3(b). Regions showing largest dilation for each of the vessels, A1, A2, V1, and V2 are indicated with rectangular boxes (region a, b, c, and d) on the OCT angiogram (Figure 3(c)). Stimulus-induced hemodynamic changes for these regions are presented as a movie clip (Supplementary video S1). Prior to the measurement of the vessel diameter, the angiogram was binarized with the fixed threshold value as described in the section titled ‘Hemodynamic analysis using OCTA and Doppler OCT’. Figure 3(d) shows binarized images of the selected regions a, b, c, and d. Figure 3(e) shows relative changes in the diameters of the vessels measured from the selected regions. As shown in Supplementary Video S1 and Figure 3(e), arteries (A1 and A2) dilate more than veins (V1 and V2), which agrees with previous studies that arteries and arterioles rather than other vascular compartments contribute significantly to a stimulus-induced blood volume increase.8,14 For capillaries, the diameter could not be measured due to the insufficient spatial resolution. However, the decorrelation signal increased in multiple capillaries during stimulation (Supplementary video S2). Relative changes in the decorrelation signal in capillaries were measured and overlaid on the gray-scale angiogram as shown in Figure 3(f). The decorrelation signal increased in the majority of capillaries during the 21.9-s stimulus. However, it should be noted that since the inter B-scan time interval used in this study is close to the saturation limit, a 3% increase in the decorrelation signal, for example, does not necessarily correspond to a 3% increase in capillary blood flow speed. Furthermore, since capillaries exhibit a highly heterogeneous functional response, capillaries showing magnitude-of-change below 3% were excluded from analysis for better visualization.24,25 The result supports previous studies performed using TPLSM that the expanded volume of arterial blood resulted in an increase in capillary blood flow.8 A similar result using OCTA was also reported previously in the rat retina, where visual flicker stimulus induced the decorrelation signal increase in capillaries.26
Figure 3.
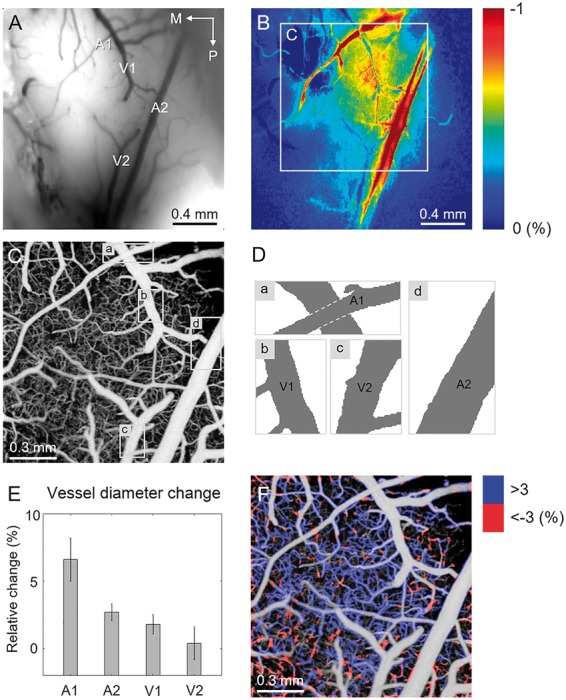
Measurements of hemodynamic changes in response to the 21.9-s-long single whisker stimulus using OCTA protocol 1. (a) A CCD image of the rat cranial window showing major branches of arteries (A1 and A2) and veins (V1 and V2). M: medial and P: posterior. (b) An OISI image showing localized response induced by the single-whisker stimulation. (c) A depth-projected en face OCT angiogram of the activated area corresponding to the region indicated by the white square in b. (d) Binarized images of the selected regions in c. (e) Relative changes in diameters of the arteries, A1 and A2, and veins, V1 and V2 measured from the binarized images in d. (f) Relative changes in the speckle decorrelation signal in capillaries color-coded and overlaid on the gray-scale en face OCT angiogram.
Investigating a rapid hemodynamic response using OCTA protocol 2
Spatiotemporal characteristics of hemodynamic response were investigated using OCTA protocol 2 in four different animals (N = 4). OCT angiograms were acquired at the site of activation identified by the OISI (for more details, see the section titled ‘Stimulation paradigm and imaging protocols’). The regions of activation are shaded in yellow in the OCT angiograms acquired from the four animals as shown in Supplementary Figure S1. Representative temporal series of OCT angiograms are shown as a movie clip (Supplementary video S3). Figure 4(b) shows relative changes in vessel diameters over time for vessel segments indicated in Figure 4(a). During the single-whisker stimulation, the pial artery shows prominent dilation along the entire vascular tree in the field of view (blue curves in Figure 4(b)). However, neighboring veins do not show significant dilation (green curves in Figure 4(b)). Arterioles show varying degrees of response (red curves in Figure 4(b)). For example, while arterioles 3 and 4 both bifurcate from the same upstream vessel, the peak response amplitudes are different by ∼15%. This result may stem from the fact that the degree of dilation for an individual arteriole depends on its location where stronger and faster dilation occurs closer to the center of the activation site, while subtle or negative changes are observed in non-activated regions.27 Venules adjacent to the arteries also show an increase in diameters (magenta curves in Figure 4(b)), but to a lesser degree compared to strongly dilated arterioles. The dilation of vessels at the site of activation must be associated with the dilation of upstream arterioles or arteries in order to effectively perfuse blood.28 Our result shows that the vascular adjustments occur in the large pial artery at least up to ∼1 mm away (blue box 2 in Figure 4(a)) from where one of the activated arterioles bifurcates (red box 3 in Figure 4(a)). Decorrelation signals in some arterioles and venules were barely higher or even lower than the threshold level of 0.43 used for segmenting arteries and veins due to relatively low flow speeds. Because the decorrelation signals in such arterioles and venules were not immediately distinguishable from the signals in surrounding capillaries, the vessel boundaries could not be clearly defined. Therefore, such arterioles and venules were excluded from analysis. The mean vascular response for all animals is shown in Figure 4(d). Peak activations occurred at 2.8 s after the stimulus onset in all vascular compartments. Arterioles showed the largest dilation, whereas veins showed relatively negligible dilation. Temporal changes in the diameter of individual arterioles are shown in Supplementary Figure S2. Even the mean response in venules was smaller than that in larger arteries (Figure 4(d)). This result supports the importance of arteries and arterioles in a sensory-induced increase in blood volume.
Figure 4.

Investigation of the rapid hemodynamic response using OCTA protocol 2. (a) An en face OCT angiogram with the regions where vessel diameters are measured indicated with colored boxes. Blue, red, green, and magenta color boxes represent arterial, arteriolar, venous, and venular segments, respectively. A: anterior; L: lateral. (b) Changes in vessel diameters as a function of time for the vessels indicated in A. Blue, red, green, and magenta curves represent arterial, arteriolar, venous, and venular segments, respectively. (c) En face OCT angiograms of four different animals. The vessel segments used for the analysis are indicated in the same manner as in (a). (d) The average relative hemodynamic responses (mean ± SD) for the select arteries, veins, arterioles, and venules. The vessel diameters measured at baseline (mean ± SD) are indicated. Diameters measured immediately before the stimulation onset were taken as baselines.
Temporal changes of the decorrelation signal in the capillary bed were also investigated using the same data. Regions of the capillary bed were manually selected within the angiogram as shown in Figure 5(a). In Figure 5(b), average signal change for all regions close to the activation site is shown as a red solid curve. The mean signal change for the periphery regions is shown as a blue solid curve. The mean decorrelation signals in both regions clearly increase during stimulus. However, the regions near activation site show a larger increase in the decorrelation signal compared to the regions in the periphery. Consistent results were observed in all four animals. Changes in the decorrelation signal were hardly observed in the majority of arteries, arterioles, veins, and venules mainly because the signals in these vessels were already beyond or close to the saturation limit (or the fastest distinguishable limit). Note that even the relative changes in the decorrelation signal observed in many of the capillaries probably underestimate the actual relative changes in blood flow speed due to the relatively long inter B-scan time interval used in this experiment. Angiograms acquired at a given time point with respect to the stimulus onset were spatially aligned and averaged to compute the relative changes in the decorrelation signal in individual capillaries. The resulting spatiotemporal changes in the decorrelation signal are shown in Figure 5(c) and Supplementary Video S4. Only capillaries that showed more than 3% increase in the decorrelation signal were selected and shaded in blue. Prominent changes in the decorrelation signal were observed close to the activation site, indicated by the yellow contour on the angiogram in Figure 5(a).
Figure 5.

Investigation of the hemodynamic changes in capillaries through measurement of changes in the decorrelation signals. (a) Regions of the capillary bed were manually segmented on the en face angiogram as indicated by the gray-dashed contour. The activation site is indicated by the yellow circular contour with a diameter of 650 m. The regions close to activation site are shaded in red and the regions on the periphery are shaded in blue. (b) The mean changes in the signals for the regions close to activation site and for the regions on the periphery are shown as a red and a blue curves, respectively. (c) Spatiotemporal changes in the decorrelation signals in capillaries (in Animal 2). Capillaries that show more than 3% increase in the signals are shaded in blue. The signal measured immediately before the stimulation onset was taken as a baseline.
Quantitative measurement of arterial blood flow using the Doppler OCT protocols 1 and 2
The transverse flow speed profile and pulsatile flow changes of pial artery were measured using Doppler OCT protocol 1 (Supplementary Figure S3). In order to measure stimulus-induced changes in the vessel area and flow speed quantitatively, with minimal effects from the spontaneous fluctuation and pulsatility, the Doppler OCT protocol 2 (5.4.6) was used. One of the typical features of surface vasculature of rat barrel cortex is the posteromedial course of the several branches of the middle cerebral artery (MCA) as shown in Supplementary Figure S1.29 Among arterial branches, an artery that showed prominent response in OISI image was considered as a major artery that directly supplied blood to downstream arterioles close to the activation site (Figure 6(a) and (b)). Doppler imaging was performed at the corresponding artery. A total of six different animals were used (N = 6) and the measurement was performed in a single artery in each animal (n = 6 vessels). The size of arteries used for the measurement was 102 ± 17 (mean ± SD). Sensory-evoked changes in cross-sectional area, mean flow speed, and total blood flow of an artery were measured using Doppler OCT protocol 2 (Figure 6(c)). The cross-sectional area of the upstream artery clearly increased during stimulus, whereas the mean flow speed showed changes that were barely detectable by the Doppler measurement. Similar results were observed in all other animals and the mean changes of all the arteries are shown in Figure 6(d). Previous studies suggested that in smaller arterioles with diameters ranging from 10 to 40 , an increase in blood flow results from an increase in both flow speed and vascular volume.8,30–32 Our result suggests the possibility that the flow adjustment may occur differently depending on the size of the vessel although further investigation is needed.
Figure 6.
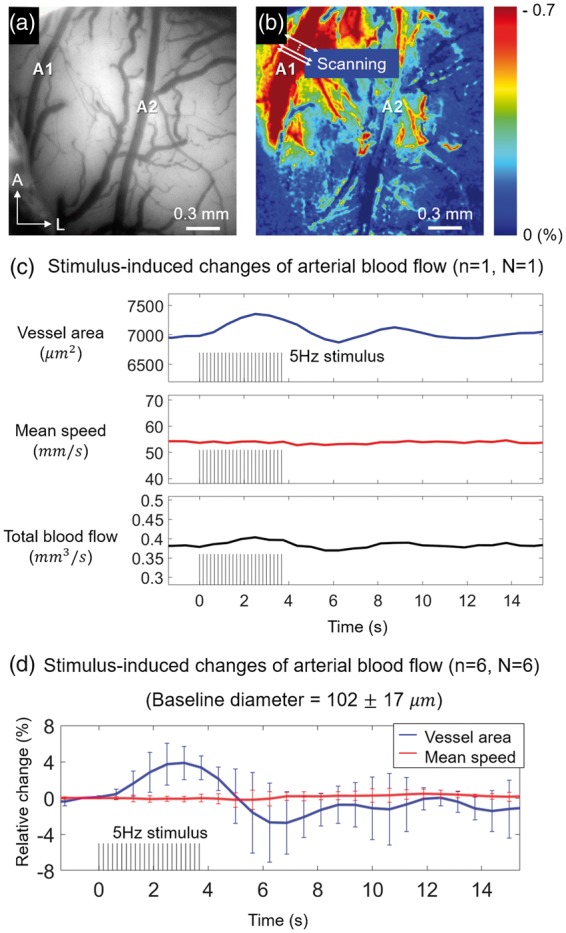
Quantitative measurement of arterial hemodynamic response using the Doppler OCT scanning protocol 2. (a) A CCD image of a cranial window showing branches of MCA indicated by the letters A1 and A2. (b) OISI image of the corresponding window showing an artery (A1) with a prominent response. (c) Stimulus-induced changes in cross-sectional vessel area, mean flow speed, and total blood flow of an artery at the upstream of activation site. The temporal resolution was 0.625 s. (d) Mean changes in the vessel area and the mean blood flow speed for all animals. The error bars indicate the standard deviations of the measurements from six arteries (n = 6) in six different animals (N = 6).
Discussion and conclusion
We investigated local hemodynamic changes in response to single-whisker stimulation using OCT. For OCTA, two different scan protocols were used. The repeated raster-scan protocol enabled measurement of changes in the diameter and decorrelation signal in multiple vessels by simply acquiring angiographic volumes repeatedly. Using this protocol, we could clearly identify the stimulus-induced hemodynamic changes with a minimum number of stimuli required per data set. However, the effective temporal resolution may not be sufficient for capturing fast functional hemodynamic responses, which typically require the temporal resolution in the range of a second. Analogous to the gated scan protocols frequently used in various studies in cardiology, a scan protocol that could generate a single composite volume from multiple stimulation trials was designed and utilized in order to achieve a high effective temporal resolution of 0.7 s. This required reduction of the transverse scan density in the slow scan direction. To compensate for the low scan density, multiple volumes were acquired with slight offsets in the slow scan direction, which were later combined to generate a composite volume in post-processing. The main challenge with this protocol is that each of the raw volumes constituting a single composite volume requires a separate stimulation trial. It should be noted that the scan protocols should be carefully designed depending on the exact nature of the phenomenon under investigation.
Sensory-evoked changes in both vessel diameter and capillary hemodynamics were monitored over a relatively wide field of view of 1.45 mm × 1.45 mm using OCTA. Our observation showed prominent dilation of downstream arterioles with modest dilation of upstream arteries, which are several hundreds of micrometers away from the arterioles. On the other hand, veins show a relatively negligible dilation. Although the difference is subtle, it is important to note that the diameter measured using OCTA is the diameter of erythrocyte flow, not the actual lumen diameter. There may exist a very thin layer of RBC depletion near the vessel wall due to the Fahraeus–Lindqvist effect.33 Low scattering of OCT light from the plasma in the absence of RBCs implies that the OCTA signal may not be sufficiently strong near the vessel wall.14 Furthermore, an increase in erythrocyte flow speed without vessel dilation may appear as slight dilation in the OCT angiogram because the decorrelation signal in general increases with the RBC speed. Nevertheless, our results clearly show that arterial and arteriolar compartments contribute more to the sensory-evoked increase in blood volume than similar-sized venous and venular compartments. This agrees with previous observation using TPLSM, which can measure the inner diameter of lumen.8
An increase in the speckle decorrelation signal in capillaries can be interpreted as an overall increase in capillary blood flow. The speckle decorrelation signal becomes sensitive to the speed when the inter B-scan time interval is adjusted so that RBCs move a distance corresponding to a few or a few tens of percent of the spatial resolution of the OCT system during the time interval. If the displacement of RBCs during the inter B-scan time interval is comparable to, or longer than the size of the resolution due to the faster speed of the RBCs, the speckle decorrelation signal approaches, or goes beyond the saturation limit. During the inter B-scan time interval of 2.9 ms, the displacement of many RBCs in the capillaries is in a range of a few to a few tens of percent of the isotropic resolution (10 m) of the OCT system, which agrees with the typical range of capillary RBC speed (0.2–2 mm/s).7,11 Nevertheless, there also must be a significant portion of RBCs that travel faster than the fastest distinguishable limit. It should be noted that when the RBC speed is close to or beyond the limit, the relative increase in the decorrelation signal underestimates the actual relative increase in the RBC speed. Regardless, Figures 3(f) and 5(c) clearly show the sensory-evoked increase in capillary blood flow, at least qualitatively.
Since the inter B-scan time interval is coupled with the number of A-lines per B-scan, the transverse sampling density also needs to be taken into account in deciding the time interval. The inter B-scan time interval of 2.9 ms with a scan amplitude of 1.45 mm corresponds to the sampling density of 2.6 m/A-line. Although further investigation is required to determine the smallest achievable inter B-scan time interval without sacrificing the image quality, we showed that the inter B-scan time interval of 2.9 ms is adequate for achieving high image quality and detecting RBC speed changes.
Doppler OCT enables fully quantitative measurement of changes in blood flow. Depth-resolved speed measurement was performed to monitor the flow change over the entire cross-sectional area of a pial artery. However, vessels smaller than arteries are not well visualized in the inter A-line Doppler images, since the flow speed in smaller vessels is usually lower than the detectable limit. Inter B-scan Doppler OCT may be used for measurements of blood flow speed in capillaries, while inter B-scan OCTA used in this study provides semi-quantitative blood flow speed information in capillaries.
In summary, OCTA and Doppler OCT were utilized to investigate hemodynamic responses during the single-whisker stimulation in the rat somatosensory cortex. Both spatial and temporal changes in diameters of various vessel compartments were simultaneously monitored using OCTA. Increases in the speckle decorrelation signals in multiple capillaries were also observed, which may indicate an overall capillary blood flow increase during the sensory stimulation. Furthermore, the Doppler OCT technique enabled quantitative measurements of spontaneous and functional changes in arterial blood flow. The results of this study suggest that OCT can be highly useful in the investigation of neurovascular coupling in the rodent brain.
Supplemental Material
Supplemental material, Supplementary figures for Quantitative hemodynamic analysis of cerebral blood flow and neurovascular coupling using optical coherence tomography angiography by Paul Shin, WooJhon Choi, JongYoon Joo and Wang-Yuhl Oh in Journal of Cerebral Blood Flow & Metabolism
Funding
The author(s) disclosed receipt of the following financial support for the research, authorship, and/or publication of this article: This work was supported by the National Research Foundation of Korea [Grant No. 2016M3C7A1913844]; and by the Ministry of Health and Welfare of Korea [Grant No. HI15C0001].
Declaration of conflicting interests
The author(s) declared no potential conflicts of interest with respect to the research, authorship, and/or publication of this article.
Authors’ contributions
PS and WJC contributed to the design and development of the imaging system. PS and JYJ carried out the experiments. PS performed data analysis and interpretation of data. WJC provided critical feedback for data analysis. WYO supervised the project. PS, WJC, and WYO discussed the results and contributed to the final manuscript.
Supplementary material
Supplementary material for this paper can be found at the journal website: http://journals.sagepub.com/home/jcb
References
- 1.Ter-Pogossian MM, Phelps ME, Hoffman EJ, et al. A positron-emission transaxial tomograph for nuclear imaging (PETT). Radiology 1975; 114: 89–98. [DOI] [PubMed] [Google Scholar]
- 2.Ogawa S, Tank DW, Menon R, et al. Intrinsic signal changes accompanying sensory stimulation: functional brain mapping with magnetic resonance imaging. Proc Natl Acad Sci U S A 1992; 89: 5951–5955. [DOI] [PMC free article] [PubMed] [Google Scholar]
- 3.Grinvald A, Lieke E, Frostig RD, et al. Functional architecture of cortex revealed by optical imaging of intrinsic signals. Nature 1986; 324: 361–364. [DOI] [PubMed] [Google Scholar]
- 4.Fox PT, Raichle ME. Focal physiological uncoupling of cerebral blood flow and oxidative metabolism during somatosensory stimulation in human subjects. Proc Natl Acad Sci U S A 1986; 83: 1140–1144. [DOI] [PMC free article] [PubMed] [Google Scholar]
- 5.Mandeville JB, Marota JJ, Ayata C, et al. MRI measurement of the temporal evolution of relative CMRO(2) during rat forepaw stimulation. Magn Reson Med 1999; 42: 944–951. [DOI] [PubMed] [Google Scholar]
- 6.Denk W, Strickler JH, Webb WW. Two-photon laser scanning fluorescence microscopy. Science 1990; 248: 73–76. [DOI] [PubMed] [Google Scholar]
- 7.Kleinfeld D, Mitra PP, Helmchen F, et al. Fluctuations and stimulus-induced changes in blood flow observed in individual capillaries in layers 2 through 4 of rat neocortex. Proc Natl Acad Sci U S A 1998; 95: 15741–15746. [DOI] [PMC free article] [PubMed] [Google Scholar]
- 8.Drew PJ, Shih AY, Kleinfeld D. Fluctuating and sensory-induced vasodynamics in rodent cortex extend arteriole capacity. Proc Natl Acad Sci U S A 2011; 108: 8473–8478. [DOI] [PMC free article] [PubMed] [Google Scholar]
- 9.Srinivasan VJ, Atochin DN, Radhakrishnan H, et al. Optical coherence tomography for the quantitative study of cerebrovascular physiology. J Cereb Blood Flow Metab 2011; 31: 1339–1345. [DOI] [PMC free article] [PubMed] [Google Scholar]
- 10.Huang D, Swanson EA, Lin CP, et al. Optical coherence tomography. Science 1991; 254: 1178–1181. [DOI] [PMC free article] [PubMed] [Google Scholar]
- 11.Lee J, Wu W, Lesage F, et al. Multiple-capillary measurement of RBC speed, flux, and density with optical coherence tomography. J Cereb Blood Flow Metab 2013; 33: 1707–1710. [DOI] [PMC free article] [PubMed] [Google Scholar]
- 12.Vakoc BJ, Lanning RM, Tyrrell JA, et al. Three-dimensional microscopy of the tumor microenvironment in vivo using optical frequency domain imaging. Nat Med 2009; 15: 1219–1223. [DOI] [PMC free article] [PubMed] [Google Scholar]
- 13.Lee J, Jiang JY, Wu W, et al. Statistical intensity variation analysis for rapid volumetric imaging of capillary network flux. Biomed Opt Exp 2014; 5: 1160–1172. [DOI] [PMC free article] [PubMed] [Google Scholar]
- 14.Radhakrishnan H, Srinivasan VJ. Compartment-resolved imaging of cortical functional hyperemia with OCT angiography. Biomed Opt Exp 2013; 4: 1255–1268. [DOI] [PMC free article] [PubMed] [Google Scholar]
- 15.Srinivasan VJ, Sakadzic S, Gorczynska I, et al. Depth-resolved microscopy of cortical hemodynamics with optical coherence tomography. Opt Lett 2009; 34: 3086–3088. [DOI] [PMC free article] [PubMed] [Google Scholar]
- 16.Franceschini MA, Radhakrishnan H, Thakur K, et al. The effect of different anesthetics on neurovascular coupling. Neuroimage 2010; 51: 1367–1377. [DOI] [PMC free article] [PubMed] [Google Scholar]
- 17.Oria M, Chatauret N, Raguer N, et al. A new method for measuring motor evoked potentials in the awake rat: effects of anesthetics. J Neurotrauma 2008; 25: 266–275. [DOI] [PubMed] [Google Scholar]
- 18.Choi W, Potsaid B, Jayaraman V, et al. Phase-sensitive swept-source optical coherence tomography imaging of the human retina with a vertical cavity surface-emitting laser light source. Opt Lett 2013; 38: 338–340. [DOI] [PMC free article] [PubMed] [Google Scholar]
- 19.Park JR, Choi W, Hong HK, et al. Imaging laser-induced choroidal neovascularization in the rodent retina using optical coherence tomography angiography. Invest Ophthal Visual Sci 2016; 57: OCT331–OCT340. [DOI] [PubMed] [Google Scholar]
- 20.Moult E, Choi W, Waheed NK, et al. Ultrahigh-speed swept-source OCT angiography in exudative AMD. Ophthal Surg Lasers Imag Retina 2014; 45: 496–505. [DOI] [PMC free article] [PubMed] [Google Scholar]
- 21.Chong SP, Merkle CW, Cooke DF, et al. Noninvasive, in vivo imaging of subcortical mouse brain regions with 1.7 mum optical coherence tomography. Opt Lett 2015; 40: 4911–4914. [DOI] [PMC free article] [PubMed] [Google Scholar]
- 22.Leitgeb R, Schmetterer L, Drexler W, et al. Real-time assessment of retinal blood flow with ultrafast acquisition by color Doppler Fourier domain optical coherence tomography. Opt Exp 2003; 11: 3116–3121. [DOI] [PubMed] [Google Scholar]
- 23.Harrison TC, Sigler A, Murphy TH. Simple and cost-effective hardware and software for functional brain mapping using intrinsic optical signal imaging. J Neurosci Methods 2009; 182: 211–218. [DOI] [PubMed] [Google Scholar]
- 24.Stefanovic B, Hutchinson E, Yakovleva V, et al. Functional reactivity of cerebral capillaries. J Cereb Blood Flow Metab 2008; 28: 961–972. [DOI] [PMC free article] [PubMed] [Google Scholar]
- 25.Schulte ML, Wood JD, Hudetz AG. Cortical electrical stimulation alters erythrocyte perfusion pattern in the cerebral capillary network of the rat. Brain Res 2003; 963: 81–92. [DOI] [PubMed] [Google Scholar]
- 26.Choi W, Baumann B, Clermont AC, et al. Functional imaging of hemodynamic stimulus response in the rat retina with ultrahigh-speed spectral/Fourier domain OCT. In: Proceedings Volume 8567, Ophthalmic Technologies XXIII; 85671C, SPIE BiOS, 2013, San Francisco, USA, 6 March 2013. DOI: 10.1117/12.2004096.
- 27.Devor A, Hillman EM, Tian P, et al. Stimulus-induced changes in blood flow and 2-deoxyglucose uptake dissociate in ipsilateral somatosensory cortex. J Neurosci 2008; 28: 14347–14357. [DOI] [PMC free article] [PubMed] [Google Scholar]
- 28.Iadecola C. Regulation of the cerebral microcirculation during neural activity: is nitric oxide the missing link? Trends Neurosci 1993; 16: 206–214. [DOI] [PubMed] [Google Scholar]
- 29.Cox SB, Woolsey TA, Rovainen CM. Localized dynamic changes in cortical blood flow with whisker stimulation corresponds to matched vascular and neuronal architecture of rat barrels. J Cereb Blood Flow Metab 1993; 13: 899–913. [DOI] [PubMed] [Google Scholar]
- 30.Fernandez-Klett F, Offenhauser N, Dirnagl U, et al. Pericytes in capillaries are contractile in vivo, but arterioles mediate functional hyperemia in the mouse brain. Proc Natl Acad Sci U S A 2010; 107: 22290–22295. [DOI] [PMC free article] [PubMed] [Google Scholar]
- 31.Ngai AC, Winn HR. Estimation of shear and flow rates in pial arterioles during somatosensory stimulation. Am J Physiol 1996; 270: H1712–H1717. [DOI] [PubMed] [Google Scholar]
- 32.Shih AY, Driscoll JD, Drew PJ, et al. Two-photon microscopy as a tool to study blood flow and neurovascular coupling in the rodent brain. J Cereb Blood Flow Metab 2012; 32: 1277–1309. [DOI] [PMC free article] [PubMed] [Google Scholar]
- 33.Fåhræus R, Lindqvist T. The viscosity of the blood in narrow capillary tubes. Am J Physiol 1931; 96: 562–568. [Google Scholar]
Associated Data
This section collects any data citations, data availability statements, or supplementary materials included in this article.
Supplementary Materials
Supplemental material, Supplementary figures for Quantitative hemodynamic analysis of cerebral blood flow and neurovascular coupling using optical coherence tomography angiography by Paul Shin, WooJhon Choi, JongYoon Joo and Wang-Yuhl Oh in Journal of Cerebral Blood Flow & Metabolism