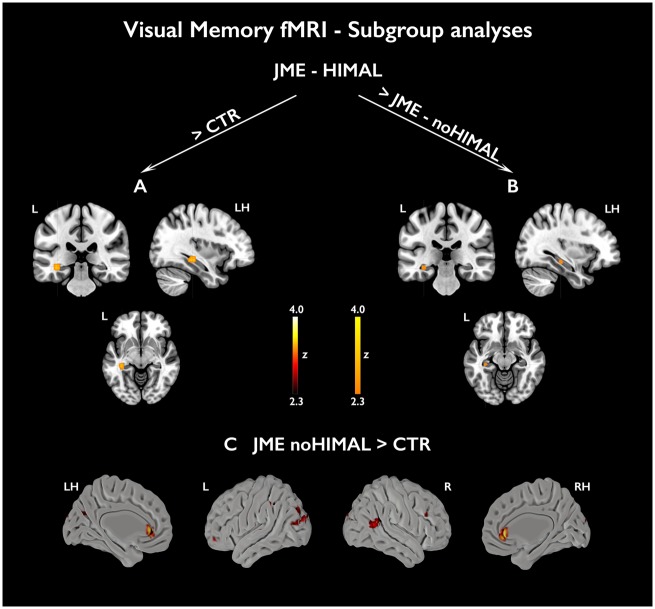
Figure 5.
Subgroup analyses for subsequent visual memory. The figure shows subgroup analyses comparing mesiotemporal activation for subsequently remembered visual items (FR − FF) in JME with and without HIMAL against healthy controls (A and C, respectively), along with the direct contrast of JME with and without HIMAL (B). Statistical maps for mesiotemporal activations (orange-yellow scale) show voxels included in the 12-mm diameter spheres used for multiple comparison correction, where peak-level significance at P < 0.05-FWE corresponds to z-scores >2.3. Extra-mesiotemporal activations are displayed at an uncorrected threshold (P < 0.01, cluster extent threshold of 10 voxels; ‘hot’ colour scale). ‘LH/RH’ refers to a sagittal section of the left/right hemisphere, respectively. Colour bars reflect z-score scales for mesiotemporal (right) and extra-mesiotemporal (left) activations. MNI coordinates are provided in Supplementary Table 5.

