Abstract
Background
Previous studies showed that nicotinized electronic cigarettes (hereafter, e-cigarettes) elicit systemic oxidative stress and inflammation. However, the effect of the aerosol alone on endothelial function is not fully understood.
Purpose
To quantify surrogate markers of endothelial function in nonsmokers after inhalation of aerosol from nicotine-free e-cigarettes.
Materials and Methods
In this prospective study (from May to September 2018), nonsmokers underwent 3.0-T MRI before and after inhaling nicotine-free e-cigarette aerosol. Peripheral vascular reactivity to cuff-induced ischemia was quantified by temporally resolving blood flow velocity and oxygenation (SvO2) in superficial femoral artery and vein, respectively, along with artery luminal flow-mediated dilation. Precuff occlusion, resistivity index, baseline blood flow velocity, and SvO2 were evaluated. During reactive hyperemia, blood flow velocity yielded peak velocity, time to peak, and acceleration rate (hyperemic index); SvO2 yielded washout time of oxygen-depleted blood, rate of resaturation, and maximum SvO2 increase (overshoot). Cerebrovascular reactivity was assessed in the superior sagittal sinus, evaluating the breath-hold index. Central arterial stiffness was measured via aortic pulse wave velocity. Differences before versus after e-cigarette vaping were tested with Hotelling T2 test.
Results
Thirty-one healthy never-smokers (mean age, 24.3 years ± 4.3; 14 women) were evaluated. After e-cigarette vaping, resistivity index was higher (0.03 of 1.30 [2.3%]; P < .05), luminal flow-mediated dilation severely blunted (−3.2% of 9.4% [−34%]; P < .001), along with reduced peak velocity (−9.9 of 56.6 cm/sec [−17.5%]; P < .001), hyperemic index (−3.9 of 15.1 cm/sec2 [−25.8%]; P < .001), and delayed time to peak (2.1 of 7.1 sec [29.6%]; P = .005); baseline SvO2 was lower (−13 of 65 %HbO2 [−20%]; P < .001) and overshoot higher (10 of 19 %HbO2 [52.6%]; P < .001); and aortic pulse wave velocity marginally increased (0.19 of 6.05 m/sec [3%]; P = .05). Remaining parameters did not change after aerosol inhalation.
Conclusion
Inhaling nicotine-free electronic cigarette aerosol transiently impacted endothelial function in healthy nonsmokers. Further studies are needed to address the potentially adverse long-term effects on vascular health.
© RSNA, 2019
Summary
Nicotine-free electronic cigarette aerosol inhalation in young, healthy nonsmokers resulted in transient impairment of vascular reactivity and endothelial function by using quantitative MRI metrics across multiple vascular beds.
Key Results
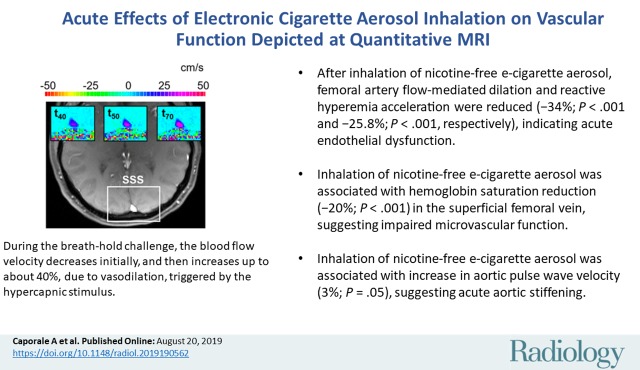
■ After inhalation of nicotine-free electronic cigarette aerosol, femoral artery flow-mediated dilation and reactive hyperemia acceleration were reduced (−34%, P < .001; −25.8%, P < .001, respectively), indicating acute endothelial dysfunction.
■ Inhalation of nicotine-free electronic cigarette aerosol was associated with hemoglobin saturation reduction (−20%; P < .001) in the superficial femoral vein, suggesting impaired microvascular function.
■ Inhalation of nicotine-free electronic cigarette aerosol was also associated with increase in aortic pulse wave velocity (3%; P = .05), suggesting acute aortic stiffening.
Introduction
Electronic cigarettes (hereafter, e-cigarettes) deliver nicotine by the electric heating and aerosolization of a flavored solution, or e-liquid (1). E-cigarettes are a public health issue because of their widespread use, especially among teenagers, despite uncertainty about their effect on long-term health (2). Many studies now question whether e-cigarette aerosol inhalation, or vaping, is safe (3–11), and it was found to cause vascular endothelial damage (8,9) and alterations in vascular tone (10,11). The basic constituents of e-liquids, primarily propylene glycol and glycerol, can form irritant acetals even at room temperature (3) and carcinogens at typical working device temperatures (5,6). Moreover, metals in the form of fine (diameter < 2.5 μm) and ultrafine (diameter < 100 nm) particles, which are likely generated by the heating element, have been detected in e-cigarette aerosol in concentrations similar to or higher than in conventional cigarettes (7). These particulates, together with trillions of free radicals (4), are implicated in nose, throat, and respiratory airway irritation, lung inflammation, and nervous system damage (7,12). Once inhaled, ultrafine particles and the oxidant species located on their surface can translocate into the vascular space (13), resulting in a state of chronic vascular inflammation and oxidative stress noxious to endothelial function. Moreover, ultrafine particles can penetrate the blood-brain barrier, potentially leading to neuroinflammation and neurotoxicity (14).
We hypothesized that e-cigarette aerosol inhalation, in the absence of nicotine, exerts systemic, acute, detrimental effects on the vascular system. Therefore, we measured several quantitative MRI parameters sensitive to vascular function and tone across multiple vascular beds before and after nicotine-free e-cigarette inhalation in healthy young adult nonsmokers. To evaluate peripheral macro- and microvascular reactivity, we elicited reactive hyperemia in the superficial femoral artery and vein via cuff-induced ischemia. Temporally resolved MRI velocimetry and dynamic oximetry yielded, respectively, arterial blood flow velocity and venous blood oxygen saturation, where the latter served as an endogenous microvascular tracer (15). In addition, we quantified luminal flow-mediated dilation, an established marker of endothelial function, with high-spatial-resolution vessel-wall imaging (16). We subsequently assessed cerebrovascular reactivity in response to volitional apnea in the superior sagittal sinus (17). The evaluation of central artery stiffness with aortic pulse wave velocity complemented the vasoreactivity measurements (18).
Materials and Methods
For this prospective study, the protocol was approved by the investigators’ institutional review board. All participants provided written informed consent, in compliance with the Health Insurance Portability and Accountability Act.
Study Participants
The study was performed at the Hospital of the University of Pennsylvania (Philadelphia, Pa). Participants were consecutively enrolled from May to September 2018 at the university campus. Eligibility criteria were age between 18 and 35 years, body mass index between 18 and 30 kg/m2, and no history of smoking or overt cardiovascular or neurovascular disease. Inclusion of never-smokers in the study minimized possible confounders from previous smoking history. Excluded were participants with hypertension, asthma, respiratory tract infection within 6 weeks, cancer, human immunodeficiency virus, and breastfeeding or pregnancy (Table 1, Fig 1).
Table 1:
Participant Characteristics
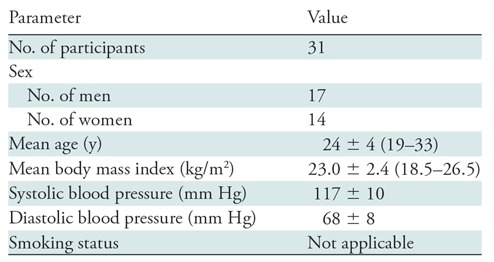
Note.—Mean data are ± standard deviation; data in parentheses are range. Because the participants were never-smokers, there is no information regarding smoking status.
Figure 1:
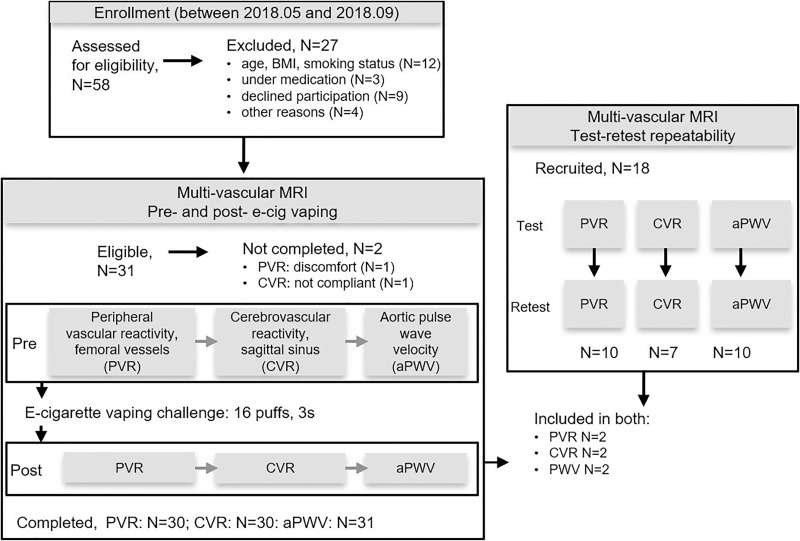
Flowchart of participant enrollment and exclusion, completed assessments, and test-retest repeatability. aPWV = aortic pulse wave velocity, BMI = body mass index, CVR = cerebrovascular reactivity, PVR = peripheral vascular reactivity.
Study Protocol
We performed multivascular MRI with a 3.0-T imager (Prisma; Siemens Healthineers, Erlangen, Germany) before and after a supervised nicotine-free e-cigarette vaping challenge (Fig 1). Before undergoing MRI, we measured the participant’s blood pressure (Veris 8600 Vital Signs; Medrad, Indianola, Pa). Test-retest repeatability was assessed in a distinct study group drawn from the same participant pool.
E-cigarette Vaping Challenge
The supervised e-cigarette vaping challenge consisted of 16 3-second inhalations (19). The research coordinator monitored the challenge, considered successful in the absence of coughing or swallowing of the vapor. The disposable e-cigarette (Eco series; Epuffer, New York, NY, epuffer.com) operating at 3.7 V, contained pharma-grade propylene glycol-to-glycerol ratio of 70%:30%, with 15% flavor dilution ratio and 0 mg of nicotine (Appendix E1 [online]).
Multivascular Quantitative MRI Protocol
The 50-minute MRI protocol (Fig 1, Fig E1 [online]) quantified the following: (a) peripheral vascular reactivity in the superficial femoral artery and vein, (b) cerebrovascular reactivity in the superior sagittal sinus, and (c) aortic arch pulse wave velocity. Participants were positioned on the imager table supine, feet first for part a and head-first for parts b and c. Apart from vessel localization with gradient-echo and time-of-flight sequences, in-house sequences programmed in SequenceTree were used (20) (Appendix E2 [online]).
Peripheral vascular reactivity assessment.—An eight-channel extremity transmitter-receiver coil (Invivo, Pewaukee, Wis) was used. After 2 minutes (precuff or baseline period), a sphygmomanometer cuff (Hokanson, Bellevue, Wash) applied to the right upper thigh and proximal to the targeted vessels was inflated quickly (<1 second) with a pneumatic pump (AG101 cuff inflator air source; Hokanson) to 210–220 mm Hg, causing 5-minute occlusion followed by 5-minute recovery (21). The imaging protocol included the following: vessel-wall imaging (16) (repetition time msec/echo time msec, 7/4.6; binomial pulse, 8° + 8° to attenuate fat signal; bandwidth, 313 Hz/pixel; and voxel size, 0.8 × 0.8 × 4.0 mm3) at baseline and 60 seconds, 90 seconds, and 120 seconds after cuff deflation (postcuff) occlusion to quantify superficial femoral artery luminal flow-mediated dilation by relying on the cross-sectional area rather than the vessel diameter; interleaved multigradient echo for simultaneous dynamic acquisition of venous oxygen saturation (SvO2); and arterial blood flow velocity (15). The imaging parameters for SvO2 were as follows: baseline/after cuff release repetition time msec, 156/39; echo spacing, 4.62 msec; baseline/after cuff release flip angle, 25°/15°; bandwidth, 419 Hz/pixel; and voxel size, 1.0 × 1.0 × 5.0 mm3. The imaging parameters for blood flow velocity (22) were as follows: baseline/after cuff release repetition time msec, 10/39; echo spacing, 4.62 msec; flip angle, 15°; baseline/after cuff release velocity encodings, 80/175 and 225 cm/sec; bandwidth, 419 Hz/pixel; voxel size, 1.0 × 1.0 × 5.0 mm3; and baseline/after cuff release temporal resolution, 20/120 msec.
Cerebrovascular reactivity assessment.—The superior sagittal sinus was imaged with a 20-channel head coil during a cued (audio and video) volitional apnea challenge consisting of three successive 30-second postexpiratory breath holds (23) interspersed by 2 minutes of normal breathing. Blood flow velocity in the superior sagittal sinus was quantified by phase-contrast MRI (17) (20/7.4; flip angle, 15°; velocity encoding, 50 cm/sec; bandwidth, 350 Hz/pixel; and voxel size, 0.92 × 0.92 × 5.0 mm3).
Aortic pulse wave velocity assessment.—Aortic pulse wave velocity was quantified by using a body-matrix-and-spine-coil combination at free breathing and without cardiac gating with a technique described in Langham et al (18). Briefly, velocity-sensitized projections were acquired to map the complex-difference signal intensity (3.3/1.7; flip angle, 20°; velocity encoding, 175 cm/sec; bandwidth, 1042 Hz/pixel; and temporal resolution, 6.6 msec) simultaneously in the ascending and descending aorta, and used to determine the transit time. The pulse wave path length was traced on a sagittal image of the aortic arch.
Image Analysis
Analyses were performed (A.C.) with in-house scripts (Matlab R2016b; Mathworks, Natick, Mass) used in combination with open-source software (ImageJ v1.5j8, open source; National Institutes of Health, Bethesda, Md) (24). The MRI parameters extracted (ie, luminal flow-mediated dilation, resistivity index, baseline blood flow velocity, peak velocity, time to peak, hyperemic index, time of forward flow, peripheral flow reserve, baseline SvO2, washout time, upslope, overshoot, change in SvO2, breath-hold index, post–breath hold relative velocity increase, and aortic pulse wave velocity) are described in Table 2 (details in Appendix E2 [online]).
Table 2:
Definition and Physiologic Importance of MRI Parameters
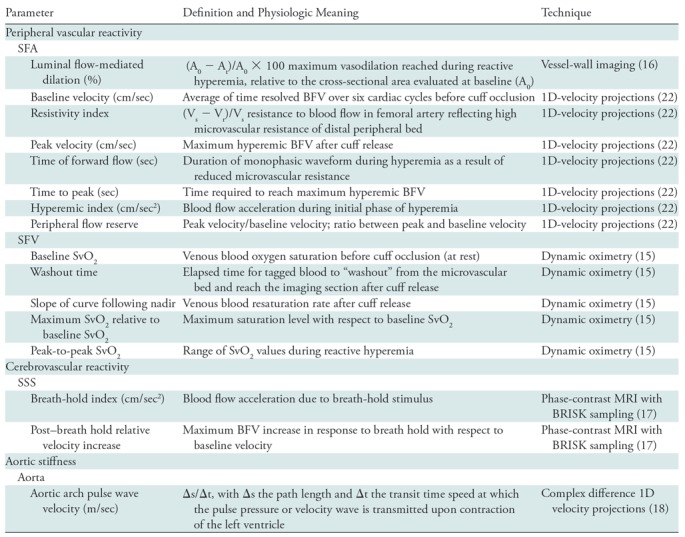
Note.—1D = one-dimensional, BFV = blood flow velocity, BRISK = blocked regional interpolation scheme for k-space, SFA = superficial femoral artery, SFV = superficial femoral vein, SSS = superior sagittal sinus, SvO2 = venous oxygen saturation, Vs = systolic velocity, Vr = retrograde velocity.
Test-Retest Repeatability
Each part of the MRI protocol was repeated without the e-cigarette challenge in a distinct group. For peripheral vascular reactivity, the group demographics were as follows: 10 participants (six women); mean age, 32.7 years ± 8.6 (standard deviation). For cerebrovascular reactivity, the group demographics were as follows: seven participants (two women); mean age, 33.4 years ± 10. Finally, for aortic pulse wave velocity, the group demographics were as follows: 10 participants (six women); mean age, 30.0 years ± 7.2 (details in Appendix E2 [online]).
Statistical Analysis
Statistical analysis was performed by using software (SPSS Statistics version 20; IBM, Armonk, NY). Sample size was estimated on the basis of brachial artery flow-mediated dilation results from Carnevale et al (9) that compared brachial artery flow-mediated dilation before versus after e-cigarette vaping, aiming for 80% power at 5% significance level, by using a two-tailed t test. Test-retest repeatability was assessed by intraclass correlation analysis and Wilcoxon signed rank test. Differences for before versus after e-cigarette vaping were evaluated by using the Hotelling T2 test (significance indicated by P < .05), controlling for multiple comparisons (Appendix E3 [online]). Missing values were addressed by pairwise deletion.
Results
Participants Who Completed the Study
Thirty-one adult nonsmokers who met the inclusion criteria were evaluated (mean age, 24.3 years ± 4.3; 14 women; Table 1). All 31 participants completed the measurements of blood flow velocity and SvO2, and 30 participants completed peripheral vascular reactivity because of discomfort associated with cuff occlusion in one participant. Cerebrovascular reactivity was evaluated in 30 participants because one participant did not comply to breath-hold instructions. All participants completed all other procedures (see also Fig 1). After the e-cigarette vaping challenge, a few participants reported dizziness and/or light-headedness, none of them experienced coughing, and all were able to correctly complete the challenge.
Multivascular MRI Sample Data
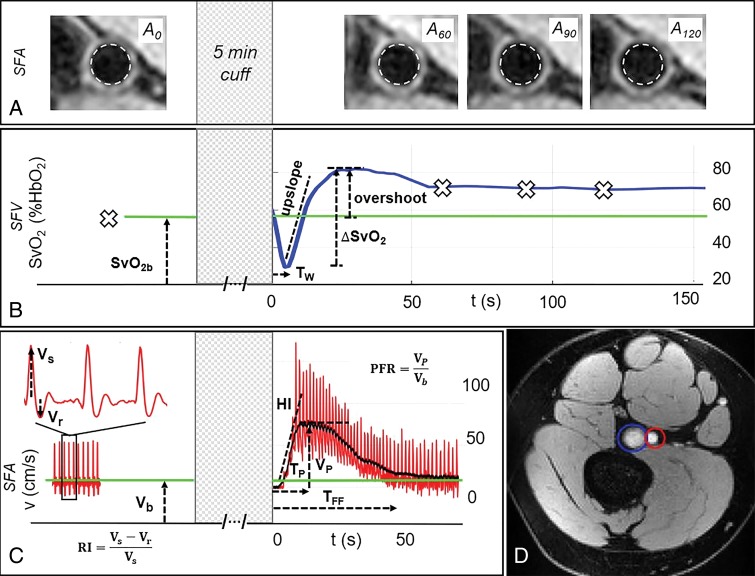
Peripheral vascular reactivity.—The vascular imaging procedures and parameters extracted at baseline and during reactive hyperemia in a representative participant are in Figure 2. The arterial lumen measured at four different points during the cuff protocol is shown in Figure 2, A, suggesting that the artery reaches its maximum dilation at 120 seconds from cuff release (for this participant). Figure 2, B, shows that in the superficial femoral vein, SvO2 reaches a minimum after cuff release because of the washout of oxygen-depleted blood, reaching the imaged section at washout time. Thereafter, oxygen saturation increases rapidly above the baseline value (overshoot), indicating that the incoming blood, rich in oxygen, exceeds the metabolic needs of the tissue. Return to precuff SvO2 levels (baseline) occurs within a few minutes. Blood flow velocity in the superficial femoral artery precuff occlusion is triphasic, starting with the antegrade systolic peak, followed by retrograde and second antegrade peaks during diastole (Fig 2, C). However, reactive hyperemia that occurs at cuff release is antegrade only, recovering to baseline velocity within 1 minute from cuff deflation.
Figure 2:
Response to cuff occlusion in the femoral circulation. A, Vessel-wall images of the superficial femoral artery (SFA) at different points (60 seconds [A60], 90 seconds [A90], and 120 seconds [A120]) as indicated by crosses in B during reactive hyperemia. The dashed circles represent the lumen area at baseline. B, Superficial femoral vein (SFV) oxygen saturation (SvO2) at baseline (green line) and during hyperemia. C, SFA blood flow velocity (V). D, Axial image obtained with MRI in the thigh, with SFA and SFV indicated in red and blue, respectively. Sample data shown for a representative participant. ΔSvO2 = peak-to-peak SvO2, HI = hyperemic index, PFR = peripheral flow reserve, RI = resistivity index, TFF = time of forward flow, TP = time to peak, TW = washout time, Vb = baseline velocity, VP = peak hyperemic velocity, Vr = retrograde velocity during early diastole, Vs = systolic velocity.
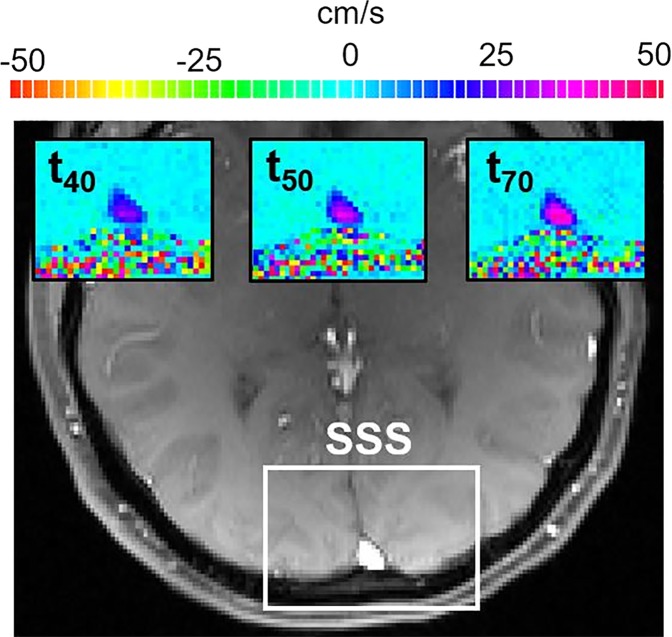
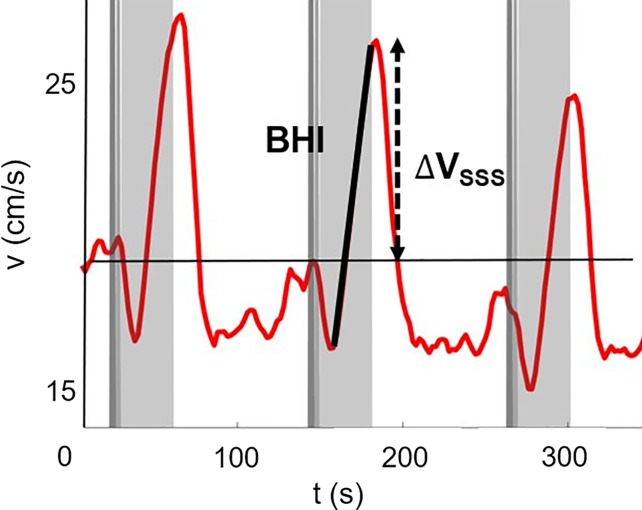
Cerebrovascular reactivity.—The evolution of blood flow velocity in the superior sagittal sinus during the breath-hold challenge is shown in Figure 3a with two-dimensional velocity maps, and in Figure 3b with the average velocity profile across the superior sagittal sinus lumen for a representative participant before e-cigarette vaping. During the postexpiratory breath hold, the velocity decreased initially then increased up to about 40% (in this particular participant) with respect to the baseline (ie, pre–breath hold) value because of the hypercapnic stimulus.
Figure 3a:
Neurovascular response to breath hold. (a) Magnitude image intensity of superior sagittal sinus (SSS, box). Insets show velocity maps at different points of the velocity time-course (40 seconds [t40], 50 seconds [t50], and 70 seconds [t70]). (b) Sample SSS blood flow velocity time-course (red line) shown for a representative participant. The thick black line is linear fit during breath holds, the slope of which is the breath-hold index (BHI). ΔVSSS = post–breath hold relative velocity increase.
Figure 3b:
Neurovascular response to breath hold. (a) Magnitude image intensity of superior sagittal sinus (SSS, box). Insets show velocity maps at different points of the velocity time-course (40 seconds [t40], 50 seconds [t50], and 70 seconds [t70]). (b) Sample SSS blood flow velocity time-course (red line) shown for a representative participant. The thick black line is linear fit during breath holds, the slope of which is the breath-hold index (BHI). ΔVSSS = post–breath hold relative velocity increase.
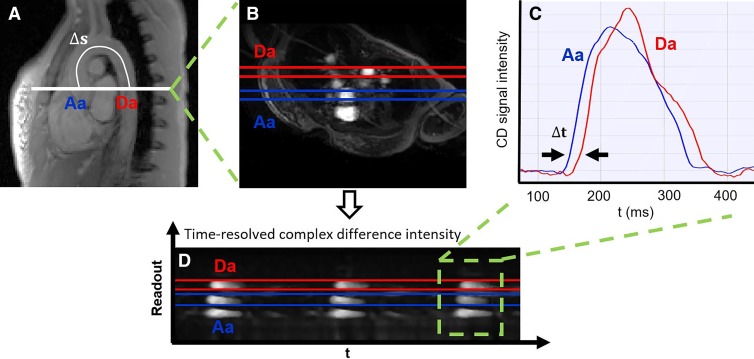
Aortic pulse wave velocity.—The aortic arch of a representative participant is shown in Figure 4, with the path length of the pulse wave between ascending and descending aorta and the selected axial section superimposed. The time-resolved complex difference intensity from one-dimensional velocity projections, averaged across the aorta width, yields two velocity-dependent signals in the ascending and descending aorta. The time-shift between the two is indicated and represents the transit time of the pulse wave between the two locations.
Figure 4:
Measurement of aortic pulse wave velocity. A, Sagittal view of the aortic arch with path length of the flow wave between the ascending aorta (Aa) and descending aorta (Da; Δs). B, Axial view showing Aa and Da, and the time course of the, C, complex difference (CD) signals during three cardiac cycles. D, CD signal intensity averaged across the aorta width during a single cardiac cycle (the transit time [t] is indicated). Sample data shown for a representative participant. t = time.
Test-Retest Repeatability
Test-retest data are compiled in Table 3, with their intraclass correlation coefficients and P values comparing test-retest values as measures of short-term repeatability in participants by covering an age range similar to the vaping cohort. Average interval times between test and retest acquisitions were comparable to those elapsing between the before and after e-cigarette vaping acquisitions that evaluated vaping-induced changes (Appendix E2 [online]). Eight functional measures (baseline SvO2, washout time, upslope, overshoot, peak-to-peak SvO2, resistivity index, luminal flow-mediated dilation, and aortic pulse wave velocity) had intraclass correlation coefficients of 0.9 or greater, five measures (peak velocity, time to peak, hyperemic index, breath-hold index, post–breath hold relative velocity increase) had intraclass correlation coefficients greater than 0.8, and the remaining parameters were less reliable (ie, baseline velocity and time of forward flow) or not at all reliable (ie, peripheral flow reserve). Paired comparisons (Wilcoxon) indicated no test-versus-retest difference (P > .05) except for marginally different values in three instances (washout time, P = .02; baseline velocity, P = .03; time of forward flow, P = .04; Table 4). Therefore, we included the subset of 13 parameters (luminal flow-mediated dilation, resistivity index, peak velocity, time to peak, hyperemic index, baseline SvO2, washout time, upslope, overshoot, peak-to-peak SvO2, breath-hold index, post–breath hold relative velocity increase, and aortic pulse wave velocity) in our study.
Table 3:
Test-Retest Repeatability and Reliability of MRI Parameters
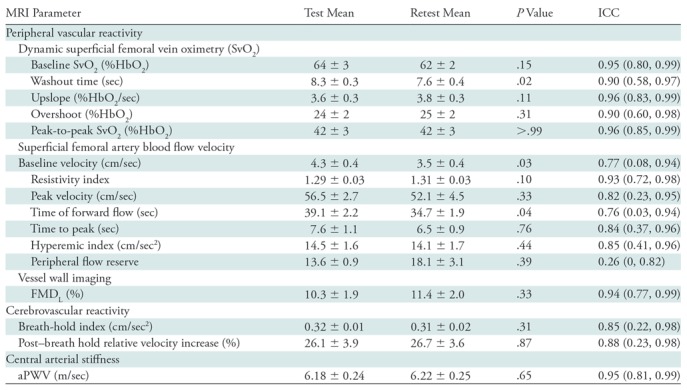
Note.—Mean data are ± standard error; data in parentheses are 95% confidence intervals. Overshoot refers to the maximum SvO2 relative to baseline SvO2. Upslope refers to the slope of curve following nadir. aPWV = aortic arch pulse wave velocity, FMDL = luminal flow-mediated dilation, ICC = intraclass correlation coefficient, SvO2 = venous oxygen saturation.
Table 4:
Comparisons before and after E-cigarette Vaping
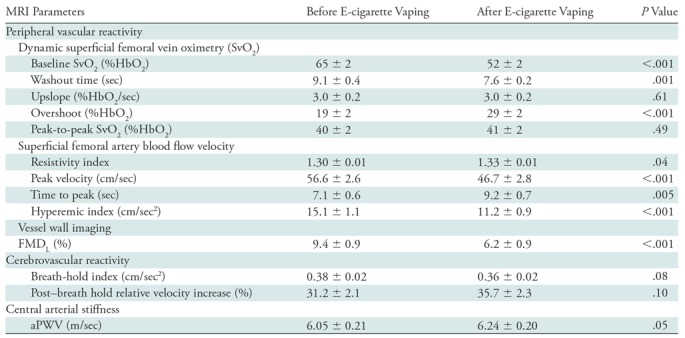
Note.—Data are mean ± standard error. Upslope refers to the slope of curve following nadir; overshoot refers to the maximum SvO2 relative to baseline SvO2. aPWV = aortic arch pulse wave velocity, FMDL = luminal flow-mediated dilation, SvO2 = venous oxygen saturation.
Acute Transient Effects of Vaping on MRI Parameters
The Hotelling trace test (P < .001) led to rejection of the null hypothesis for the prepost e-cigarette vaping differences. Group means, standard errors of the parameters of interest, and paired t test results are in Table 4. Box-and-whisker plots of the strongest associations composed of measures of peripheral vascular function are in Figure 5. Our data (Table 4) indicate that the vascular insult exerted by the aerosol inhalation affects the entire hyperemic period. After vaping, baseline SvO2 values were 20% lower (P < .001) and overshoot was more than 50% higher (P < .001), whereas the upslope (ie, resaturation rate) did not change with respect to levels before vaping (P = .61). After vaping, arterial peak blood flow velocity was nearly 20% lower (P < .001), along with a reduction of 26% in the hyperemic index (P < .001). Luminal flow-mediated dilation was reduced by 34% after e-cigarette vaping (P < .001). However, cerebrovascular reactivity expressed as breath-hold index was not significantly lower after vaping (P = .08). Finally, aortic pulse wave velocity was marginally increased (P = .05).
Figure 5a:
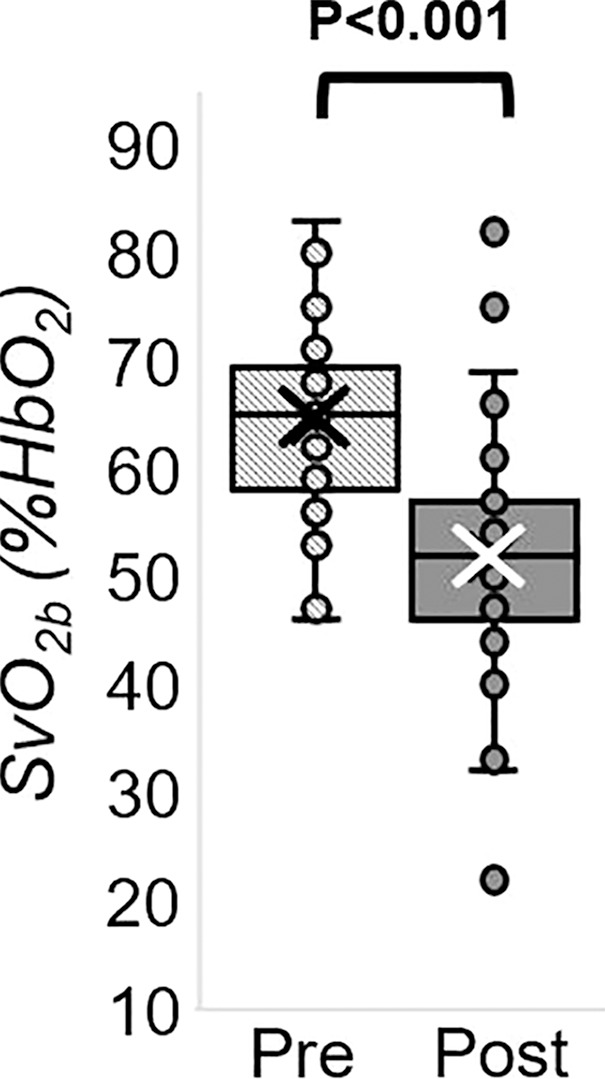
MRI-derived vascular parameters before and after e-cigarette vaping. Box-and-whisker plots for the strongest effects observed show (a) SvO2 during baseline (SvO2b), (b) SvO2 washout time (TW), (c) SvO2 overshoot, (d) luminal flow-mediated dilation (FMDL), (e) peak hyperemic blood flow velocity (VP), and (f) hyperemic index (HI). P values were derived on the basis of paired t tests. The boxes represent inner quartiles; horizontal lines within the box indicate the median and crosses (X) indicate the mean.
Figure 5b:
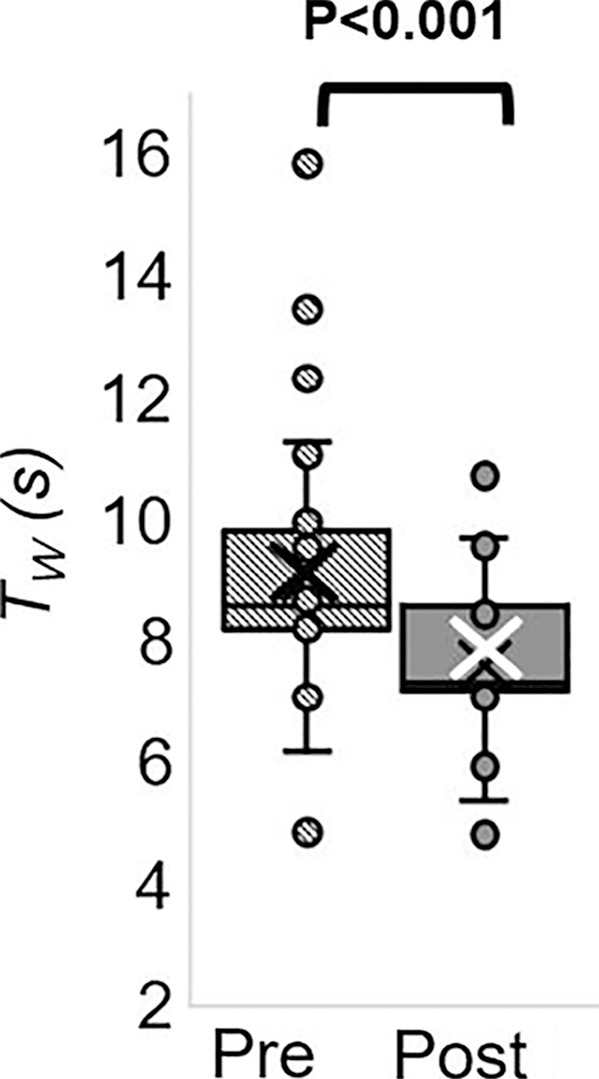
MRI-derived vascular parameters before and after e-cigarette vaping. Box-and-whisker plots for the strongest effects observed show (a) SvO2 during baseline (SvO2b), (b) SvO2 washout time (TW), (c) SvO2 overshoot, (d) luminal flow-mediated dilation (FMDL), (e) peak hyperemic blood flow velocity (VP), and (f) hyperemic index (HI). P values were derived on the basis of paired t tests. The boxes represent inner quartiles; horizontal lines within the box indicate the median and crosses (X) indicate the mean.
Figure 5c:
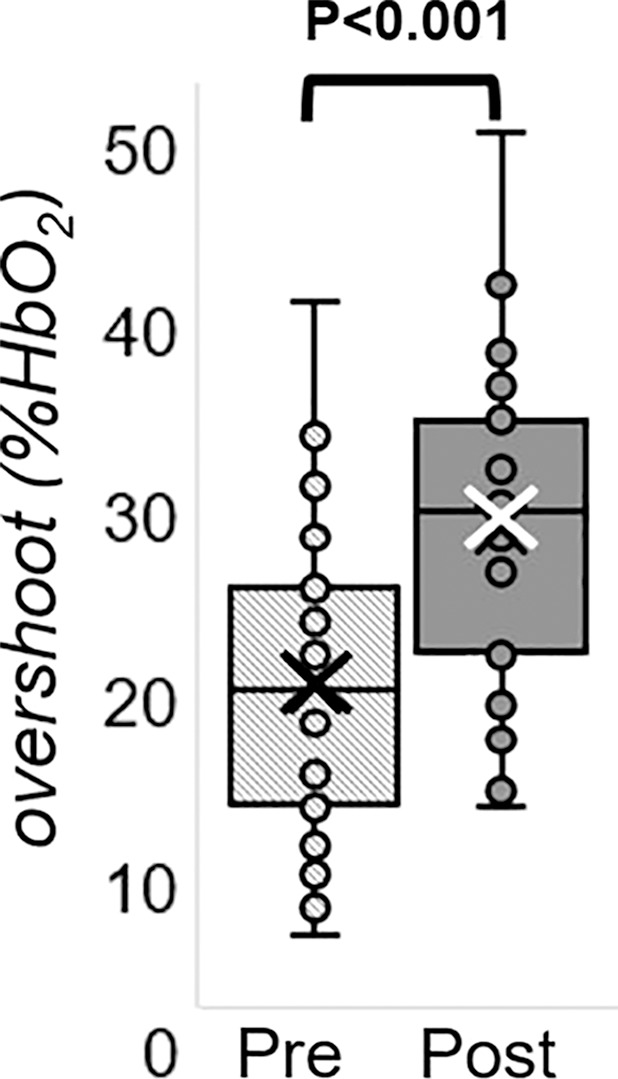
MRI-derived vascular parameters before and after e-cigarette vaping. Box-and-whisker plots for the strongest effects observed show (a) SvO2 during baseline (SvO2b), (b) SvO2 washout time (TW), (c) SvO2 overshoot, (d) luminal flow-mediated dilation (FMDL), (e) peak hyperemic blood flow velocity (VP), and (f) hyperemic index (HI). P values were derived on the basis of paired t tests. The boxes represent inner quartiles; horizontal lines within the box indicate the median and crosses (X) indicate the mean.
Figure 5d:
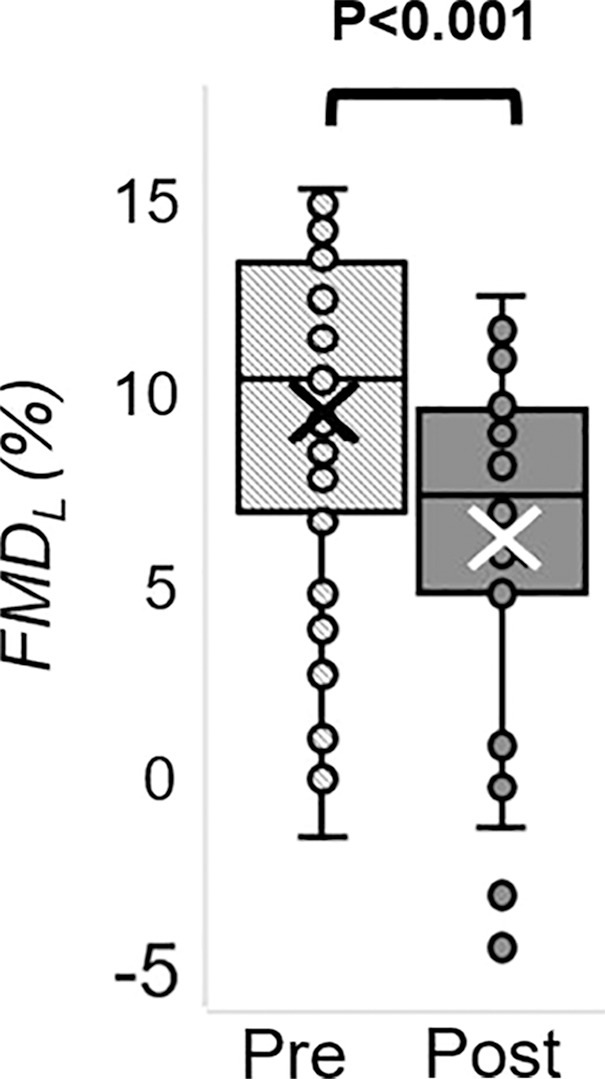
MRI-derived vascular parameters before and after e-cigarette vaping. Box-and-whisker plots for the strongest effects observed show (a) SvO2 during baseline (SvO2b), (b) SvO2 washout time (TW), (c) SvO2 overshoot, (d) luminal flow-mediated dilation (FMDL), (e) peak hyperemic blood flow velocity (VP), and (f) hyperemic index (HI). P values were derived on the basis of paired t tests. The boxes represent inner quartiles; horizontal lines within the box indicate the median and crosses (X) indicate the mean.
Figure 5e:
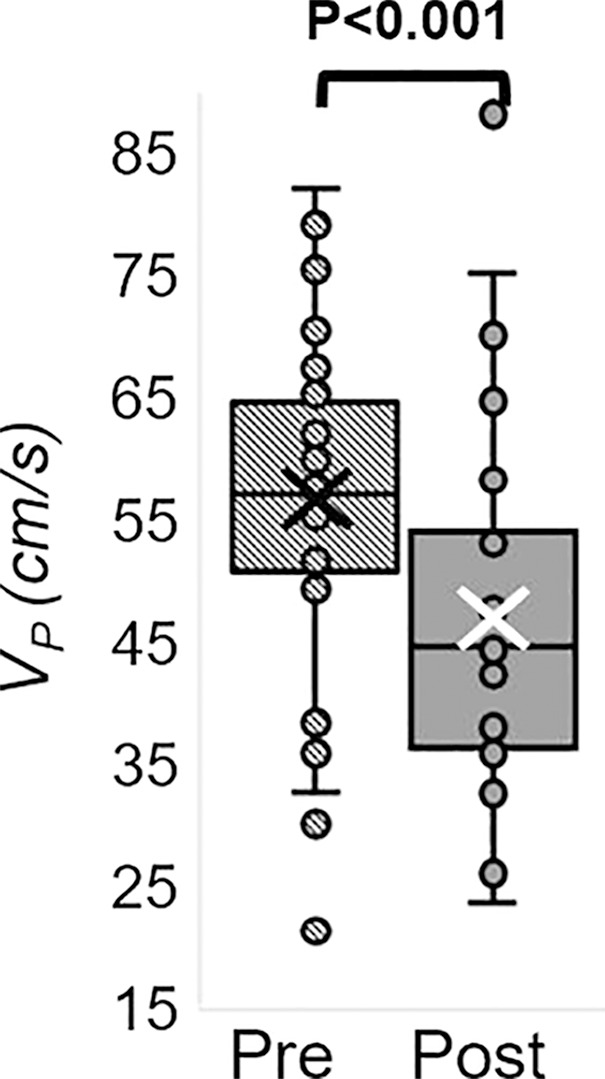
MRI-derived vascular parameters before and after e-cigarette vaping. Box-and-whisker plots for the strongest effects observed show (a) SvO2 during baseline (SvO2b), (b) SvO2 washout time (TW), (c) SvO2 overshoot, (d) luminal flow-mediated dilation (FMDL), (e) peak hyperemic blood flow velocity (VP), and (f) hyperemic index (HI). P values were derived on the basis of paired t tests. The boxes represent inner quartiles; horizontal lines within the box indicate the median and crosses (X) indicate the mean.
Figure 5f:
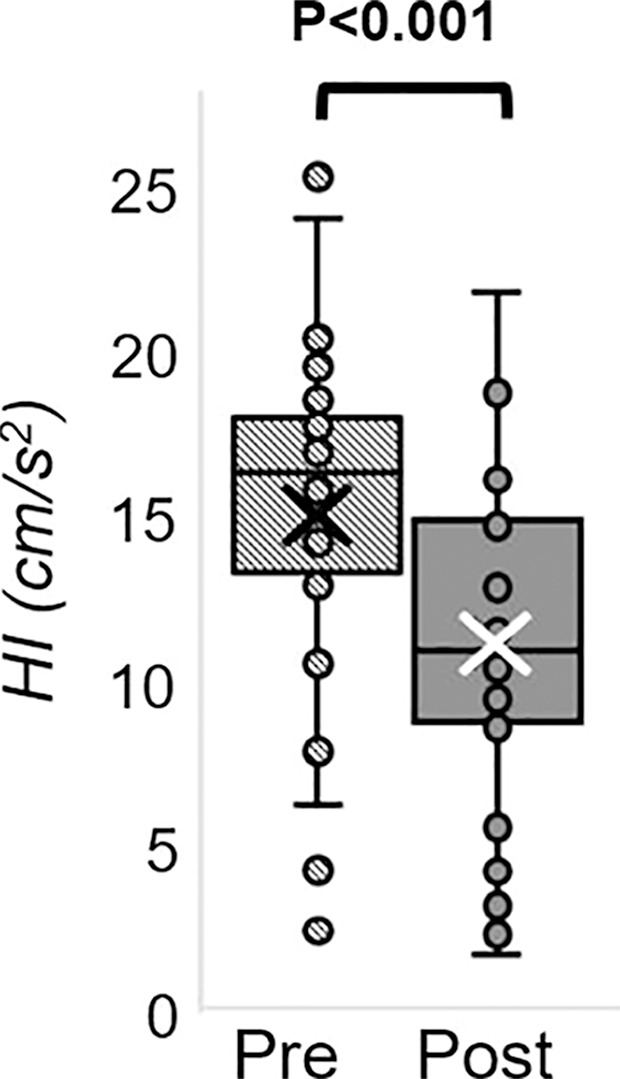
MRI-derived vascular parameters before and after e-cigarette vaping. Box-and-whisker plots for the strongest effects observed show (a) SvO2 during baseline (SvO2b), (b) SvO2 washout time (TW), (c) SvO2 overshoot, (d) luminal flow-mediated dilation (FMDL), (e) peak hyperemic blood flow velocity (VP), and (f) hyperemic index (HI). P values were derived on the basis of paired t tests. The boxes represent inner quartiles; horizontal lines within the box indicate the median and crosses (X) indicate the mean.
Discussion
We assessed vascular reactivity and tone across multiple vascular beds after nicotine-free electronic cigarette (hereafter, e-cigarette) vaping in young nonsmokers by using a multiparametric MRI protocol (Fig 6). Specifically, we measured peripheral hyperemia in response to cuff-induced ischemia, cerebrovascular reactivity in response to breath hold, aortic pulse wave velocity, and an indicator of aortic stiffness. We found reductions after vaping in luminal flow-mediated dilation (−3.2 of 9.4; −34%; P < .001), reactive hyperemia peak velocity (−9.9 of 56.6 cm/sec; −18%; P < .001), and acceleration (−3.9 of 15.1 cm/sec2; −26% P < .001) as representative of macrovascular alterations; a reduction in precuff occlusion SvO2 (−13 of 65 %HbO2; −20%, P < .001), which indicated transient microvascular impairment; a marginal increase in aortic pulse wave velocity (0.19 of 6.05 m/sec; 3%; P = .05), which suggested aortic stiffening; and no statistically significant alterations in cerebrovascular reactivity measured by breath-hold index (−0.02 of 0.38 cm/sec2; −5%; P = .08). We interpreted the poor repeatability of two velocimetry parameters (baseline velocity, peripheral flow reserve) as caused by noisy blood flow velocity waveform during late diastole. A lower velocity-to-noise ratio for low blood flow velocities was because of the high-velocity sensitivity (velocity encoding parameter) used to capture hyperemic velocities without aliasing (25). A slight but marginally significant test-versus-retest difference was found for washout time and time of forward flow (P = .02 and .04, respectively). However, strong effects after vaping were shown for both (P ≤ .001; Appendix E4 [online]).
Figure 6:
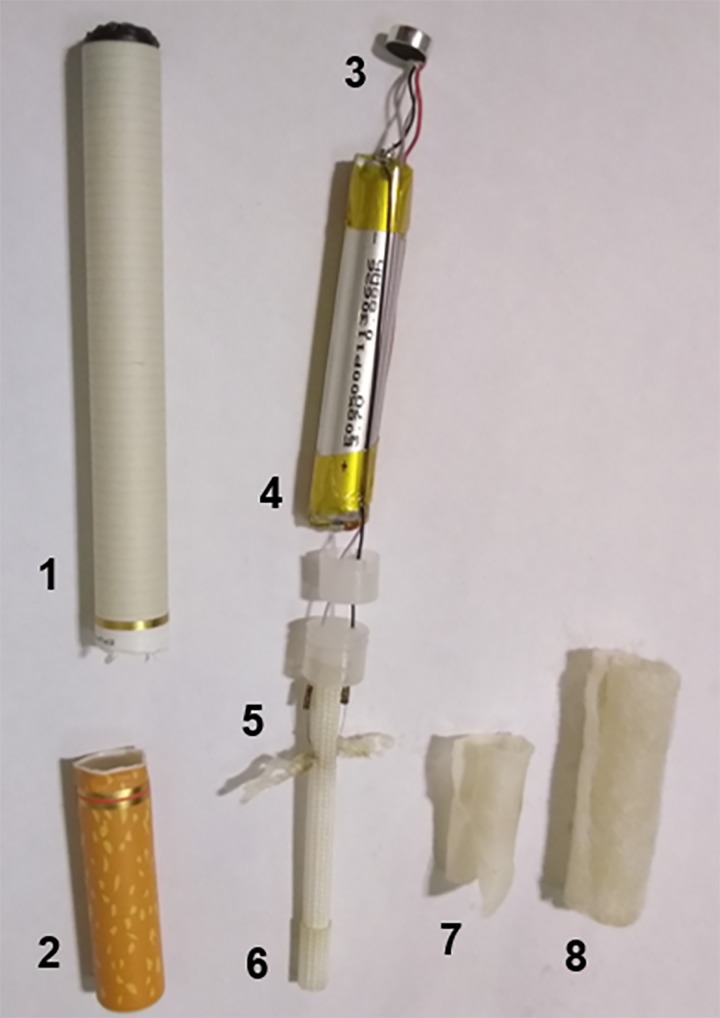
Electronic cigarette components. Photograph shows the superior envelope (1), mouthpiece (2), light emitting diode (3), cylindrical 3.7-V lithium battery (4), wick and filament (5), thick wire (6), inner fibers (7), and outer fibers (8).
Several recent studies (9–11,26) addressed the effect of e-cigarette use on metrics of vascular health. A crossover study (9) involving 40 healthy young smokers and nonsmokers (mean age, 28 years ± 5.3; mean body mass index, 23.4 kg/m2 ± 2.9) showed that brachial flow-mediated dilation was lower after nicotinized e-cigarette vaping (9). Moreover, nicotinized e-cigarette increased carotid-femoral pulse wave velocity and systemic blood pressure as reported by Vlachopoulos et al (10) and Franzen et al (11), whereas vaping nicotine-free e-cigarette elicited no pulse wave velocity alteration (11). These studies (9–11) were each able to evaluate a single measure of vascular health. Against this backdrop of recent work, some of which studied the effect of aerosol alone (11) or involved nonsmokers (9), our work stands out because we introduced a noninvasive imaging protocol able to evaluate multiple vascular territories in a single examination and thus provided a more comprehensive picture of the acute vascular effects of e-cigarette vaping. Of note is that we measured luminal flow-mediated dilation in the superficial femoral artery, which is prone to atherosclerosis compared with brachial artery, and thus more representative of endothelial dysfunction (27).
Our findings of luminal flow-mediated dilation reduction after vaping were similar to a previous study (9) and are likely caused by reduced nitric oxide bioavailability, secondary to oxidative stress. The alterations in reactive hyperemic response parallel those observed in older people because of physiologic aging as reported in a recent study by means of concurrent arterial hyperemia and dynamic oximetry in the femoral circulation (15). In our study, the transient reduction in femoral vein SvO2 after vaping could be linked to increased vascular resistance in arterioles and arteriovenous capillaries, leading to greater oxygen extraction and thus lowering venous hemoglobin saturation. Alternatively, the effect might be caused by hypoxemia from elevated respiratory and peripheral airway resistance, found to be associated with e-cigarette vaping (28).
The group-average aortic pulse wave velocity evaluated before e-cigarette vaping had good agreement with previous studies (29,30). Unlike previous studies (10,11), we found a marginally significant increase in aortic pulse wave velocity after e-cigarette aerosol inhalation (3%; P = .05), consistent with a recent study (31) showing that nicotine-free e-cigarettes caused increased pulse wave velocity, albeit less than observed with nicotinized e-cigarettes.
We did not find statistically significant alterations in cerebrovascular reactivity measured by breath-hold index (−5%; P = .08). It should be noted that the time elapsed between e-cigarette vaping and the cerebrovascular reactivity measurement was about 40–50 minutes, which is comparable to the recovery time of cerebrovascular reactivity during a breath-hold challenge, acutely reduced after tobacco smoking, as measured by transcranial Doppler US in young smokers (average age, 32.3 years) (32). Further research evaluating the temporal evolution of cerebrovascular reactivity after e-cigarette vaping is needed to study the kinetics of the effect.
Our study had limitations. First, we evaluated test-retest repeatability of each element of the protocol separately, rather than of the MRI protocol as a whole. Because the time constants of the transient effects elicited by the cuff-induced ischemia are, to our knowledge, not accurately known, the small effects observed in the retest data for some parameters could be caused by latent effects from the previous cuff-occlusion cycle. Nevertheless, even for those parameters, the effect after vaping was far larger. Second, in accordance with our overall hypothesis we focused on the effects of the aerosol and therefore did not accommodate a second arm of the study to compare the effects of nicotinized versus nicotine-free e-cigarette aerosol. However, a recent study (33) showed that nicotine-free e-cigarette vaping caused a transient increase in serum markers of inflammation (c-reactive protein) and oxidative stress, and the changes peaked at 1–2 hours after vaping and recovery occurred within 6 hours. These observations at the cellular level thus lend further credence to our interpretation of the image-based findings. Third, because the participants were never-smokers, intersubject variations in adherence to the inhalation protocol cannot be entirely excluded. Fourth, to our knowledge, it is unknown which specific constituents of the aerosol, flavor, and thermal degradation products are responsible for the observed effects, a question that is outside our study’s intended scope.
In summary, our study provides further insight into the effects on the endothelium from electronic cigarette exhalants detectable by using noninvasive quantitative MRI markers. In light of these results, it would be desirable to corroborate our findings in larger cohorts.
APPENDIX
SUPPLEMENTAL FIGURES
Acknowledgments
Acknowledgments
The authors thank Frank Leone, MD, and Andrew Strasser, PhD, for the thoughtful discussions about participant recruitment; Holly Stefanow, MBE, for the support in manuscript revision and advice on the e-cigarette vaping challenge; Kelly Sexton, BS, for assistance in recruiting participants and in the vaping challenge; and MRI technologists Doris Cain, MSOD, Jacqui Meeks, MBA, and Pat O’Donnell, who offered their expertise and advice during the MRI sessions.
Study supported by the National Institutes of Health (R01 HL109545, R01 HL139358) and the National Heart, Lung, and Blood Institute (R01 HL109545, R01 HL139358).
Disclosures of Conflicts of Interest: A.C. disclosed no relevant relationships. M.C.L. disclosed no relevant relationships. W.G. disclosed no relevant relationships. A.J. disclosed no relevant relationships. S.C. disclosed no relevant relationships. F.W.W. disclosed no relevant relationships.
Abbreviation:
- SvO2
- venous oxygen saturation
References
- 1.Grana R, Benowitz N, Glantz SA. E-cigarettes: a scientific review. Circulation 2014;129(19):1972–1986. [DOI] [PMC free article] [PubMed] [Google Scholar]
- 2.Cullen KA, Ambrose BK, Gentzke AS, Apelberg BJ, Jamal A, King BA. Notes from the Field: Use of Electronic Cigarettes and Any Tobacco Product Among Middle and High School Students - United States, 2011-2018. MMWR Morb Mortal Wkly Rep 2018;67(45):1276–1277. [DOI] [PMC free article] [PubMed] [Google Scholar]
- 3.Erythropel HC, Jabba SV, DeWinter TM, et al. Formation of flavorant-propylene Glycol Adducts With Novel Toxicological Properties in Chemically Unstable E-Cigarette Liquids. Nicotine Tob Res 2018 Oct 18 [Epub ahead of print]. [DOI] [PMC free article] [PubMed]
- 4.Goel R, Durand E, Trushin N, et al. Highly reactive free radicals in electronic cigarette aerosols. Chem Res Toxicol 2015;28(9):1675–1677. [DOI] [PMC free article] [PubMed] [Google Scholar]
- 5.Jensen RP, Strongin RM, Peyton DH. Solvent Chemistry in the Electronic Cigarette Reaction Vessel. Sci Rep 2017;7(1):42549. [DOI] [PMC free article] [PubMed] [Google Scholar]
- 6.Wang P, Chen W, Liao J, et al. A Device-Independent Evaluation of Carbonyl Emissions from Heated Electronic Cigarette Solvents. PLoS One 2017;12(1):e0169811. [DOI] [PMC free article] [PubMed] [Google Scholar]
- 7.Williams M, Villarreal A, Bozhilov K, Lin S, Talbot P. Metal and silicate particles including nanoparticles are present in electronic cigarette cartomizer fluid and aerosol. PLoS One 2013;8(3):e57987. [DOI] [PMC free article] [PubMed] [Google Scholar]
- 8.Antoniewicz L, Bosson JA, Kuhl J, et al. Electronic cigarettes increase endothelial progenitor cells in the blood of healthy volunteers. Atherosclerosis 2016;255:179–185. [DOI] [PubMed] [Google Scholar]
- 9.Carnevale R, Sciarretta S, Violi F, et al. Acute Impact of Tobacco vs Electronic Cigarette Smoking on Oxidative Stress and Vascular Function. Chest 2016;150(3):606–612. [DOI] [PubMed] [Google Scholar]
- 10.Vlachopoulos C, Ioakeimidis N, Abdelrasoul M, et al. Electronic Cigarette Smoking Increases Aortic Stiffness and Blood Pressure in Young Smokers. J Am Coll Cardiol 2016;67(23):2802–2803. [DOI] [PubMed] [Google Scholar]
- 11.Franzen KF, Willig J, Cayo Talavera S, et al. E-cigarettes and cigarettes worsen peripheral and central hemodynamics as well as arterial stiffness: A randomized, double-blinded pilot study. Vasc Med 2018;23(5):419–425. [DOI] [PubMed] [Google Scholar]
- 12.Lerner CA, Sundar IK, Yao H, et al. Vapors produced by electronic cigarettes and e-juices with flavorings induce toxicity, oxidative stress, and inflammatory response in lung epithelial cells and in mouse lung. PLoS One 2015;10(2):e0116732. [DOI] [PMC free article] [PubMed] [Google Scholar]
- 13.Nakane H. Translocation of particles deposited in the respiratory system: a systematic review and statistical analysis. Environ Health Prev Med 2012;17(4):263–274. [DOI] [PMC free article] [PubMed] [Google Scholar]
- 14.Block ML, Calderón-Garcidueñas L. Air pollution: mechanisms of neuroinflammation and CNS disease. Trends Neurosci 2009;32(9):506–516. [DOI] [PMC free article] [PubMed] [Google Scholar]
- 15.Langham MC, Wehrli FW. Simultaneous mapping of temporally-resolved blood flow velocity and oxygenation in femoral artery and vein during reactive hyperemia. J Cardiovasc Magn Reson 2011;13(1):66. [DOI] [PMC free article] [PubMed] [Google Scholar]
- 16.Langham MC, Li C, Englund EK, Wehrli FW. Vessel-wall imaging using water-selective centrically-encoded 3D SSFP-echo with double-inversion recovery [abstr]. In: Proceedings of the Twenty-First Meeting of the International Society for Magnetic Resonance in Medicine. Berkeley, Calif: International Society for Magnetic Resonance in Medicine, 2013. [DOI] [PMC free article] [PubMed] [Google Scholar]
- 17.Rodgers ZB, Leinwand SE, Keenan BT, Kini LG, Schwab RJ, Wehrli FW. Cerebral metabolic rate of oxygen in obstructive sleep apnea at rest and in response to breath-hold challenge. J Cereb Blood Flow Metab 2016;36(4):755–767. [DOI] [PMC free article] [PubMed] [Google Scholar]
- 18.Langham MC, Li C, Magland JF, Wehrli FW. Nontriggered MRI quantification of aortic pulse-wave velocity. Magn Reson Med 2011;65(3):750–755. [DOI] [PMC free article] [PubMed] [Google Scholar]
- 19.Behar RZ, Hua M, Talbot P. Puffing topography and nicotine intake of electronic cigarette users. PLoS One 2015;10(2):e0117222. [DOI] [PMC free article] [PubMed] [Google Scholar]
- 20.Magland JF, Li C, Langham MC, Wehrli FW. Pulse sequence programming in a dynamic visual environment: SequenceTree. Magn Reson Med 2016;75(1):257–265. [DOI] [PMC free article] [PubMed] [Google Scholar]
- 21.Ledermann HP, Schulte AC, Heidecker HG, et al. Blood oxygenation level-dependent magnetic resonance imaging of the skeletal muscle in patients with peripheral arterial occlusive disease. Circulation 2006;113(25):2929–2935. [DOI] [PubMed] [Google Scholar]
- 22.Langham MC, Jain V, Magland JF, Wehrli FW. Time-resolved absolute velocity quantification with projections. Magn Reson Med 2010;64(6):1599–1606. [DOI] [PMC free article] [PubMed] [Google Scholar]
- 23.Markus HS, Harrison MJ. Estimation of cerebrovascular reactivity using transcranial Doppler, including the use of breath-holding as the vasodilatory stimulus. Stroke 1992;23(5):668–673. [DOI] [PubMed] [Google Scholar]
- 24.Schneider CA, Rasband WS, Eliceiri KW. NIH Image to ImageJ: 25 years of image analysis. Nat Methods 2012;9(7):671–675. [DOI] [PMC free article] [PubMed] [Google Scholar]
- 25.Lee AT, Pike GB, Pelc NJ. Three-point phase-contrast velocity measurements with increased velocity-to-noise ratio. Magn Reson Med 1995;33(1):122–126. [DOI] [PubMed] [Google Scholar]
- 26.Anderson C, Majeste A, Hanus J, Wang S. E-Cigarette Aerosol Exposure Induces Reactive Oxygen Species, DNA Damage, and Cell Death in Vascular Endothelial Cells. Toxicol Sci 2016;154(2):332–340. [DOI] [PubMed] [Google Scholar]
- 27.Silber HA, Lima JA, Bluemke DA, et al. Arterial reactivity in lower extremities is progressively reduced as cardiovascular risk factors increase: comparison with upper extremities using magnetic resonance imaging. J Am Coll Cardiol 2007;49(9):939–945. [DOI] [PubMed] [Google Scholar]
- 28.Vardavas CI, Anagnostopoulos N, Kougias M, Evangelopoulou V, Connolly GN, Behrakis PK. Short-term pulmonary effects of using an electronic cigarette: impact on respiratory flow resistance, impedance, and exhaled nitric oxide. Chest 2012;141(6):1400–1406. [DOI] [PubMed] [Google Scholar]
- 29.Langham MC, Li C, Wehrli FW. Non-triggered quantification of central and peripheral pulse-wave velocity. J Cardiovasc Magn Reson 2011;13(1):81. [DOI] [PMC free article] [PubMed] [Google Scholar]
- 30.Reference Values for Arterial Stiffness’ Collaboration . Determinants of pulse wave velocity in healthy people and in the presence of cardiovascular risk factors: ‘establishing normal and reference values’. Eur Heart J 2010;31(19):2338–2350. [DOI] [PMC free article] [PubMed] [Google Scholar]
- 31.Ikonomidis I, Vlastos D, Kourea K, et al. Electronic Cigarette Smoking Increases Arterial Stiffness and Oxidative Stress to a Lesser Extent Than a Single Conventional Cigarette: An Acute and Chronic Study. Circulation 2018;137(3):303–306. [DOI] [PubMed] [Google Scholar]
- 32.Silvestrini M, Troisi E, Matteis M, Cupini LM, Bernardi G. Effect of smoking on cerebrovascular reactivity. J Cereb Blood Flow Metab 1996;16(4):746–749. [DOI] [PubMed] [Google Scholar]
- 33.Chatterjee S, Tao JQ, Johncola A, et al. Acute exposure to e-cigarettes causes inflammation and endothelial oxidative stress in non-smoking healthy young subjects. Am J Physiol Lung Cell Mol Physiol 2019 May 1 [Epub ahead of print]. [DOI] [PMC free article] [PubMed] [Google Scholar]
Associated Data
This section collects any data citations, data availability statements, or supplementary materials included in this article.


