Abstract
Peptide nucleic acid (PNA) is a neutral nucleic acid analogue that base pairs with itself and natural nucleic acids. PNA-nucleic acid complexes are more thermally stable than the corresponding complexes of natural nucleic acids. In addition, PNA is biostable and thus used in many antisense and antigene applications to block functional RNA or DNA via sequence-specific interactions. We have recently developed force field parameters for molecular dynamics (MD) simulations of PNA and PNA-involving duplexes with natural nucleic acids. In this work we provide the first application of this force field to biologically-relevant PNA sequences and their complexes with RNA. We investigated thermal stabilities of short PNA-PNA, PNA-RNA and RNA-RNA duplexes using UV-monitored thermal denaturation experiments and MD simulations at ambient and elevated temperatures. The simulations show a two-state melting transition and reproduce the thermal stability from melting experiments, with PNA-PNA being the most and RNA-RNA the least stable. The PNA-PNA duplex also displays the highest activation energy for melting. The atomistic details of unfolding of PNA duplexes suggest that all PNA-PNA bases melt concomitantly, whereas the RNA-RNA and PNA-RNA are destabilized from the termini toward the central part of the duplexes.
Graphical Abstract
Introduction
The concept of RNA or DNA silencing is widespread in nature. Short oligonucleotides that hybridize with a complementary fragment of DNA or RNA have been used in vitro and in vivo to regulate gene expression in diagnostic, therapeutic, and molecular biology applications.1 Oligonucleotides that specifically recognize double-stranded DNA or messenger RNA modulate key biological processes of either transcription or translation. Therefore, the use of sequence-specific hybridization of short oligonucleotides to natural DNA or RNA targets has been a matter of extensive research.
However, natural oligonucleotides are recognized by nucleases and, as a consequence, they are degraded. Therefore, many modified oligonucleotides have been synthesized in an effort to make them both biostable and more specific for their target sequence. Common procedures are to replace one of the non-bridging oxygen atoms in the phosphate group with a sulphur (phosphorothioates), a methyl group (methylphosphonates) or a dimethylamine group (Morpholinos2). The modifications in the sugar ring include 2’O-methyl-RNA and locked nucleic acid (LNA).3 In the latter, the ribose ring is locked by a methylene bridge connecting the 2’-0 and 4’-C atoms. Another nucleic acid mimic, termed peptide nucleic acid (PNA), that we focus on in this study, has the entire sugar-phosphate backbone redesigned.
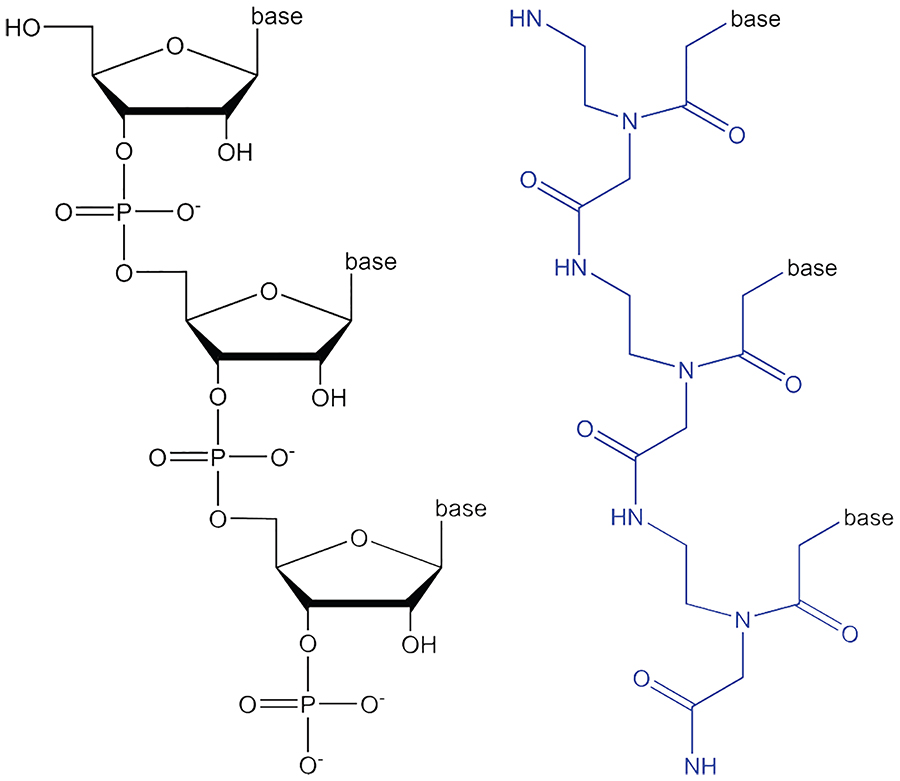
PNA is a synthetic nucleic acid analogue whose backbone contains N-(2-aminoethyl)-glycine units instead of sugar-phosphate units,4 while keeping natural bases as side chains (Figure 1). Structurally, the PNA backbone allows for classical base pairing of PNA both with itself and natural nucleic acids. The first complexes between a 10-mer thymine PNA and a complementary single- and double-stranded DNA were observed in 1991 by Nielsen et al.4 PNA binding can be both parallel and anti-parallel with respect to the 5’-terminus of nucleic acid strands. Further research on PNA complexes has shown that depending on the sequence, PNA oligomers can form duplexes, triplexes, triplex invasion, duplex invasion or double-duplex invasion complexes with DNA.5–7 The crystal and solution NMR structures of PNA-RNA,8,9 PNA-PNA10–13 and PNA-DNA14,15 complexes have been solved over the years and confirmed the duplex and triplex structures. The available structures also show a high intolerance to mismatches.9 PNA-PNA duplexes form so-called P-type helices that are wider and slower winding than the natural nucleic acid ones; they have 18 base pairs per turn and are about 28 Å wide.10
Figure 1:
The structure of RNA (left) and PNA (right) with the PNA backbone in blue.
PNA-containing duplexes are generally more thermally stable than the corresponding nucleic acid ones, and their stabilities practically do not depend on salt concentration.5,16,17 This is due to a lack of repulsion between the neutral PNA strand and the charged DNA or RNA strand. Additionally, the artificial backbone makes PNA resistant to enzymatic degradation by both proteases and nucleases.7,18
Since their first description in 1991,4 PNAs have attracted a lot of attention in regards to potential utility in biotechnology, diagnostics, and therapeutics.19 Especially promising applications include antigene and antisense therapies. The antigene PNAs are designed to recognize a sequence in the template DNA strand of a particular gene and interfere with transcription of that gene. By forming a triplex with DNA or by strand invasion they create a steric hindrance and block proper functioning of RNA polymerase. Antisense strategy uses a similar concept but PNAs are designed to hybridize with specific RNA sequences (typically mRNA) what results in blocking RNA processing, its transport into cytoplasm or translation. The drawbacks of PNA include their low solubility, poor membrane permeability, and ambiguity in binding orientation. To some extent these limitations can be addressed by attaching a soluble lysine to the PNA terminus, designing cell-penetrating peptides20 or vitamin B1221 as PNA carriers, or by further modifying the standard PNA monomers.19
PNA-DNA interactions are understood well, but the interactions of PNA with RNA have been characterized less extensively, probably due to the complicated architecture of RNA. However, a few in vitro studies of PNA targeting RNA have been noted.22–25 For example, PNA was found sensitive to sequence mismatches in RNA.23 PNA was also found to strand-invade an RNA hairpin.26 The thermal stability of PNA-RNA duplexes was found to be higher than that of PNA-DNA duplexes.27 To complement many antisense applications of PNA targeting mRNA28 but also rRNA26,29 and past thermodynamic studies performed on PNA complexes with DNA, we focus here on the thermal stability of PNA complexes with RNA.
To be able to design the sequences of PNA oligomers, their thermal stability with RNA needs to be understood at an atomistic level of detail. We have recently developed an improved force field for PNA molecules and their complexes with natural nucleic acids.30 Here we apply this force field to PNA and PNA complexes with RNA of a biologically relevant sequence. Since the mechanism of denaturation of PNA complexes with natural nucleic acids has not been investigated previously at an atomistic level of detail, we performed MD simulations at ambient and elevated temperatures to describe this mechanism. To complement the simulation studies we have also determined the thermodynamic properties of the duplexes by experimental techniques, namely ultraviolet (UV) monitored thermal melting and circular dichroism (CD) spectroscopy.
The sequence of the PNA oligomer (Nter-TGTTACGACT-Cter) was designed as a complement to the 16S RNA fragment of the E. coli ribosomal decoding site. 2’O-methyl RNA oligomers targeting the decoding fragment of 16S RNA were found to inhibit translation in a bacterial cell-free system,31 as well as in Escherichia coli cells.32 We performed UV-melting studies to determine thermal stabilities and melting temperatures of PNA-PNA, PNA-RNA and RNA-RNA duplexes of similar sequence (in RNA T was replaced with U). Next, using our recently developed force field for PNA,30 we simulated the melting (unfolding) of these duplexes with molecular dynamics simulations. The simulation-derived melting curves follow the two-state transition observed in UV experiments. The ordering of the simulation-derived thermal stabilities corroborates the experimentally-derived order. This suggests that the recent force field parameters enable studies of the dynamics of PNA-involving duplexes also at high temperatures and allowed us to gain further insights into the melting mechanism and energetic contributions to their stability.
Experimental and Theoretical Methods
Sequences
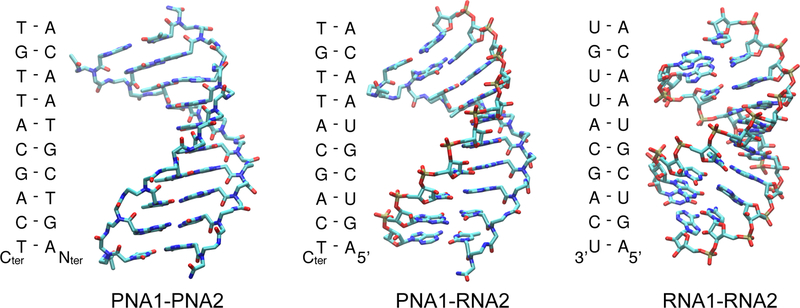
The mixed sequence of the PNA was chosen to be complementary to the bacterial ribosomal decoding site (Figure 2). It was previously found that this 10-mer 2’-O-methyl oligonucleotide binds to the 30S subunit and inhibits translation in a cell-free system.31 We have also previously studied 2’-O-methyl-RNA oligomers with similar sequences.32,33
Figure 2:
The secondary and tertiary structures of the PNA and RNA complexes (- denotes Watson-Crick base pairs). The C atoms are in cyan, N in blue, O in red and P in brown. For clarity the hydrogens are not shown.
Reagents
PNA1 and PNA2 with sequences (Nter → Cter) COCH3-TGTTACGACT-NH2 and COCH3-AGTCGTAACA-NH2, respectively, were obtained from Panagene, Korea, and RNA1 (5’-UGUUACGACU-3’) and RNA2 (5’-AGUCGUAACA-3’) from Metabion, Poland.
UV-monitored melting
The melting profiles were measured at 260 nm using the UV-Vis Nicolet Evolution 300 Spectrophotometer (Thermo Scientific). Complementary oligonucleotides were mixed at 4 μM concentration of each strand in 10 mM phosphate buffer with 20 mM NaCl at pH 7. The absorbance curves were fitted to a two-state model with sloping baselines34 from which the fraction of base paired molecules (f) as a function temperature (T) was calculated. The melting temperature (Tm) was defined as the temperature at which f(T) = 0.5.34,35 Each melting experiment was repeated five times.
From f(T), the temperature dependent binding constants Ka were calculated, using the equation appropriate for bimolecular (non-self complementary) complexes:34
| (1) |
where c0 is the concentration of a single strand. Next, the thermodynamic parameters were obtained by fitting the linear function to the van’t Hoff equation:34
| (2) |
where R is the ideal gas constant.
To compare the experiments at relatively dilute conditions (cexpt = 4 μM) with the higher effective concentration in the simulations (csim = 5–7 mM), we estimated Tm as a function of concentration. Equations 1 and 2 were combined at T=Tm, where f = 0.5, to result in the following expression:
| (3) |
Values of ΔG were extrapolated from the experimental values at concentration cexpt to the concentrations in the simulations, csim, according to:
| (4) |
Circular dichroism spectroscopy
CD was used to follow the formation of the secondary structure of the duplexes. CD spectra were recorded on a Biokine MOS-450/AF-CD spectrometer. Samples were placed in a quartz cuvette, dedicated to CD measurements, with a 10 mm path length, an acquisition time of 10 s, and a Xe/Hg lamp as a source of light. All the measurements were performed at 294 K in 10 mM phosphate buffer at pH 7.0 with 20 mM NaCl. The sample concentration was 3 μM of each strand. The instrument was calibrated directly before the measurements. A blank CD spectrum was recorded and subtracted from all recorded spectra. The spectra were smoothed with the Savitzky-Golay method.36
Starting structures for MD simulations
Initial structures of the duplexes were generated with the 3DNA program.37 The RNA-RNA system was built as a standard A-type RNA helix. The PNA-RNA and PNA-PNA duplexes were built using the helical parameters extracted from the crystal structures of such duplexes from the Protein Data Bank rcsb.org database;38 3MBS13 and 5EMG9 were used as templates for the PNA-PNA system, and 5EME9 and 5EMF9 for PNA-RNA. In PNA-containing duplexes, the PNA strand was first built as a DNA strand, and then the DNA backbone atom names were mapped to PNA according to a previously described protocol.39 An acetyl (COCH3) group was added to the N-terminus and an amide (NH2) group to the C-terminus of PNA, the same as in experimental studies.
Next, the initial PNA-containing models were energy minimized in vacuum; 50 steps with the steepest descent algorithm were followed by 500 steps with the adopted-basis Newton-Raphson algorithm. The first minimization round was performed with fixed nucleobase positions and peptide bond dihedral angles restrained with a force constant of 10 kcal/(mol·deg2) The second minimization round was performed with only nucleobase positions fixed.
Then, the solutes were immersed in cubic boxes filled with TIP3P water molecules,40 assuring at least 15 Å of water molecules from any solute atom to the edge of the box on each side. The negatively charged RNA were neutralized by adding Na+ ions that replaced water molecules at random positions. The resulting box edge lengths were 70.2 Å for PNA1-PNA2, 65.3 Å for PNA1-RNA2, and 63.7 Å for RNA1-RNA2. The complete systems contained about 30,000 atoms. The MMTSB41 toolset and the CHARMM42 program were used to prepare the starting systems.
Molecular dynamics simulation protocol
The solvated systems were energy minimized with steepest descent (100 steps) and adopted-basis Newton-Raphson (500 steps) algorithms. Next, the systems were gradually heated from 30 to 250 K for 20 ps in 10 K increments. During heating (up to 250 K), positional restraints were applied to solute heavy atoms with a force constant of 50 kcal/(mol·Å2). The restraints were then removed over eight 1 ns simulation rounds at 250 K lowering the force constant by half in each round. Subsequently, 5 ns simulations in the NPT ensemble were performed to adjust the box size with a target pressure set to 1 bar. Following this equilibration, the system was simulated in the NVT ensemble for 100 ns at 250 K.
To determine the melting profiles, the systems were further simulated at elevated temperatures. Five independent 200 ns-long simulations at different temperatures were performed with NAMD43 (version 2.13). The temperature was increased in 15 K increments from 250 to 475 K for RNA1-RNA2 and from 250 to 535 K for PNA1-RNA2 and PNA1-PNA2. In addition, 1 μs-long simulations were performed using CHARMM42 (version 43a1) together with OpenMM44 (version 7.1.1) with two replicates in 30 K steps in the temperature range of 250 to 490 K. To obtain better sampling of the melting transitions, additional 1 μs-long simulations were performed at 380 and 390 K for PNA1-RNA2, and at 410 and 420 K for PNA1-PNA2. To reach the different target temperatures, the systems were heated from the equilibrated structure at 250 K, in 10 K increments, with each step consisting of a 200 ps simulation where restraints with a 5 kcal/(mol·Å2) force constant were imposed on the nucleic acids. After reaching the target temperature, further equilibration was performed in three rounds, each for 200 ps, during which the restraints were released from 1 through 0.1 to 0 kcal/(mol·Å2).
All simulations were carried out using CHARMM force fields, specifically the CHARMM36 nucleic acid parameters for DNA45 and RNA,46 as well as our recently developed parameters for PNA.30 The CHARMM version of the TIP3P model40 was used to describe water molecules.
Trajectory analysis
Trajectories were analysed with the use of MMTSB41 and Amber Tools16.47 The hydrogen bonds were detected with MINT,48 with the following criteria, a maximum donor-acceptor distance of 3.5 Å and a minimal donor-hydrogen-acceptor angle of 150 degrees. VMD49 was used for visualisation and preparation of structural figures. Plots were prepared with the Grace tool (http://plasma-gate.weizmann.ac.il/Grace/) and the Matpltlib python library.50 Function fitting was done with gnuplot (version 5.2) and custom Monte Carlo scripts. RNA secondary structures were colored according to melting temperatures and drawn with VARNA.51
MMGBSA analysis52,53 was performed on the 200 ns and 1 μs trajectory snapshots, excluding the first 50 ns, at temperatures between 250 K and 500 K. Each energy term was evaluated as the difference between the energy of the duplex subtracted by the energies of each single strand. The total value of ΔGcalc was calculated as the sum of the molecular mechanics potential energy that included both bonded and non-bonded CHARMM force field terms (calculated in vacuum and without cutoff), a Generalized Born (GB) electrostatic solvation term using GB with Molecular Volume (GBMV)54,55 with CHARMM force field charges and Lennard-Jones radii, a solvent accessible surface area (SASA) term using a standard prefactor of 0.00542 kcal/(mol·Å2),56 and a TΔS term. The entropy term was calculated based on the sum of vibrational, rotational and translational entropy estimates obtained from snapshots taken every 40 ns. The vibrational term was calculated from normal mode analysis performed on energy-minimized conformations.
To further analyse energy as a function of temperature, functions of the form E(T) = a · exp(T/b) + c were fitted to the data from 250 K to 450 K (PNA1-PNA2), 250 K to 430 K (PNA1-RNA2), and 250 K to 375 K (RNA1-RNA2), respectively, to include the melting temperature but exclude data points with large statistical uncertainties at the highest temperatures. Interpolation at 295 K gave thermodynamic values that can be compared to the experimental results. Moreover, we obtained an estimate of Tm from the condition that ΔG = 0 at the melting temperature.
The kinetics of the melting process of a duplex AB to single strands A and B
| (5) |
was analysed via the Arrhenius equation that relates the melting rate kmelting to the activation energy Ea and a pre-factor A according to:
| (6) |
For analysis it is also convenient to consider the following form of the Arrhenius equation:
| (7) |
Furthermore, we assumed first-order kinetics, so that
| (8) |
The combination of Equations 6 and 8 gives the following expression for the fraction of intact duplexes, fduplex, under the assumption that there are no re-annealing transitions:
| (9) |
We define Th(t) as the temperature at which half of the duplexes are melted after a given time t in the case where only melting is observed and the time is too short to establish an equilibrium between melting and re-annealing. Th is then obtained from Eq. 9 by requiring [AB]/[AB]0 = 0.5:
| (10) |
The quantity Th(t) can be viewed as an apparent time-dependent melting temperature that can be extracted from short molecular dynamics simulations. However, at long time scales, Th(t) underestimates the equilibrium thermodynamic value of Tm since re-annealing transitions are not considered.
When analysing the melting kinetics from the simulations, kmelting was obtained as the inverse of the average time that it takes for the duplex to fully melt. Complete melting was assumed when the number of hydrogen bonds, calculated with the above criteria, decreased to zero. Only temperatures at which full melting occurred in at least two MD replicates were considered.
Results and discussion
Secondary structures from circular dichroism spectra
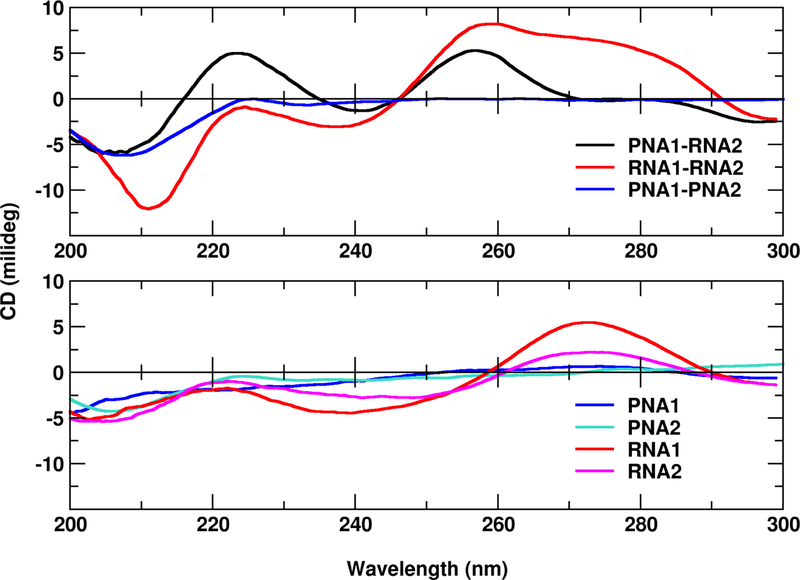
To confirm that the studied PNA and RNA sequences associate to form helical duplexes, we have recorded the CD spectra for their single and double strands (Figure 3). PNA is an achiral molecule and therefore does not show any circular dichroism unless chiral groups are incorporated.57 However, in our melting studies we did not want to modify the standard PNA structure to be able to compare its properties with RNA of similar sequence. Thus, the CD spectrum of the PNA1-PNA2 hybrid also does not show any characteristic CD pattern. However, after PNA is incubated with a complementary RNA strand, the induced helicity could be observed. The detected PNA1-RNA2 spectrum is similar as presented in Corradini et al.57 for a 10-mer PNA-RNA duplex. We observe maxima close to 260 nm and 220 nm, a minimum near 210 nm and a small negative band between 290 and 300 nm. The locations of these peaks indicate a helical structure resembling the A-form RNA.58,59 This is in agreement with the observation that PNA-RNA right-handed helices adopt A-like helices.9
Figure 3:
CD spectra for RNA and PNA single and double strands. For sequences see Figure 2.
Single-stranded RNA1 and RNA2 show CD spectra with secondary structure signatures. For double-stranded RNA1-RNA2, the main peak around 270 nm is blue-shifted in comparison to the single-stranded RNA spectra (Figure 3), which has been previously observed.59 The peak positions of RNA1-RNA2 are indicative of an A-form RNA duplex.59
Stabilities of the duplexes from thermal denaturation experiments
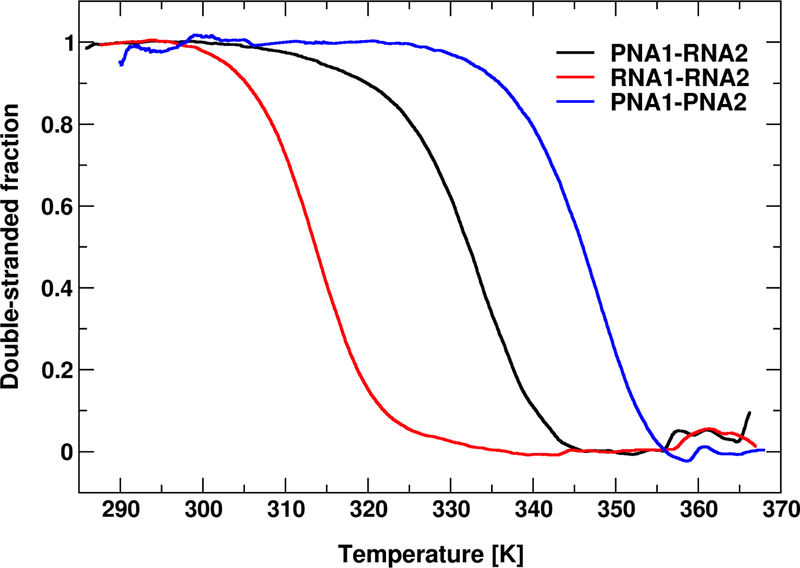
Melting of the duplexes was measured with UV spectroscopy by monitoring absorbance as a function of temperature. The curves were then transformed to show the fractions of base-paired complexes (f) as a function of temperature (see Methods). As shown in Figure 4, two-state sharp transitions were observed for all duplexes. The mixed PNA1-RNA2 duplex was found to be thermally more stable than RNA1-RNA2, whereas PNA1-PNA2 was the most stable. Melting temperatures defined by f(Tm) = 0.5 confirm the same order of duplex stability: PNA1-PNA2 > PNA1-RNA2 > RNA1-RNA2 (Table 1).
Figure 4:
Melting profiles of the duplexes presented as a fraction of paired bases vs. temperature. For sequences see Figure 2.
Table 1:
Melting temperatures (in K) and binding free energy contributions (in kcal/mol, calculated for T = 295 K) derived from UV-monitored melting experiments and MD simulations.
| Observable | PNA1-PNA2 | PNA1-RNA2 | RNA1-RNA2 |
|---|---|---|---|
| from thermal melting experiments | |||
| Tm [K] | 347.0 (0.6) | 332.8 (0.3) | 314.6 (0.6) |
| ΔGUV [kcal/mol] | −21.8 (1.0) | −17.1 (0.9) | −13.3 (0.5) |
| ΔHUV [kcal/mol] | −92.6 (5.7) | −80.8 (7.7) | −86.3 (4.2) |
| TΔSUV [kcal/mol] | −70.8 (4.8) | −63.7 (6.9) | −73.0 (3.8) |
| experimental data extrapolated to MD simulation concentrations | |||
| csim [mM] | 5 | 6 | 7 |
| Tm (Eq. 3) [K] | 368.4 | 356.2 | 334.3 |
| ΔG (Eq. 4) [kcal/mol] | −26.0 | −21.4 | −17.7 |
| from MD simulations | |||
| Tm (ΔG = 0) [K] | 418.4 (2.0) | 365.4 (10.0) | 331.1 (3.7) |
| ΔGcalc [kcal/mol] | −44.8 (1.1) | −32.0 (5.6) | −17.1 (2.0) |
| ΔGGB +ΔGSASA + ΔGelec [kcal/mol] | −28.6 (0.6) | −19.0 (1.6) | 17.6 (2.8) |
| ΔGvdW [kcal/mol] | −56.7 (0.1) | −56.9 (0.7) | −58.2 (1.9) |
| TΔS [kcal/mol] | −40.7 (1.5) | −44.7 (4.3) | −24.4 (2.5) |
Values in parentheses represent standard errors of the mean. For ΔGcalc calculations and its contributions see Methods. ΔGvdW reflects the Lennard-Jones energy term. Energy errors from MD simulations were calculated at 295 K. Errors in the Tm estimates from simulation were obtained by applying the uncertainty in ΔGcalc when estimating Tm from the exponential fit.
Melting of the duplexes in MD simulations
In the all-atom MD simulations duplexes remained stable at lower temperatures but melted at higher temperatures. Although complete melting could be observed, even simulations over 1 μs were too short to establish a full equilibrium between melting and re-hybridization. Such convergence has so far only been achieved for very small RNA tetraloops60 and is not feasible with available computational resources for the larger duplexes studied here. Therefore, we employed MMGBSA analysis to extract equilibrium thermodynamic data and otherwise analysed the simulations only with respect to the kinetic process of melting.
Thermodynamics of melting:
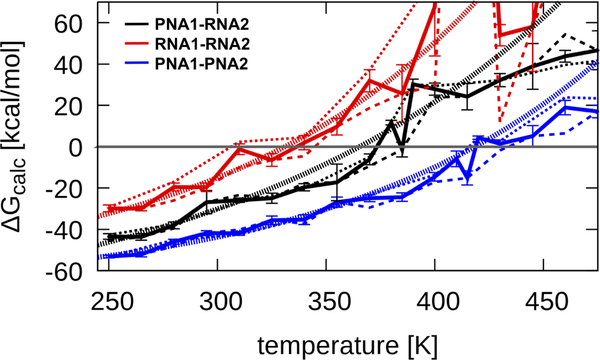
We carried out MMGBSA analysis using snapshots of intact duplexes and melted configurations (see Methods). The resulting estimates of ΔG and its components are given in Table 1. The order of binding suggested by ΔGUV and ΔGcalc is the same, indicating that qualitatively, the MMGBSA results match the experiment, with the PNA1-PNA2 complex being the most and RNA1-RNA2 the least energetically favorable. There is good agreement between the energy terms derived from 200 ns and 1 μs trajectories for most temperatures (see Figure 5) indicating that the simulations presented here are long enough to obtain sufficiently converged energetic estimates.
Figure 5:
Binding free energy ΔGcalc as a function of temperature extracted from MD simulations. Data from 200 ns and 1 μs simulations is shown as thin dashed lines, combined data with error bars is shown as a thick solid line. Exponential functions of the form a · ex/b + c that were fit to the data are indicated as thick dotted lines. Coefficients of the fitted functions are for PNA1-PNA2: a=2.364 kcal/mol, b=123.09 K, c=−70.80 kcal/mol; for PNA1-RNA2: a=9.2086 kcal/mol, b=160.295 K, c=−90.00 kcal/mol; and for RNA1-RNA2: a=4.425 kcal/mol, b=122.09 K, c=−66.64 kcal/mol. Error bars represent the standard errors of the mean.
A quantitative comparison between experiment and simulation requires that the experimental results for ΔG are adjusted for the higher concentration in the simulations (via Eq. 4). Based on the adjusted values (see Table 1), the simulations are in excellent agreement for RNA1-RNA2 but are more favorable in the simulation for PNA1-PNA2 and PNA1-RNA2 duplexes. Discrepancies between experiment and simulation are likely due to the assumptions made during the MMGBSA analysis. One assumption is that the conformations sampled by the single strands are the same as in the duplexes, which is almost certainly not the case, especially for PNA (see below). Another assumption is that at high temperatures every conformation in the simulation is considered a duplex even if the helix is melted and the strands are separated from each other. In addition, both water molecules and ions were not taken into account in the MMGBSA analysis. The charged RNA is surrounded by closely interacting ions but monovalent ion positions fluctuate in MD, which would lead to significant energy fluctuations if ions bound to RNA were included in the analysis. We thus assumed that the degree of ion binding to the duplexes and single strands is roughly similar so that the ΔG of single-strand association to form a duplex is unaffected.
ΔGcalc as a function of simulation temperature, shown in Figure 5, allows the extraction of melting temperatures based on the condition of ΔG = 0 (see Methods). The resulting estimates of Tm are given in Table 1. Since these values were estimated based on ensembles of duplexes and melted states without requiring reversible transitions between the two states, a comparison with experiment is possible, but experimental values have to be corrected again for the higher concentration in the simulations (via Eq. 3). There is agreement for RNA1-RNA2 and PNA1-RNA2 duplexes but the simulations overestimate the melting temperature somewhat for the PNA1-PNA2 system.
Since we obtained a reasonable qualitative agreement between the experimental and calculated binding energies and melting temperatures, we further analysed the contributions to the total ΔGcalc. One observation is that the electrostatic term is favorable for PNA1-PNA2 and PNA1-RNA2 and unfavorable for RNA1-RNA2, which is expected due to the neutral backbone of PNA. Van der Waals (vdW) interactions are similarly favorable in all cases probably because the base sequences are similar (the only difference is that in PNA there is T instead of U) and direct contacts between strands occur via base pair hydrogen bonds. The calculated TΔS term only captures the contribution of solute entropy to the binding free energy. We note, that this term cannot be compared directly to the experimental TΔSUV term, which also includes solvent entropy changes. All of the complexes are entropically unfavorable, which is expected, but the entropic cost of association is lower for RNA1-RNA2 than for PNA1-PNA2 and PNA1-RNA2. One explanation could be that the high charge of the RNA phosphate backbone leads to charge repulsion along the RNA strand, which would make it stiffer than PNA, and therefore there would be less of a penalty for duplex formation. Indeed, as shown by CD spectroscopy, RNA1 and RNA2 single strands form secondary structures thus they are already pre-organized to form an A-like RNA duplex (Figure 3). On the other hand, PNA single strands form compact structures in solution,61,62 with a conformationally variable backbone. This happens due to backbone neutrality and many rotatable bonds, as well as stacking interactions between bases non-neighboring in the sequence. Thus PNA strands need to extend and increase their order more than RNA to form duplexes.
Kinetics of melting transitions:
Although the MD simulations are too short to establish an equilibrium between melting and re-hybridization, it is possible to extract kinetic information about the melting transition.
Denaturation was quantified by monitoring the number of Watson-Crick type hydrogen bonds as a function of simulation temperature. Melting was defined as the loss of at least 50 % of the Watson-Crick type hydrogen bonds of the starting base pairing pattern. Terminal residues were excluded from analysis. This criterion followed a recent MD study of RNA.60
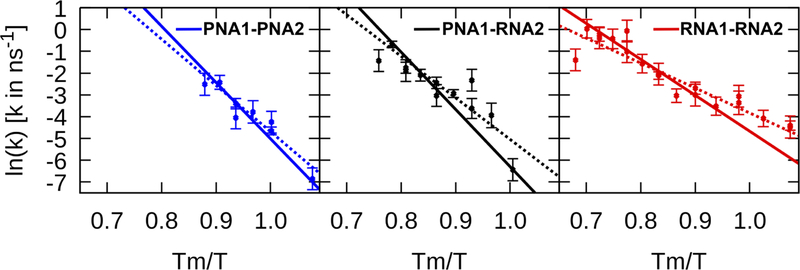
Figure 6 shows the rate of duplex melting as a function of Tm/T with temperature T and the calculated Tm values from Table 1. The presence of the points above Tm/T = 1 shows that in some cases full melting of the duplex was observed below the estimated melting temperature Tm. A linear relationship between ln(k) and 1/T suggests Arrhenius behavior. Fits of Eq. 6 allow the extraction of activation energies and pre-factors as listed in Table 2. From the fits to ln(k) vs. 1/T, we estimated the melting rates at Tm as well as at 295 K (see results in Table 2).
Figure 6:
Rates for the melting of the duplexes as a function of the inverse temperature Tm/T. Dashed and solid lines show ln(k) vs. Tm/T according to the Arrhenius function as given in Eq. 7. Values for Ea and A were taken from Table 2 and values for Tm were obtained from the MMGBSA estimates as given in Table 1. Dashed lines represent values of Ea and A where the simulation data was fitted only to Eq. 6. Solid lines reflect Ea and A values that were obtained from a combined fit of the melting rates to Eq. 6, and the fraction of melted duplexes and Th as a function of simulation time to Eqs. 9 and 10. Errors represent the standard error of the mean if there were three or more samples for a data point. For one or two samples, we assumed an error of 0.5 log units.
Table 2:
Activation energies and exponential pre-factors in Eq. 6 from fits of simulation data.
| Observable | PNA1-PNA2 | PNA1-RNA2 | RNA1-RNA2 |
|---|---|---|---|
| from fit of Arrhenius equation (Eq. 6) | |||
| Ea [kcal/mol] | 18.16 | 14.09 | 7.58 |
| A [ns−1] | 1.507 · 107 | 1.233 · 106 | 2.037 · 103 |
| kmelting@Tm [ns−1] | 9.191 · 106 | 6.439 · 106 | 2.167 · 107 |
| kmelting@295K [ns−1] | 530.4 | 44938.3 | 4.937 · 106 |
| from simultaneous fits to Eqs 6, 9, and 10 | |||
| Ea [kcal/mol] | 22.10 | 19.41 | 10.92 |
| A [ns−1] | 1.086 · 109 | 4.749 · 108 | 1.366 · 105 |
| kmelting@Tm [ns−1] | 6.620 · 106 | 1.806 · 106 | 9.365 · 106 |
| kmelting@295K [ns−1] | 45.9 | 1968.2 | 1.112 · 106 |
The highest activation energy Ea for PNA1-PNA2 and the lowest value for RNA1-RNA2 confirm that the PNA1-PNA2 duplex requires higher temperatures to initiate melting. However, the melting rates at T = Tm are relatively similar and not in the same order as the activation energies or melting temperatures with RNA1-RNA2 > PNA1-PNA2 > PNA1-RNA2.
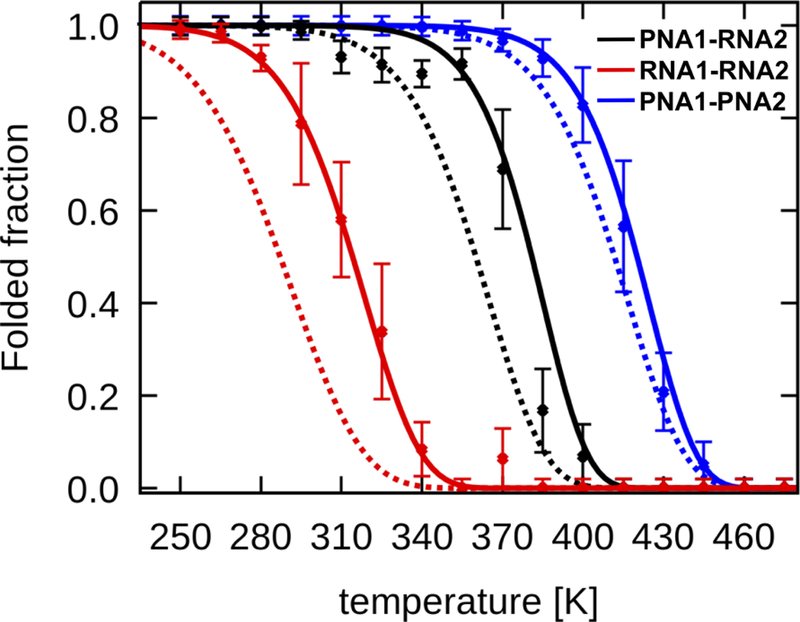
We further analyzed the fraction of folded duplexes as a function of temperature after different simulation times. The number of frames with melted duplexes was averaged from the simulation trajectories during ± 10 ns around each time point. The resulting melting curves exhibit relatively sharp transitions between folded and melted states. As an example, melting curves obtained at 200 ns simulation time are shown in Figure 7. The sharp transitions were fit to a logistic function:
| (11) |
where Th is the midpoint temperature where half of the duplexes are melted and k is a logistic curve growth rate.
Figure 7:
Simulation melting profiles of the duplexes presented as the folded fraction versus temperature calculated based on MD trajectories, from 190 ns to 210 ns. Functions using Eq. 9 with the values in Table 2 are shown as dashed lines (fit only based on Eq. 6) and solid lines (fit based on Eqs. 6, 9, and 10, see text). Error bars represent the standard error of the mean.
The midpoint temperatures Th extracted from this analysis also increase in the order RNA1-RNA2 < PNA1-RNA2 < PNA1-PNA2 and are of similar magnitude as the equilibrium melting temperatures Tm given in Table 1.
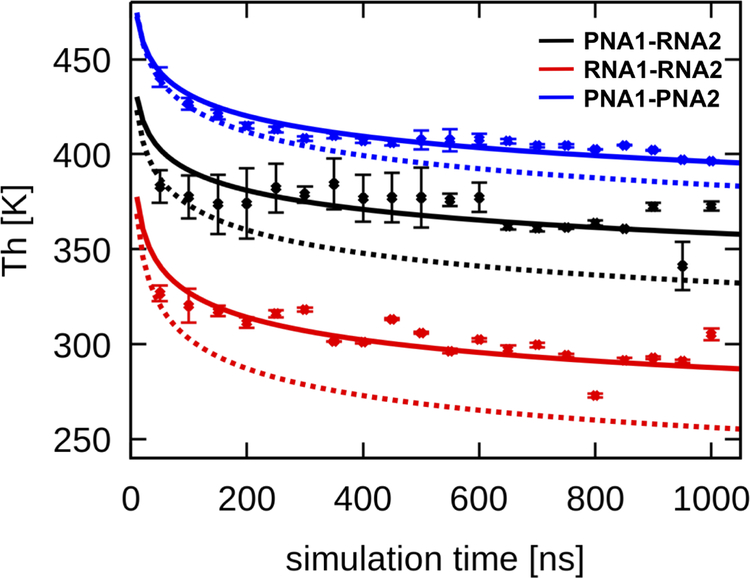
Since the simulations only cover the initial kinetic time regime of melting, the melting curves and the extracted midpoint temperatures Th change as a function of simulation time as shown in Figure 8.
Figure 8:
Melting temperatures calculated based on 20 ns intervals from MD trajectories. Error bars represent χ2 residual values from the fit of the logistic function to the melting profiles. Functions using Eq. 10 with the values in Table 2 are shown as dashed lines (fit only based on Eq. 6) and solid lines (fit based on Eqs. 6, 9, and 10, see text).
Assuming first-order kinetics for the melting transition, Eq. 9 is expected to describe the melting profiles shown in Figure 7 whereas Eq. 10 should describe the observed time dependence of Th shown in Figure 8. Applying Eqs. 9 and 10 with the estimated values of Ea and A from Table 2 based on the Arrhenius fit alone gives qualitative but not good quantitative agreement with the simulation results (see dashed lines in Figs. 7 and 8). However, the agreement can be improved significantly by re-fitting Ea and A to simultaneously optimize the agreement of the kinetic rates with Eq. 6, the melting profiles with Eq. 9, and the time dependence of Th to Eq. 10. The resulting values of Ea and A are given in Table 2. The fitted functions with the optimized values are shown as solid lines in Figures 6, 7, and 8. The re-fitted values of Ea and A and the resulting estimates of melting rates change only slightly from the initial fit of just ln(k) vs. 1/T indicating that the melting transitions observed in the simulations indeed observe first-order kinetics.
Stability of base pairs in MD simulations:
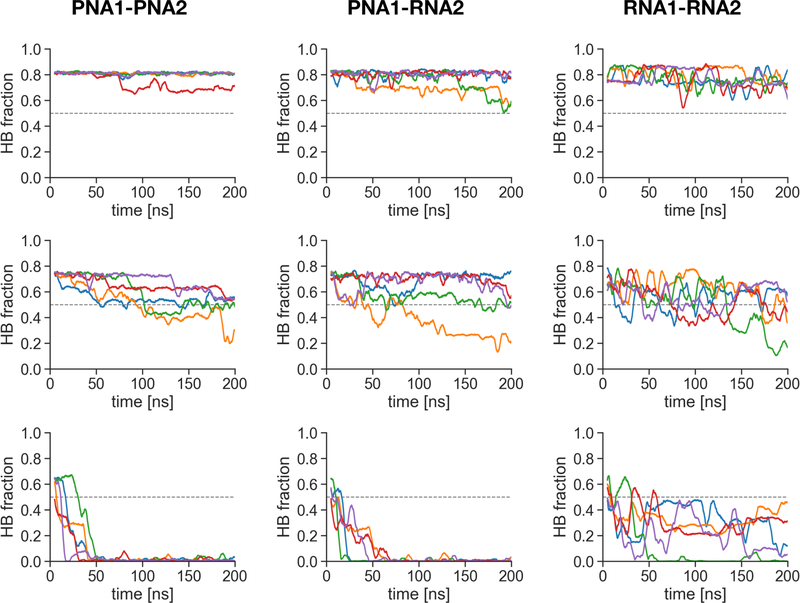
To gain more detailed insights into the melting process, we monitored the number of classical WC-type hydrogen bonds as a function of the simulation time. Figure 9 shows the fractions of WC hydrogen bonds at selected temperatures. At low temperatures (60 K below Th(200 ns)), the PNA1-PNA2 duplex is the most stable and the hydrogen bonds in the RNA1-RNA2 duplex fluctuate the most even though the secondary structure of the duplex is preserved. Close to the melting temperatures the fraction of WC-bonds fluctuates around the mid-point for the RNA1-RNA2 duplex, showing a stochastic-like back and forth behavior. For PNA1-PNA2 and PNA1-RNA2 close to Th we observe a rather continuous decrease of WC-type hydrogen bonds. Overall, the melting transition for the PNA1-PNA2 duplex seems to be more cooperative because of the sharper transitions and lower fluctuations in individual trajectories at temperatures close to and above Th
Figure 9:
Time-dependence of the fraction of the WC hydrogen bonds (HB fraction) during 200 ns MD simulations at temperatures 5 K below the temperature midpoint Th at 200 ns for each duplex (middle plots), as well as Th ± 60 K (top and bottom plots). Each color denotes different simulation replica. 1 on the Y-axis corresponds to 20 classical WC hydrogen bonds in the duplexes not counting the terminal base pairs (for criteria see Methods). Data are shown as running averages computed over 5 ns time windows.
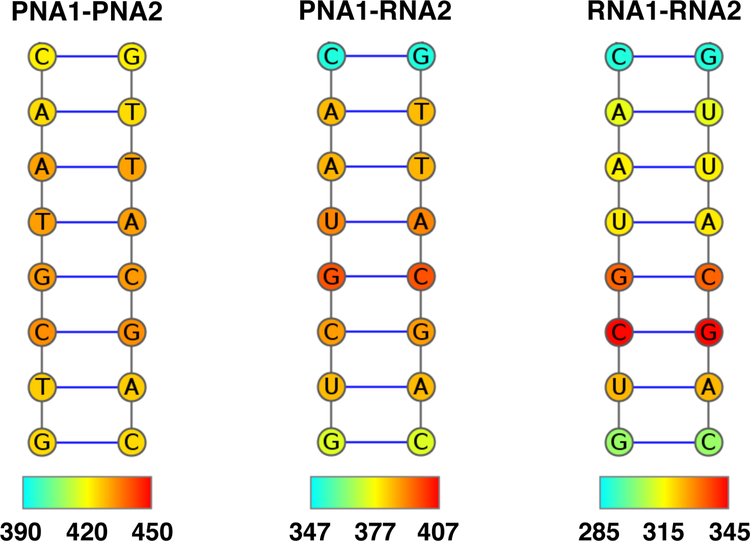
We further characterised the midpoint temperature Th for individual base pairs at 175 ns based on the melting curves averaged between 150 and 200 ns (see Figure 10). The analysis shows that melting of the PNA1-PNA2 duplex occurs most cooperatively since there is a similar temperature range for all base pairs. For PNA1-RNA2 and RNA1-RNA2, the melting starts at the termini whereas higher temperatures are needed to melt the central part of the duplex.
Figure 10:
Stability of individual base pairs presented as the midpoint temperatures Th of single base pairs from 150 to 200 ns of MD trajectories. Color bars cover the range of ± 30 K from the midpoint temperatures Th at 175 ns (in K) of the whole duplex.
Conclusions
We have applied our previously developed PNA force field30 to investigate the structural and thermal dynamics of PNA-PNA and PNA-RNA 10-mer duplexes. The analysis of hydrogen bonds between stacked bases as a function of temperature shows a two-state transition during thermal melting of these duplexes. The Tm values derived from the simulations (based on thermodynamic MMGBSA analysis) reproduce the order of thermal stabilities determined experimentally and there is good quantitative agreement, in particular for the RNA-RNA and RNA-PNA helices. Kinetic analysis of the melting process provides activation energies that are also increasing from RNA-RNA to PNA-RNA and PNA-PNA, although the melting rates at the respective melting temperature are similar. Further analyses of the atomistic details of base pairing suggest that the PNA-PNA duplex melts cooperatively and as a whole fragment. This is probably due to the neutral backbone of PNA. On the other hand, the RNA-containing duplexes start to unfold from the termini in a more zipper-like fashion.
Acknowledgement
The authors acknowledge support from National Science Centre (UMO- 2014/12/W/ST5/00589 to JT, JM, and UMO-2017/26/M/NZ1/00827 to JT) and US National Institutes of Health grant R35 GM126948 (to MF). JT thanks the Polish-U.S. Fulbright Commission and the Kosciuszko Foundation. Simulations were performed at Interdisciplinary Centre for Mathematical and Computational Modelling University of Warsaw (G31–4, GB77–7, GB74–7). JT and MJ would like to thank Dr. Maciej Dlugosz for helpful discussions at the initial stage of this project.
References
- (1).Helene C; Toulme J-J Specific regulation of gene expression by antisense, sense and antigene nucleic acids. Biochimica et Biophysica Acta 1990, 1049, 99–125. [DOI] [PubMed] [Google Scholar]
- (2).Summerton J; Weller D Morpholino antisense oligomers: Design, preparation, and properties. Antisense Nucleic Acid Drug. Dev 1997, 7, 187–195. [DOI] [PubMed] [Google Scholar]
- (3).Koshkin AA; Singha SK; Nielsen P; Rajwanshi VK; Kumar R; Meldgaard M; Olsen CE; Wengel J LNA (Locked Nucleic Acids): Synthesis of the adenine, cytosine, guanine, 5-methylcytosine, thymine and uracil bicyclonucleoside monomers, oligomerisation, and unprecedented nucleic acid recognition. Tetrahedron 1998, 54, 3607–3630. [Google Scholar]
- (4).Nielsen PE; Egholm M; Berg RH; Buchardt O Sequence-selective recognition of DNA by strand displacement with a thymine-substituted polyamide. Science 1991, 254 1497–1500. [DOI] [PubMed] [Google Scholar]
- (5).Nielsen PE, Ed. Peptide Nucleic Acids Protocols and Applications; Horizon Bioscience: Norfolk NR18 0JA, UK, 2004; Vol. second edition. [Google Scholar]
- (6).Bentin T; Hansen GL; Nielsen PE In Methods in Molecular Biology; Nielsen PE, Ed.; Humana Press Inc., Totowa, NJ, 2002; Vol. 208; pp 91–109. [DOI] [PubMed] [Google Scholar]
- (7).Lundin KE; Good L; Stromberg R; Graslund A; Smith CIE Biological activity and biotechnological aspects of peptide nucleic acid. Adv. Genet 2006, 56, 1–51. [DOI] [PubMed] [Google Scholar]
- (8).Brown SC; Thomson SA; Veal JM; Davis DG NMR solution structure of a peptide nucleic acid complexed with RNA. Science 1994, 265, 777–780. [DOI] [PubMed] [Google Scholar]
- (9).Kiliszek A; Banaszak K; Dauter Z; Rypniewski W The first crystal structures of RNA-PNA duplexes and a PNA-PNA duplex containing mismatches – toward antisense therapy against TREDs. Nucl. Acids Res 2016, 44, 1937–1943. [DOI] [PMC free article] [PubMed] [Google Scholar]
- (10).Rasmussen H; Kastrup JS; Nielsen JN; Nielsen JM; Nielsen PE Crystal structure of a peptide nucleic acid (PNA) duplex at 1.7 A resolution. Nat. Struct. Biol 1997, 4, 98–101. [DOI] [PubMed] [Google Scholar]
- (11).Petersson B; Nielsen BB; Rasmussen H; Larsen IK; Gajhede M; Nielsen PE; Kastrup JS Crystal structure of a partly self-complementary peptide nucleic acid (PNA) oligomer showing a duplex–triplex network. J. Am. Chem. Soc 2005, 127, 1424–1430. [DOI] [PubMed] [Google Scholar]
- (12).He W; Hatcher E; Balaeff A; Beratan DN; Gil RR; Madrid M; Achim C Solution structure of a peptide nucleic acid duplex from NMR data: features and limitations. J. Am. Chem. Soc 2008, 130, 13264–13273. [DOI] [PubMed] [Google Scholar]
- (13).Yeh JI; Pohl E; Truan D; He W; Sheldrick GM; Du S; Achim C The crystal structure of non-modified and bipyridine-modified PNA duplexes. Chem. Eur. J 2010, 16, 11867–11875. [DOI] [PMC free article] [PubMed] [Google Scholar]
- (14).Betts L; Josey JA; Veal JM; Jordan SR A nucleic acid triple helix formed by a peptide nucleic acid-DNA complex. Science 1995, 270, 1838–1841. [DOI] [PubMed] [Google Scholar]
- (15).Eriksson M; Nielsen PE Solution structure of a peptide nucleic acid-DNA duplex. Nat. Struct Biol 1996, 3, 410–413. [DOI] [PubMed] [Google Scholar]
- (16).Egholm M; Buchardt O; Christensen L; Behrens C; Freier SM; Driver DA; Berg RH; Kim SK; Norden B; Nielsen PE PNA hybridizes to complementary oligonucleotides obeying the Watson-Crick hydrogen bonding rules. Nature 1993, 365, 566–568. [DOI] [PubMed] [Google Scholar]
- (17).Shakeel S; Karim S; Ali A Peptide nucleic acid (PNA) – a review. J. Chem. Technol. Biotechnol 2006, 81, 892–899. [Google Scholar]
- (18).Demidov VV; Potaman VN; Frank-Kamenetskii MD; Egholm M; Buchard O; Sonnichsen SH; Nielsen PE Stability of peptide nucleic acids in human serum and cellular extracts. Biochem. Pharmacol 1994, 48, 1310–1313. [DOI] [PubMed] [Google Scholar]
- (19).Gupta A; Mishrab A; Puri N Peptide nucleic acids: Advanced tools for biomedical applications. J. Biotech 2017, 259, 148–159. [DOI] [PMC free article] [PubMed] [Google Scholar]
- (20).Hansen AM; Bonke G; Larsen CJ; Yavari N; Nielsen PE; Franzyk H Antibacterial peptide nucleic acid-antimicrobial peptide (PNA-AMP) conjugates: Antisense targeting of fatty acid biosynthesis. Bioconjug. Chem 2016, 27, 863–867. [DOI] [PubMed] [Google Scholar]
- (21).Rownicki M; Wojciechowska M; Wierzba AJ; Czarnecki J; Bartosik D; Gryko D; Trylska J Vitamin B12 as a carrier of peptide nucleic acid (PNA) into bacterial cells. Sci. Rep 2017, 7, 7644. [DOI] [PMC free article] [PubMed] [Google Scholar]
- (22).Li M; Zengeya T; Rozners E Short peptide nucleic acids bind strongly to homopurine tract of double helical RNA at pH 5.5. J. Am. Chem. Soc 2010, 132, 8676–8681. [DOI] [PMC free article] [PubMed] [Google Scholar]
- (23).Gupta P; Zengeya T; Rozners E Triple helical recognition of pyrimidine inversions in polypurine tracts of RNA by nucleobase-modified PNA. Chem. Commun. (Camb.) 2011, 47, 11125–11127. [DOI] [PMC free article] [PubMed] [Google Scholar]
- (24).Gupta P; Muse O; Rozners E Recognition of double-stranded RNA by guanidine-modified peptide nucleic acids. Biochemistry 2012, 51, 63–73. [DOI] [PMC free article] [PubMed] [Google Scholar]
- (25).Zengeya T; Li M; Rozners E PNA containing isocytidine nucleobase: synthesis and recognition of double helical RNA. Bioorg. Med. Chem. Lett 2011, 21, 2121–2124. [DOI] [PMC free article] [PubMed] [Google Scholar]
- (26).Kulik M; Markowska-Zagrajek A; Wojciechowska M; Grzela R; Witula T; Tryl-ska J Helix 69 of Escherichia coli 23S ribosomal RNA as a peptide nucleic acid target. Biochimie 2017, 138, 32–42. [DOI] [PubMed] [Google Scholar]
- (27).Jensen KK; Orum H; Nielsen PE; Norden B Kinetics for hybridization of peptide nucleic acids (PNA) with DNA and RNA studied with the BIAcore technique. Biochemistry 1997, 36, 5072–5077. [DOI] [PubMed] [Google Scholar]
- (28).Równicki M; Pieńko T; Czarnecki J; Kolanowska M; Bartosik D; Trylska J Artificial activation of Escherichia coli mazEF and hipBA toxin–antitoxin systems by antisense peptide nucleic acids as an antibacterial strategy. Front. Microbiol 2018, 9, 2870. [DOI] [PMC free article] [PubMed] [Google Scholar]
- (29).Trylska J; Thoduka SG; Dąbrowska Z Using sequence-specific oligonucleotides to inhibit bacterial rRNA. ACS Chem. Biol 2013, 8, 1101–1109. [DOI] [PubMed] [Google Scholar]
- (30).Jasiński M; Feig M; Trylska J Improved force fields for peptide nucleic acids with optimized backbone torsion parameters. J. Chem. Theory Info 2018, 14, 3603–3620. [DOI] [PubMed] [Google Scholar]
- (31).Abelian A; Walsh AP; Lentzen G; Aboul-Ela F; Gait MJ Targeting the A site RNA of the E. coli ribosomal 30S subunit by 2’-O-methyl oligoribonucleotides: a quantitative equilibrium dialysis binding assay and differential effects of aminoglycoside antibiotics. Biochem. J 2004, 383, 201–208. [DOI] [PMC free article] [PubMed] [Google Scholar]
- (32).Thoduka SG; Zaleski PA; Dąbrowska Z; Równicki M; Strózecka J; Górska A; Olejniczak M; Trylska J Analysis of ribosomal inter-subunit sites as targets for complementary oligonucleotides. Biopolymers 2017, 107, e23004. [DOI] [PubMed] [Google Scholar]
- (33).Jasiński M; Kulik M; Wojciechowska M; Stolarski R; Trylska J Interactions of 2’-O-methyl oligoribonucleotides with the RNA models of the 30S subunit A-site. PLoS ONE 2018, 13, e0191138. [DOI] [PMC free article] [PubMed] [Google Scholar]
- (34).Mergny J-L; Lacroix L Analysis of thermal melting curves. Oligonucleotides 2003, 13, 515–537. [DOI] [PubMed] [Google Scholar]
- (35).Puglisi JD; Tinoco I Absorbance melting curves of RNA. Methods Enzymol 1989, 180, 304–325. [DOI] [PubMed] [Google Scholar]
- (36).Savitzky A; Golay MJE Smoothing and differentiation of data by simplified least squares procedures. Anal. Chem 1964, 36, 1627–1639. [Google Scholar]
- (37).Xiang-Jun L; Olson W 3DNA: a software package for the analysis, rebuilding and visualization of three–dimensional nucleic acid structures. Nucleic Acids Res 2003, 31, 5108–5121. [DOI] [PMC free article] [PubMed] [Google Scholar]
- (38).Berman HM; Westbrook J; Feng Z; Gilliland G; Bhat TN; Weissig H; Shindyalov IN; Bourne PE The Protein Data Bank. Nucleic Acids Res 2000, 28, 235–242. [DOI] [PMC free article] [PubMed] [Google Scholar]
- (39).Sen S; Nilsson L Molecular dynamics of duplex systems involving PNA: structural and dynamical consequences of the nucleic acid backbone. J. Am. Chem. Soc 1998, 120, 619–631. [Google Scholar]
- (40).Jorgensen WL; Chandrasekhar J; Madura JD; Impey RW; Klein ML Comparison of simple potential functions for simulating liquid water. J. Chem. Phys 1983, 79, 926–935. [Google Scholar]
- (41).Feig M; Karanicolas J; Brooks CL MMTSB tool set: Enhanced sampling and multiscale modeling methods for applications in structural biology. J. Mol. Graph. Model 2004, 22, 377–395. [DOI] [PubMed] [Google Scholar]
- (42).Brooks BR; Brooks CL; Mackerell AD; Nilsson L; Petrella RJ; Roux B; Won Y; Archontis G; Bartels C; Boresch S et al. CHARMM: the biomolecular simulation program. J. Comput. Chem 2009, 30, 1545–1614. [DOI] [PMC free article] [PubMed] [Google Scholar]
- (43).Phillips JC; Braun R; Wang W; Gumbart J; Tajkhorshid E; Villa E; Chipot C; Skeel RD; Kalé L; Schulten K Scalable molecular dynamics with NAMD. J. Comput. Chem 2005, 26, 1781–1802. [DOI] [PMC free article] [PubMed] [Google Scholar]
- (44).Eastman P; Swails J; Chodera JD; McGibbon RT; Zhao Y; Beauchamp KA; Wang L-P; Simmonett AC; Harrigan MP; Stern CD et al. OpenMM 7: Rapid development of high performance algorithms for molecular dynamics. PLoS Comput. Biol 2017, 13, e1005659. [DOI] [PMC free article] [PubMed] [Google Scholar]
- (45).Hart K; Foloppe N; Baker CM; Denning EJ; Nilsson L; MacKerell AD Jr. Optimization of the CHARMM additive force field for DNA: Improved treatment of the BI/BII conformational equilibrium. J. Chem. Theory Comput 2012, 8, 348–362. [DOI] [PMC free article] [PubMed] [Google Scholar]
- (46).Denning EJ; Priyakumar UD; Nilsson L; MacKerell AD Impact of 2’-hydroxyl sampling on the conformational properties of RNA: Update of the CHARMM all-atom additive force field for RNA. J. Comput. Chem 2011, 32, 1929–1943. [DOI] [PMC free article] [PubMed] [Google Scholar]
- (47).Case DA,; Betz R; Cerutti D; Cheatham T III,; Darden TA,; Duke R; Giese T; Gohlke H; Goetz A et al. Amber 2016; University of California, San Francisco: San Francisco, 2016. [Google Scholar]
- (48).Górska A; Jasiński M; Trylska J MINT: software to identify motifs and short-range interactions in trajectories of nucleic acids. Nucl. Acids Res 2015, 43, e114. [DOI] [PMC free article] [PubMed] [Google Scholar]
- (49).Humphrey W; Dalke A; Schulten K VMD - visual molecular dynamics. J. Molec. Graphics 1996, 14, 33–38. [DOI] [PubMed] [Google Scholar]
- (50).Hunter JD Matplotlib: A 2D graphics environment. Computing In Science & Engineering 2007, 9, 90–95. [Google Scholar]
- (51).Darty K; Denise A; Ponty Y VARNA: Interactive drawing and editing of the RNA secondary structure. Bioinformatics 2009, 25, 1974–1975. [DOI] [PMC free article] [PubMed] [Google Scholar]
- (52).Srinivasan J; Cheatham TE; Cieplak P; Kollman PA; Case DA Continuum solvent studies of the stability of DNA, RNA, and phosphoramidate–DNA helices. J. Am. Chem. Soc 1998, 120, 9401–9409. [Google Scholar]
- (53).Gohlke H; Case DA Converging free energy estimates: MM-PB(GB)SA studies on the protein-protein complex Ras-Raf. J. Comput. Chem 2004, 25, 238–250. [DOI] [PubMed] [Google Scholar]
- (54).Lee MS; Salsbury FR Jr.; Brooks CL III Novel generalized Born methods. J. Chem. Phys 2002, 116, 10606–10614. [Google Scholar]
- (55).Lee MS; Feig M; Salsbury FR Jr.; Brooks CL III New analytic approximation to the standard molecular volume definition and its application to generalized Born calculations. J. Comput. Chem 2003, 24, 1348–1356. [DOI] [PubMed] [Google Scholar]
- (56).Sitkoff D; Sharp KA; Honig B Accurate calculation of hydration free energies using macroscopic solvent models. J. Phys. Chem 1994, 98, 1978–1988. [Google Scholar]
- (57).Corradini R; Tedeschi T; Sforza S; Marchelli R In Comprehensive Chiroptical Spectroscopy, Volume 2: Applications in Stereochemical Analysis of Synthetic Compounds, Natural Products, and Biomolecules; Berova N, Polavarapu PL, Nakanishi K, Woody RW, Eds.; John Wiley & Sons, Inc., 2012; pp 587–614. [Google Scholar]
- (58).Hashizume H; Imahori K Circular dichroism and conformation of natural and synthetic polynucleotides. J. Biochem 1967, 61, 738–749. [DOI] [PubMed] [Google Scholar]
- (59).Gray DM; Liu J; Ratliff RL; Allen FS Sequence dependence of the circular dichroism of synthetic doubleâĂŘstranded RNAs. Biopolymers 1981, 20, 1337–1382. [Google Scholar]
- (60).Tan D; Piana S; Dirks RM; Shaw DE RNA force field with accuracy comparable to state-of-the-art protein force fields. Proc. Natl. Acad. Sci, USA 2018, 115, E1346–E1355. [DOI] [PMC free article] [PubMed] [Google Scholar]
- (61).Panecka J; Mura C; Trylska J Molecular dynamics of potential rRNA binders: Single-stranded nucleic acids and some analogues. J. Phys. Chem. B 2011, 115, 532–546. [DOI] [PubMed] [Google Scholar]
- (62).Pienko T; Wierzba AJ; Wojciechowska M; Gryko D; Trylska J Conformational dynamics of cyanocobalamin and its conjugates with peptide nucleic acids. J. Phys. Chem. B 2017, 121, 2968–2979. [DOI] [PubMed] [Google Scholar]


