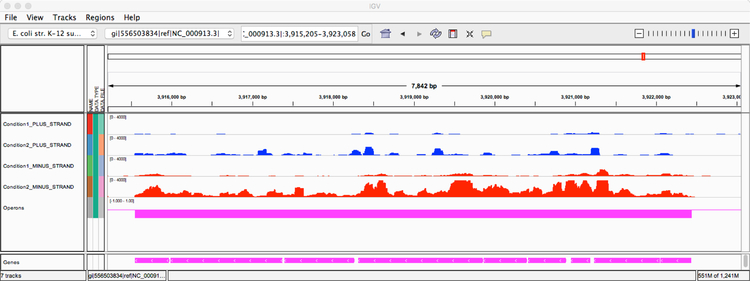
Figure 3.
The visualization created by Rockhopper using the IGV genome browser illustrates a 7,842 basepair region in the E. coli genome, including sequencing reads corresponding to this region from two experimental conditions. The first condition corresponds to minimal medium supplemented with 0.2% D-glucose (SRA SRR794972) and the second condition corresponds to LB medium exposed to 0.5% α-methylglucoside (SRA SRR794863). The region contains nine ATP synthase genes on the minus strand: atpI, atpB, atpE, atpF, atpH, atpA, atpG, atpD, atpC. There are six tracks (rows of information) displayed in the browser. The first track (in blue) indicates sequencing reads observed on the plus strand from the first experimental condition. The second track (in blue) indicates sequencing reads observed on the plus strand from the second experimental condition. The third track (in red) indicates sequencing reads observed on the minus strand from the first experimental condition. The fourth track (in red) indicates sequencing reads observed on the minus strand from the second experimental condition. The fifth track (in magenta) represents an operon prediction from Rockhopper. The sixth track (in magenta) at the very bottom indicates the locations of nine annotated genes on the minus strand in the E. coli genome.

