Abstract
Background
The inflammatory reaction, which plays a key role in tumor microenvironment, is associated with the tumor development, progression and metastasis. We aim to estimate the potential prognostic value of systemic immune-inflammation index (SII) in patients after radical operation for carcinoma of stomach in gastric cancer.
Methods
One hundred and eighty-two patients with gastric cancer who underwent radical operation for carcinoma of stomach from January 2009 to December 2012 were enrolled and divided into a low SII group (<600×109 cells/L) and a high SII group (SII ≥600×109 cells/L) based on the optimal cutoff value of SII. The clinicopathological features were analyzed and compared between the two groups of patients. We analyzed the disease-free survival (DFS) and the overall survival (OS) by Kaplan Meier survival curve and log-rank test. The prognostic factors were used to evaluate by univariate analysis, and the independent prognostic factors were assessed by using multivariate Cox proportional hazards regression model.
Results
The median DFS and OS of all patients were 18.67 and 22.83 months, respectively. According to the univariate and multivariate analysis, the optimal cutoff value of SII had prognostic significance on DFS and OS. The median DFS and OS in low SII group were longer than those in high SII group (21.43 vs. 17.57 months, 28.03 vs. 18.30 months, respectively). The radical resection, type of surgery, metastatic lymph nodes ratio (MLNR), lymphocyte, SII, carcinoembryonic antigen (CEA) and Borrmann classification were the independent prognostic factors in gastric carcinoma. At the same time, the patients with MLNR in low SII group had longer DFS and OS than those with MLNR in high SII group, especially in patients with high MLNR.
Conclusions
SII may serve as a convenient, low-cost and noninvasive prognostic marker for patients after radical operation for carcinoma of stomach in gastric cancer.
Keywords: Systemic immune-inflammation index (SII), radical operation for carcinoma of stomach, metastatic lymph nodes ratio (MLNR), gastric cancer, prognostic marker
Introduction
Gastric cancer is one of the common malignant tumor of digestive system, and is leading high incidence and morbidity on the global scale (1). Recently, great progress has been made in the diagnose and treatment of gastric carcinoma, however, the outcome of gastric cancer after operation is still extremely poor, and the number of patients with gastric cancer is still rising around the world (2). The World Health Organization (WHO) indicates that 952,000 people have been diagnosed with gastric cancer in the whole world, an estimated 405,000 new diagnoses due to gastric cancer in China, and the five-year survival rate is still in a low ratio of 10–30% (3,4). Moreover, there is a high incidence in China, with 29.9 new diagnosed cases per 100,000 people (5). The tumor-node-metastasis (TNM) stage system can predict outcomes, however, it is difficult to evaluate the same TNM stage because of patients with different survival outcomes. Therefore, to provide better treatment of patients with gastric cancer, and search for accurate prognostic indicators are of importance for decision-making.
The inflammatory reaction, which plays a central role in tumor microenvironment, is closely related to the tumor development, progression and metastasis. The inflammatory cells, for example, neutrophil, lymphocyte, monocyte and platelet, are very critical in tumor-induced systemic inflammatory response (6,7). The systemic inflammatory response may play key roles in tumor growth, progression, invasion and metastasis (8). Some biomarkers, such as, neutrophil to lymphocyte ratio (NLR), lymphocyte to monocyte ratio (LMR), platelet to lymphocyte ratio (PLR) and systemic inflammation response index (SIRI) are used to assess the prognosis of many malignant tumors (9,10). Some studies have proved that the essential features of tumor cells and tumor microenvironment influenced the ability of invasion and metastasis in tumors (11).
Systemic immune-inflammation index (SII) is calculated by (N×P)/L (N, P and L represent neutrophil counts, platelet counts and lymphocyte counts, respectively), and is associated with some malignant tumors, such as metastatic renal cell cancer and metastatic castration resistant prostate cancer (mCRPC) (12,13). In the treatment of metastatic renal cell cancer, patients with low SII had better clinical effect (12). SII might be regarded as an early and easy prognostic marker in mCRPC patients treated with abiraterone, and low SII had better clinical outcome of mCRPC patients (13). Compared with the biomarkers of NLR, LMR and PLR, the SII may comprehensively reflect the balance between the host immune and the inflammatory condition. In this research, we aim to estimate the potential prognostic value of SII in patients after radical operation for carcinoma of stomach in gastric cancer.
Methods
Patients
The retrospective study included 182 patients with pathology-proven stage III gastric cancer who were diagnosed and underwent radical operation for carcinoma of stomach in our hospital from January 2009 to December 2012. The pathological evidence of all enrolled patients was confirmed with by electronic gastroscopy and postoperative pathology. The pathological TNM stage was evaluated by the eighth edition of Union for International Cancer Control (UICC) and American Joint Committee on Cancer (AJCC) (14). This study was approved by Heilongjiang Provincial Hospital Ethics Committee, and written informed consent was signed by all enrolled patients. The inclusion criteria were as follows: (I) all patients with radical operation for carcinoma of stomach, and confirmed with pathological evidence; (II) survival time ≥3 months; (III) Eastern Cooperative Oncology Group (ECOG) performance status between 0 and 2, and Karnofsky performance status (KPS) ≥80; (IV) complete medical records and follow-up information. The Exclusion criteria were as follows: (I) received antitumor therapies, such as chemoradiotherapy, targeted therapy, and any other therapies; (II) with liver, lung and other organ metastasis; (III) treatment with blood transfusion before blood tests within one month; (IV) with immunologically mediated disease or autoimmune disease.
Peripheral venous blood parameters
The blood samples were taken before treatment and collected into the ethylenediaminetetraacetic acid (EDTA) tube, and then sent to the clinical laboratory for analysis of standard clinical tests within two hours. Hematological parameters were analyzed by Sysmex XE-5000 automated hematology analyzer (Sysmex, Kobe, Japan).
Follow up
Every patient was followed up in inpatient and outpatient until December 30, 2017. All patients were followed up every three months from the first to second year after operation; and every six months from the third to fifth year after surgery; then every year until death. The patients were regularly examined and evaluated, and the assessments included laboratory tests, computed tomography (CT) and gastroscopy, and so forth. Disease free survival (DFS) was defined as the time from operation date to recurrence date (local recurrence and/or distant metastases), and any other cause of death or last follow-up (month). Overall survival (OS) was defined as the time from operation date to death time, or last follow-up (month).
Statistical analysis
Receiver operating characteristic curve (ROC) analysis was used to determine the optimal cutoff value of SII. The ratio closest to the sum value of maximum sensitivity and specificity was regarded as the optimal cutoff value. The optimal cutoff value of SII was 600×109 cells/L by the method. The Chi-square test and Fisher exact test were used to analyze the relationship between SII and clinicopathological features. The DFS and the OS were assessed by the Kaplan Meier survival curve and log-rank test. The prognostic factors were assessed by univariate analysis, and the independent prognostic factors were evaluated by multivariate Cox proportional hazards regression model. All of the statistical analysis were performed by SPSS software (version 19.0, SPSS Inc., Chicago, IL, USA) and Graphpad prism 5.0. P value less than 0.05 was considered to have statistical significance.
Results
The relationship between clinicopathological features and SII
A total of 182 patients after radical operation for carcinoma of stomach in stage III gastric cancer were enrolled in the present study. 600×109/L was the optimal cutoff value of SII by ROC analysis. Patients were divided into two groups: a low SII group (<600×109 cells/L) and a high SII group (≥600×109 cells/L). The average age was 55.7±9.5 years, and ranged from 32 to 80 years. A total of 133 cases were males, and 49 cases were females, respectively. The low SII group had 113 patients (62.1%), and the high SII group had 69 patients (37.9%), respectively. The results showed that SII was significantly associated with primary tumor site (χ2=6.111, P value =0.047) (Table 1).
Table 1. Clinicopathological features of 182 patients after radical operation for carcinoma of stomach in gastric cancer.
| Parameters | Number (%) | Low-SII <600×109 cells/L (%) | High-SII ≥600×109 cells/L (%) | χ2 | P value |
|---|---|---|---|---|---|
| Cases (n) | 113 | 69 | |||
| Age (years) | 0.196 | 0.657 | |||
| <60 | 115 (63.2) | 70 (61.9) | 45 (65.2) | ||
| ≥60 | 67 (36.8) | 43 (38.1) | 24 (34.8) | ||
| Gender | 0.697 | 0.404 | |||
| Male | 133 (73.1) | 85 (75.2) | 48 (69.6) | ||
| Female | 49 (26.9) | 28 (24.8) | 21 (30.4) | ||
| Postoperative chemotherapy | 0.472 | 0.492 | |||
| Yes | 137 (75.3) | 87 (77.0) | 50 (72.5) | ||
| No | 45 (24.7) | 26 (23.0) | 19 (27.5) | ||
| Radical resection | 2.288 | 0.319 | |||
| R0 | 136 (74.7) | 87 (77.0) | 49 (71.0) | ||
| R1 | 23 (12.6) | 11 (9.7) | 12 (17.4) | ||
| R2 | 23 (12.6) | 15 (13.3) | 8 (11.6) | ||
| Type of surgery | 3.119 | 0.210* | |||
| Distal gastrectomy | 107 (58.8) | 70 (61.9) | 37 (53.6) | ||
| Proximal gastrectomy | 12 (6.6) | 9 (8.0) | 3 (4.3) | ||
| Total gastrectomy | 63 (34.6) | 34 (30.1) | 29 (42.0) | ||
| Differentiation | 0.116 | 0.944* | |||
| Poorly differentiated | 111 (61.0) | 70 (61.9) | 41 (59.4) | ||
| Moderately differentiated | 66 (36.3) | 40 (35.4) | 26 (37.7) | ||
| Well differentiated | 5 (2.7) | 3 (2.7) | 2 (2.9) | ||
| Primary tumor site | 6.111 | 0.047 | |||
| Upper 1/3 | 16 (8.8) | 11 (9.7) | 5 (7.2) | ||
| Middle 1/3 | 74 (40.7) | 38 (33.6) | 36 (52.2) | ||
| Low 1/3 | 92 (50.5) | 64 (56.6) | 28 (40.6) | ||
| Pathology | 3.739 | 0.442* | |||
| Adenocarcinoma | 122 (67.0) | 78 (69.0) | 44 (63.8) | ||
| Mucinous carcinoma | 19 (10.4) | 8 (7.1) | 11 (15.9) | ||
| Signet ring cell carcinoma | 28 (15.4) | 18 (15.9) | 10 (14.5) | ||
| Mixed carcinoma | 13 (7.1) | 9 (8.0) | 4 (5.8) | ||
| TNM stage | 6.053 | 0.442 | |||
| IIIA | 73 (40.1) | 50 (44.2) | 23 (33.3) | ||
| IIIB | 75 (41.2) | 48 (42.5) | 27 (39.1) | ||
| IIIC | 34 (18.7) | 15 (13.3) | 19 (27.5) | ||
| Total lymph nodes | 3.080 | 0.079 | |||
| <23 | 89 (48.9) | 61 (54.0) | 28 (40.6) | ||
| ≥23 | 93 (51.1) | 52 (46.0) | 41 (59.4) | ||
| Positive lymph nodes | 1.217 | 0.270 | |||
| <7 | 86 (47.3) | 57 (50.4) | 29 (42.0) | ||
| ≥7 | 96 (52.7) | 56 (49.6) | 40 (58.0) | ||
| MLNR | 1.283 | 0.257 | |||
| <0.33 | 34 (18.7) | 24 (21.2) | 10 (14.5) | ||
| ≥0.33 | 148 (81.3) | 89 (78.8) | 59 (85.5) | ||
| CEA (ng/mL) | 0.023 | 0.879 | |||
| <2.46 | 91 (50.0) | 57 (50.4) | 34 (49.3) | ||
| ≥2.46 | 91 (50.0) | 56 (49.6) | 35 (50.7) | ||
| CA199 (U/mL) | 2.824 | 0.092 | |||
| <12.33 | 91 (50.0) | 62 (54.9) | 29 (42.0) | ||
| ≥12.33 | 91 (50.0) | 51 (45.1) | 40 (58.0) | ||
| Lauren classification | 0.326 | 0.849 | |||
| Intestinal | 118 (64.8) | 75 (66.4) | 43 (62.3) | ||
| Diffuse | 24 (13.2) | 14 (12.4) | 10 (14.5) | ||
| Mixed | 40 (22.0) | 24 (21.2) | 16 (23.2) | ||
| Borrmann classification | 2.510 | 0.643* | |||
| Borrmann I | 4 (2.2) | 4 (3.5) | 0 (0.0) | ||
| Borrmann II | 26 (14.3) | 16 (14.2) | 10 (14.5) | ||
| Borrmann III | 123 (67.6) | 75 (66.4) | 48 (69.6) | ||
| Borrmann IV | 29 (15.9) | 18 (15.9) | 11 (15.9) | ||
| Tumor size (mm) | 1.711 | 0.191 | |||
| <50 | 58 (31.9) | 40 (35.4) | 18 (26.1) | ||
| ≥50 | 124 (68.1) | 73 (64.6) | 51 (73.9) |
*, Fisher exact test.
The relationship between blood parameters and SII
The median white blood cell (W), hemoglobin (Hb), N, monocyte (M), P, L counts were 5.80×10⁹, 130×109, 3.38×10⁹, 0.44×10⁹, 222×109 and 1.80×10⁹ cells/L, respectively. We used the same way like SII to determine the optimal cutoff values of NLR, MLR and PLR. The optimal cutoff value of NLR was 2.20, the optimal cutoff value of MLR was 0.28 and the optimal cutoff value of PLR was 138, respectively. We found that SII was significantly associated with W, Hb, N, M, P, L and NLR, MLR, PLR (Table 2).
Table 2. The relationship between blood parameters and systemic immune-inflammation index (SII).
| Parameters | Number (%) | Low-SII <600×109 cells/L (%) | High-SII ≥600×109 cells/L (%) | χ2 | P value |
|---|---|---|---|---|---|
| Cases (n) | 113 | 69 | |||
| White blood cell (W, ×109 cells/L) | 7.768 | 0.005 | |||
| <5.80 | 90 (49.5) | 65 (57.5) | 25 (36.2) | ||
| ≥5.80 | 92 (50.5) | 48 (42.5) | 44 (63.8) | ||
| Hemoglobin (Hb, ×109 cells/L) | 11.052 | 0.001 | |||
| <130 | 90 (49.5) | 45 (39.8) | 45 (65.2) | ||
| ≥130 | 92 (50.5) | 68 (60.2) | 24 (34.8) | ||
| Neutrophils (N, ×109 cells/L) | 14.589 | <0.001 | |||
| <3.38 | 91 (50.0) | 69 (61.1) | 22 (31.9) | ||
| ≥3.38 | 91 (50.0) | 44 (38.9) | 47 (68.1) | ||
| Monocyte (M, ×109 cells/L) | 5.599 | 0.018 | |||
| <0.44 | 89 (48.9) | 63 (55.8) | 26 (37.7) | ||
| ≥0.44 | 93 (51.1) | 50 (44.2) | 43 (62.3) | ||
| Platelet (P, ×109 cells/L) | 10.294 | 0.001 | |||
| <222 | 91 (50.0) | 67 (59.3) | 24 (34.8) | ||
| ≥222 | 91 (50.0) | 46 (40.7) | 45 (65.2) | ||
| Lymphocyte (L, ×109 cells/L) | 3.850 | 0.049 | |||
| <1.80 | 86 (47.3) | 47 (41.6) | 39 (56.5) | ||
| ≥1.80 | 96 (52.7) | 66 (58.4) | 30 (43.5) | ||
| NLR | 21.586 | <0.001 | |||
| <2.20 | 91 (50.0) | 79 (69.9) | 12 (17.4) | ||
| ≥2.20 | 91 (50.0) | 34 (30.1) | 57 (82.6) | ||
| MLR | 9.324 | 0.002 | |||
| <0.28 | 87 (47.8) | 64 (56.6) | 23 (33.3) | ||
| ≥0.28 | 95 (52.2) | 49 (43.4) | 46 (66.7) | ||
| PLR | 58.929 | <0.001 | |||
| <138 | 90 (49.5) | 81 (71.7) | 9 (13.0) | ||
| ≥138 | 92 (50.5) | 32 (28.3) | 60 (87.0) |
Univariate and multivariate proportional hazards regression survival analysis
The median DFS of all enrolled patients was 18.67 months, and the median OS of all enrolled patients was 22.83 months (Figures 1 and 2). In univariate analysis, high DFS factors were radical resection, type of surgery, pathology, metastasis lymph node rate (MLNR), lymphocyte, SII, carcinoembryonic antigen (CEA) and Borrmann classification. In multivariate Cox proportional hazards regression analysis, high DFS factors were radical resection, type of surgery, pathology, MLNR, lymphocyte, SII, CEA and Borrmann classification (Table 3). In univariate analysis, high OS factors were radical resection, type of surgery, MLNR, lymphocyte, SII, CEA and Borrmann classification. In multivariate Cox proportional hazards regression analysis, high OS factors were radical resection, type of surgery, MLNR, lymphocyte, SII, CEA and Borrmann classification (Table 4).
Figure 1.
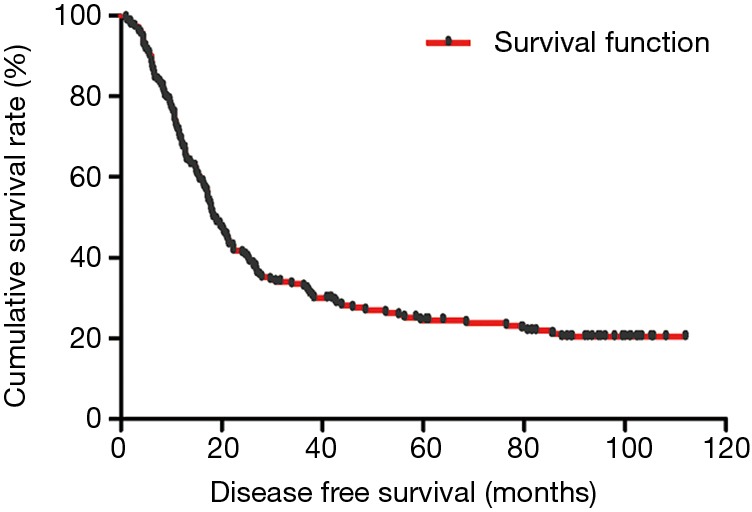
Kaplan-Meier analysis of DFS of all patients after radical operation for carcinoma of stomach in gastric cancer. DFS, disease-free survival.
Figure 2.
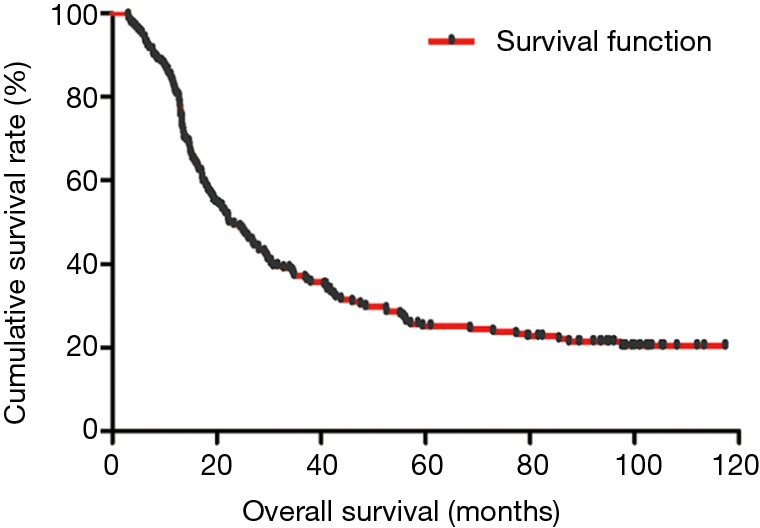
Kaplan-Meier analysis of OS of all patients after radical operation for carcinoma of stomach in gastric cancer. OS, overall survival.
Table 3. Univariate and multivariate Cox proportional hazards regression model survival analysis of SII for DFS.
| Parameters | Univariate analysis | Multivariate analysis | |||
|---|---|---|---|---|---|
| Hazard ratio (95% CI) | P value | Hazard ratio (95% CI) | P value | ||
| Age (years) | 0.521 | ||||
| <60 | 1 (reference) | ||||
| ≥60 | 1.140 (0.764–1.699) | ||||
| Gender | 0.933 | ||||
| Male | 1 (reference) | ||||
| Female | 1.020 (0.640–1.627) | ||||
| Postoperative chemotherapy | 0.942 | ||||
| Yes | 1 (reference) | ||||
| No | 0.984 (0.631–1.534) | ||||
| Radical resection | <0.001 | <0.001 | |||
| R0 | 1 (reference) | 1 (reference) | |||
| R1 | 0.934 (0.528–1.654) | 0.960 (0.563–1.637) | |||
| R2 | 7.171 (3.970–12.955) | 6.163 (3.580–10.609) | |||
| Type of surgery | 0.003 | 0.008 | |||
| Distal gastrectomy | 1 (reference) | 1 (reference) | |||
| Proximal gastrectomy | 1.718 (0.551–5.359) | 0.874 (0.402–1.902) | |||
| Total gastrectomy | 2.951 (1.581–5.508) | 1.818 (1.231–2.685) | |||
| Differentiation | 0.698 | ||||
| Poorly differentiated | 1 (reference) | ||||
| Moderately differentiated | 1.144 (0.728–1.799) | ||||
| Well differentiated | 0.745 (0.215–2.581) | ||||
| Primary tumor site | 0.231 | ||||
| Upper 1/3 | 1 (reference) | ||||
| Middle 1/3 | 1.402 (0.588–3.344) | ||||
| Low 1/3 | 2.180 (0.795–5.981) | ||||
| Pathology | 0.022 | 0.016 | |||
| Adenocarcinoma | 1 (reference) | 1 (reference) | |||
| Mucinous carcinoma | 3.007 (1.142–7.916) | 2.052 (1.216–3.464) | |||
| Signet ring cell carcinoma | 3.863 (1.267–11.777) | 1.665 (1.002–2.767) | |||
| Mixed carcinoma | 2.086 (0.652–6.677) | 0.962 (0.490–1.888) | |||
| MLNR | 0.011 | 0.022 | |||
| <0.33 | 1 (reference) | 1 (reference) | |||
| ≥0.33 | 1.589 (1.019–2.479) | 1.825 (1.231–3.027) | |||
| White blood cell (W, ×109 cells/L) | 0.749 | ||||
| <5.80 | 1 (reference) | ||||
| ≥5.80 | 0.889 (0.433–1.827) | ||||
| Hemoglobin (Hb, ×109 cells/L) | 0.963 | ||||
| <126 | 1 (reference) | ||||
| ≥126 | 0.990 (0.658–1.490) | ||||
| Neutrophils (N, ×109 cells/L) | 0.73 | ||||
| <3.38 | 1 (reference) | ||||
| ≥3.38 | 1.123 (0.580–2.176) | ||||
| Monocyte (M, ×109 cells/L) | 0.999 | ||||
| <0.44 | 1 (reference) | ||||
| ≥0.44 | 1.000 (0.650–1.540) | ||||
| Platelet (P, ×109 cells/L) | 0.905 | ||||
| <222 | 1 (reference) | ||||
| ≥222 | 1.029 (0.647–1.637) | ||||
| Lymphocyte (L, ×109 cells/L) | 0.009 | 0.005 | |||
| <1.80 | 1 (reference) | 1 (reference) | |||
| ≥1.80 | 1.781 (1.158–2.741) | 1.662 (1.161–2.378) | |||
| SII (×109 cells/L) | 0.025 | 0.012 | |||
| <600 | 1 (reference) | 1 (reference) | |||
| ≥600 | 1.726 (1.072–2.777) | 1.592 (1.108–2.286) | |||
| CEA (ng/mL) | 0.044 | 0.005 | |||
| <2.46 | 1 (reference) | 1 (reference) | |||
| ≥2.46 | 1.528 (1.012–2.310) | 1.655 (1.162–2.358) | |||
| CA199 (U/mL) | 0.648 | ||||
| <12.33 | 1 (reference) | ||||
| ≥12.33 | 1.106 (0.717–1.706) | ||||
| Lauren classification | 0.285 | ||||
| Intestinal | 1 (reference) | ||||
| Diffuse | 0.683 (0.258–1.807) | ||||
| Mixed | 0.432 (0.146–1.277) | ||||
| Borrmann classification | 0.004 | 0.008 | |||
| Borrmann I | 1 (reference) | 1 (reference) | |||
| Borrmann II | 0.471 (0.118–1.876) | 0.347 (0.092–1.310) | |||
| Borrmann III | 1.474 (0.399–5.447) | 0.912 (0.266–3.134) | |||
| Borrmann IV | 1.231 (0.294–5.155) | 0.721 (0.188–2.773) | |||
| Tumor size (mm) | 0.324 | ||||
| <50 | 1 (reference) | ||||
| ≥50 | 0.802 (0.518–1.243) | ||||
SII, systemic immune-inflammation index; DFS, disease-free survival.
Table 4. Univariate and multivariate Cox proportional hazards regression model survival analysis of SII for OS.
| Parameters | Univariate analysis | Multivariate analysis | |||
|---|---|---|---|---|---|
| Hazard ratio (95% CI) | P value | Hazard ratio (95% CI) | P value | ||
| Age (years) | 0.399 | ||||
| <60 | 1 (reference) | ||||
| ≥60 | 1.184 (0.800–1.752) | ||||
| Gender | 0.881 | ||||
| Male | 1 (reference) | ||||
| Female | 1.036 (0.652–1.648) | ||||
| Postoperative chemotherapy | 0.190 | ||||
| Yes | 1 (reference) | ||||
| No | 1.343 (0.864–2.089) | ||||
| Radical resection | <0.001 | <0.001 | |||
| R0 | 1 (reference) | 1 (reference) | |||
| R1 | 1.030 (0.586–1.810) | 1.141 (0.683–1.907) | |||
| R2 | 7.825 (4.291–14.272) | 6.501 (3.760–11.239) | |||
| Type of surgery | 0.024 | 0.012 | |||
| Distal gastrectomy | 1 (reference) | 1 (reference) | |||
| Proximal gastrectomy | 1.067 (0.342–3.332) | 1.358 (0.949–4.872) | |||
| Total gastrectomy | 2.221 (1.207–4.085) | 2.546 (1.045–5.328) | |||
| Differentiation | 0.778 | ||||
| Poorly differentiated | 1 (reference) | ||||
| Moderately differentiated | 1.134 (0.722–1.781) | ||||
| Well differentiated | 0.816 (0.237–2.813) | ||||
| Primary tumor site | 0.433 | ||||
| Upper 1/3 | 1 (reference) | ||||
| Middle 1/3 | 1.282 (0.541–3.038) | ||||
| Low 1/3 | 1.777 (0.660–4.782) | ||||
| Pathology | 0.136 | ||||
| Adenocarcinoma | 1 (reference) | ||||
| Mucinous carcinoma | 2.528 (0.915–6.986) | ||||
| Signet ring cell carcinoma | 3.364 (1.063–10.647) | ||||
| Mixed carcinoma | 2.025 (0.879–5.542) | ||||
| MLNR | 0.017 | 0.026 | |||
| <0.33 | 1 (reference) | 1 (reference) | |||
| ≥0.33 | 1.426 (0.912–2.232) | 2.015 (1.037–4.089) | |||
| White blood cell (W, ×109 cells/L) | 0.384 | ||||
| <5.80 | 1 (reference) | ||||
| ≥5.80 | 0.717 (0.339–1.517) | ||||
| Hemoglobin (Hb, ×109 cells/L) | 0.684 | ||||
| <126 | 1 (reference) | ||||
| ≥126 | 0.918 (0.610–1.384) | ||||
| Neutrophils (N, ×109 cells/L) | 0.522 | ||||
| <3.38 | 1 (reference) | ||||
| ≥3.38 | 1.253 (0.628–2.498) | ||||
| Monocyte (M, ×109 cells/L) | 0.925 | ||||
| <0.44 | 1 (reference) | ||||
| ≥0.44 | 0.979 (0.634–1.513) | ||||
| Platelet (P, ×109 cells/L) | 0.591 | ||||
| <222 | 1 (reference) | ||||
| ≥222 | 0.882 (0.558–1.394) | ||||
| Lymphocyte (L, ×109 cells/L) | 0.006 | 0.007 | |||
| <1.80 | 1 (reference) | 1 (reference) | |||
| ≥1.80 | 1.828 (1.189–2.809) | 1.613 (1.137–2.288) | |||
| SII (×109 cells/L) | 0.010 | 0.001 | |||
| <600 | 1 (reference) | 1 (reference) | |||
| ≥600 | 1.908 (1.170–3.112) | 1.881 (1.315–2.692) | |||
| CEA (ng/mL) | 0.028 | 0.011 | |||
| <2.46 | 1 (reference) | 1 (reference) | |||
| ≥2.46 | 1.460 (0.972–2.191) | 1.556 (1.106–2.190) | |||
| CA199 (U/mL) | 0.426 | ||||
| <12.33 | 1 (reference) | ||||
| ≥12.33 | 1.196 (0.770–1.858) | ||||
| Lauren classification | 0.500 | ||||
| Intestinal | 1 (reference) | ||||
| Diffuse | 0.738 (0.267–2.037) | ||||
| Mixed | 0.521 (0.169–1.612) | ||||
| Borrmann classification | 0.006 | 0.007 | |||
| Borrmann I | 1 (reference) | 1 (reference) | |||
| Borrmann II | 0.335 (0.083–1.349) | 0.431 (0.122–1.518) | |||
| Borrmann III | 1.005 (0.270–3.736) | 1.148 (0.358–3.677) | |||
| Borrmann IV | 0.851 (0.202–3.581) | 1.020 (0.291–3.571) | |||
| Tumor size (mm) | 0.416 | ||||
| <50 | 1 (reference) | ||||
| ≥50 | 0.832 (0.533–1.298) | ||||
SII, systemic immune-inflammation index; OS, overall survival.
In the present study, our results proved that SII had a prognostic significance by optimum cutoff value of 600×109 cells/L in DFS and OS. In univariate analysis, the patients with low SII would survive longer on DFS and OS than those with high SII (P=0.025, HR: 1.726, 95% CI: 1.072–2.777 and P=0.010, HR: 1.908, 95% CI: 1.170–3.112, respectively). In multivariate Cox proportional hazards regression analysis, patients with low SII would survive longer on DFS and OS than those with high SII (P=0.012, HR: 1.592, 95% CI: 1.108–2.286 and P=0.001, HR: 1.881, 95% CI: 1.315–2.692, respectively) (Tables 3 and 4). The median DFS and OS of patients with low SII were 21.43 and 28.03 months, respectively. The median DFS and OS of patients with high SII were 17.57 and 18.30 months, respectively. We found that the median DFS and OS of patients with low SII were longer than those with high SII (χ2=5.583, P=0.018 and χ2=6.126, P=0.013, respectively) (Figures 3 and 4).
Figure 3.
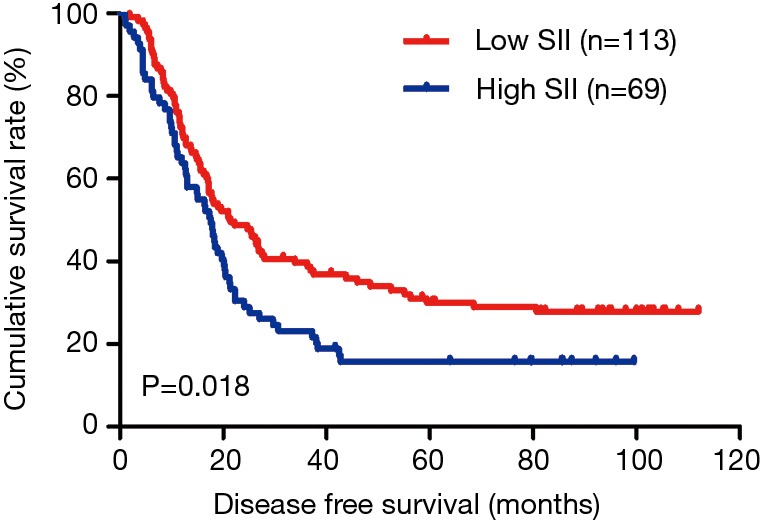
Kaplan-Meier analysis of DFS for the SII of patients after radical operation for carcinoma of stomach in gastric cancer. DFS, disease-free survival; SII, systemic immune-inflammation index.
Figure 4.
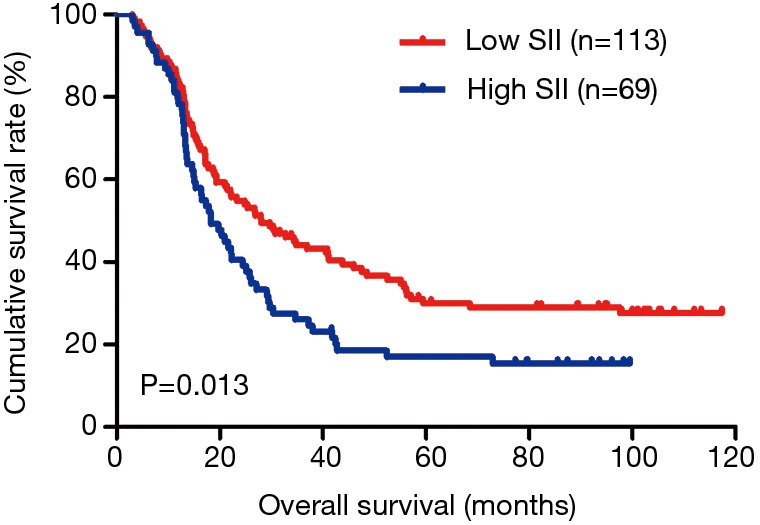
Kaplan-Meier analysis of OS for the SII of patients after radical operation for carcinoma of stomach in gastric cancer. OS, overall survival; SII, systemic immune-inflammation index.
Association of MLNR and SII
The MLNR was calculated by (number of metastatic nodes/total number of lymph nodes), and was a more reliable and accurate means of stratifying risk than existing staging systems (15). The results indicated that MLNR was the significant prognostic factor for DFS and OS by univariate and multivariate analysis (Tables 3 and 4). To further study the prognostic efficiency of SII, and the SII was used to evaluate by the MNLR. We used the same way like SII to determine the optimal cutoff value of MLNR, and the optimum cutoff value was 0.33. We stratified the patients into two groups by MLNR: a low MLNR group (<0.33) and a high MLNR group (≥0.33). In the low MLNR group, the median DFS and OS of patients with low SII were 54.41 and 56.89 months, respectively; the median DFS and OS of patients with high SII were 40.20 and 49.27 months, respectively. The results indicated that patients with low SII would survive longer on DFS and OS than those with high SII in the low MLNR group (χ2=0.314, P=0.575 and χ2=0.394, P=0.530, respectively) (Figures 5 and 6). In the high MLNR group, the median DFS and OS of patients with low SII were 19.63 and 26.80 months, respectively; and the median DFS and OS of patients with high SII were 16.50 and 17.90 months, respectively. The results demonstrated that patients with low SII would survive longer on DFS and OS than those with high SII in the high MLNR group (χ2=5.221, P=0.022 and χ2=5.621, P=0.018, respectively) (Figures 7 and 8).
Figure 5.
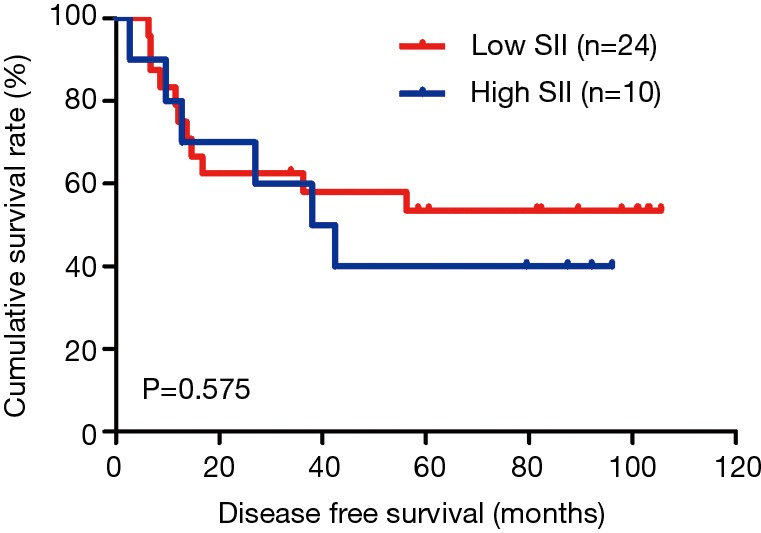
Kaplan-Meier analysis of DFS for the SII of patients after radical operation for carcinoma of stomach in gastric cancer in low MLNR group. DFS, disease-free survival; SII, systemic immune-inflammation index; MLNR, metastatic lymph nodes ratio.
Figure 6.
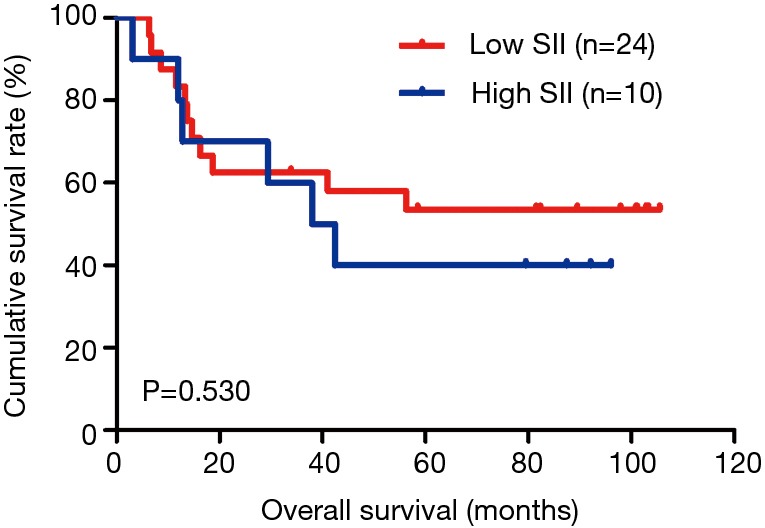
Kaplan-Meier analysis of OS for the SII of patients after radical operation for carcinoma of stomach in gastric cancer in low MLNR group. OS, overall survival; SII, systemic immune-inflammation index; MLNR, metastatic lymph nodes ratio.
Figure 7.
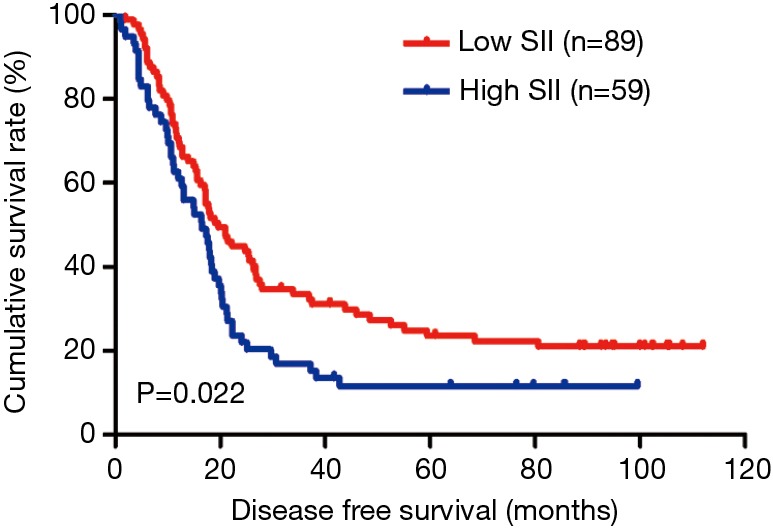
Kaplan-Meier analysis of DFS for the SII of patients after radical operation for carcinoma of stomach in gastric cancer in high MLNR group. DFS, disease-free survival; SII, systemic immune-inflammation index; MLNR, metastatic lymph nodes ratio.
Figure 8.
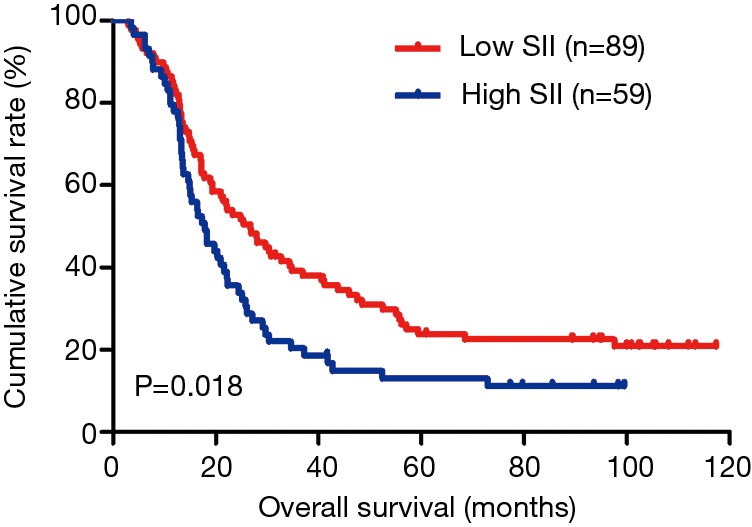
Kaplan-Meier analysis of OS for the SII of patients after radical operation for carcinoma of stomach in gastric cancer in high MLNR group. OS, overall survival; SII, systemic immune-inflammation index; MLNR, metastatic lymph nodes ratio.
Discussion
Gastric cancer is one of the common malignant tumor in alimentary tract system all over the world, and this disease results in hundreds of thousands of deaths annually; and gastric carcinoma is also one of the common gastrointestinal cancer in Asia, especially in China, Japan and Korea (16). In recent years, the mortality and morbidity rates of gastric carcinoma declined, however, this disease still has a bad prognosis because of easy recurrence and metastasis across the world (17). Some identified immunological and histological biomarkers have been used to evaluate the prognosis of gastric cancer, but these biomarkers usually rely on the primary tumor samples and waste time and energy (18). Thus, the accurate prognostic markers in gastric carcinoma should be studied.
The inflammatory reaction is associated with tumors, and influences the development, progression and metastasis of malignant tumor (19). Systemic inflammatory response may accelerate the development of tumor and distant metastasis via a variety of mechanisms. According to secreting cytokines and chemokines, the neutrophils inhibit acute and chronic inflammation, and promote tumor growth, development and metastasis (20). The platelets release adenine nucleotides to promote circulating tumor cells’ epithelial mesenchymal transition (EMT) (21). The lymphocytes play a vital role in controlling tumor growth and development via secreting cytokines and mediating effective cellular immunity (22).
All the patients enrolled in this study have not received the adjuvant chemotherapy. In this study, the results indicated that the SII could be used for prognosis in patients with gastric cancer, and the SII was a convenient, low-cost and noninvasive prognostic marker. The results also indicated that the patients with low SII had a better prognosis. Therefore, SII is a potential indicator for tumor recurrence and metastasis, and may provide early and suitable decision-making for clinical doctors to choose the better therapy for individuals.
In this research, we analyzed the clinicopathological features of 182 patients. The results showed that SII was significantly relevant to primary tumor site. Meanwhile, we analyzed the blood parameters and the results indicated that SII was significantly relevant to these blood parameters, such as white blood cell, hemoglobin, neutrophils, monocyte, platelet, lymphocyte counts, and NLR, MLR, PLR. We also found that SII had a prognostic significance by optimum cutoff value of 600×109 cells/L in DFS and OS, and the median DFS and OS time of patients with low SII would survive longer than those with high SII. Apart from these analyses, we also observed the association between SII and MLNR, and the results shown that patients with low SII would survive longer than those with high SII in low MLNR group and high MLNR group.
In summary, our results in the present research indicated that patients with low SII would survive longer and have a better clinical outcome. In China, the high gastric carcinoma morbidity and unbalanced medical condition should be fully considered and we should take full advantage of the convenient, low-cost and noninvasive prognostic marker to diagnose and prevention gastric cancer. Comprehensive understanding of hematological parameters may be beneficial to find new ways to treat gastric carcinoma.
Conclusions
In conclusion, SII may serve as a convenient, low-cost and noninvasive prognostic marker for patients after radical operation for carcinoma of stomach in stage III gastric cancer. However, further investigations and studies should evaluate the changes of SII in multicenter research and larger groups in gastric carcinoma.
Acknowledgments
None.
Ethical Statement: The study was approved by Heilongjiang Provincial Hospital Ethics Committee and written informed consent was obtained from all patients.
Footnotes
Conflicts of Interest: The authors have no conflicts of interest to declare.
References
- 1.Venerito M, Link A, Rokkas T, et al. Gastric cancer-clinical and epidemiological aspects. Helicobacter 2016;21:39-44. 10.1111/hel.12339 [DOI] [PubMed] [Google Scholar]
- 2.Siegel RL, Miller KD, Jemal A. Cancer Statistics, 2015. CA Cancer J Clin 2015;65:5-29. 10.3322/caac.21254 [DOI] [PubMed] [Google Scholar]
- 3.Torre LA, Bray F, Siegel RL, et al. Global cancer statistics, 2012. CA Cancer J Clin 2015;65:87-108. 10.3322/caac.21262 [DOI] [PubMed] [Google Scholar]
- 4.Mackenzie M, Spithoff K, Jonker D. Systemic therapy for advanced gastric cancer: a clinical practice guideline. Curr Oncol 2011;18:e202-9. 10.3747/co.v18i4.737 [DOI] [PMC free article] [PubMed] [Google Scholar]
- 5.Strong VE, Wu AW, Selby LV, et al. Differences in gastric cancer survival between the U.S. and China. J Surg Oncol 2015;112:31-7. 10.1002/jso.23940 [DOI] [PMC free article] [PubMed] [Google Scholar]
- 6.Schreiber RD, Old LJ, Smyth MJ. Cancer immunoediting: integrating immunity’s roles in cancer suppression and promotion. Science 2011;331:1565-70. 10.1126/science.1203486 [DOI] [PubMed] [Google Scholar]
- 7.McMillan DC. Systemic inflammation, nutritional status and survival in patients with cancer. Curr Opin Clin Nutr Metab Care 2009;12:223-6. 10.1097/MCO.0b013e32832a7902 [DOI] [PubMed] [Google Scholar]
- 8.Proctor MJ, McMillan DC, Morrison DS, et al. A derived neutrophil to lymphocyte ratio predicts survival in patients with cancer. Br J Cancer 2012;107:695-9. 10.1038/bjc.2012.292 [DOI] [PMC free article] [PubMed] [Google Scholar]
- 9.Chen L, Hao Y, Zhu LH, et al. Monocyte to lymphocyte ratio predicts survival in patients with advanced gastric cancer undergoing neoadjuvant chemotherapy. Onco Targets Ther 2017;10:4007-16. 10.2147/OTT.S140118 [DOI] [PMC free article] [PubMed] [Google Scholar]
- 10.Koh CH, Bhoo-Pathy N, Ng KL, et al. Utility of pre-treatment neutrophil-lymphocyte ratio and platelet-lymphocyte ratio as prognostic factors in breast cancer. Br J Cancer 2015;113:150-8. 10.1038/bjc.2015.183 [DOI] [PMC free article] [PubMed] [Google Scholar]
- 11.Lisa M. Coussens, Zena Werb. Inflammation and cancer. Nature 2002;420:860-7. 10.1038/nature01322 [DOI] [PMC free article] [PubMed] [Google Scholar]
- 12.Lolli C, Basso U, Derosa L, et al. Systemic immune inflammation index predicts the clinical outcome in patients with metastatic renal cell cancer treated with sunitinib. Oncotarget 2016;7:54564-71. 10.18632/oncotarget.10515 [DOI] [PMC free article] [PubMed] [Google Scholar]
- 13.Lolli C, Caffo O, Scarpi E, et al. Systemic Immune-Inflammation Index Predicts the Clinical Outcome in Patients with mCRPC Treated with Abiraterone. Front Pharmacol 2016;7:376. 10.3389/fphar.2016.00376 [DOI] [PMC free article] [PubMed] [Google Scholar]
- 14.Amin MB, Amin MB, Greene FL, et al. The Eighth Edition AJCC Cancer Staging Manual: Continuing to build a bridge from a population-based to a more "personalized" approach to cancer staging. CA Cancer J Clin 2017;67:93-9. [DOI] [PubMed] [Google Scholar]
- 15.Li Q, Zhuo C, Liang L, et al. Lymph node count after preoperative radiotherapy is an independently prognostic factor for pathologically lymph node-negative patients with rectal cancer. Medicine (Baltimore) 2015;94:e395. 10.1097/MD.0000000000000395 [DOI] [PMC free article] [PubMed] [Google Scholar]
- 16.Bray F, Ren JS, Masuyer E, et al. Global estimates of cancer prevalence for 27 sites in the adult population in 2008. Int J Cancer 2013;132:1133-45. 10.1002/ijc.27711 [DOI] [PubMed] [Google Scholar]
- 17.Huang L, Liu S, Lei Y, et al. Systemic immune-inflammation index, thymidine phosphorylase and survival of localized gastric cancer patients after curative resection. Oncotarget 2016;7:44185-93. [DOI] [PMC free article] [PubMed] [Google Scholar]
- 18.Shirai O, Ohmiya N, Taguchi A, et al. P53, P21 and P73 gene polymorphisms in gastric carcinoma. Hepatogastroenterology 2010;57:1595-601. [PubMed] [Google Scholar]
- 19.Grivennikov SI, Greten FR, Karin M. Immunity, inflammation, and cancer. Cell 2010;140:883-99. 10.1016/j.cell.2010.01.025 [DOI] [PMC free article] [PubMed] [Google Scholar]
- 20.Tan KW, Chong SZ, Wong FH, et al. Neutrophils contribute to inflammatory lymphangiogenesis by increasing VEGF-A bioavailability and secreting VEGF-D. Blood 2013;122:3666-77. 10.1182/blood-2012-11-466532 [DOI] [PubMed] [Google Scholar]
- 21.Labelle M, Begum S, Hynes RO. Platelets guide the formation of early metastatic niches. Proc Natl Acad Sci USA 2014;111:E3053-61. 10.1073/pnas.1411082111 [DOI] [PMC free article] [PubMed] [Google Scholar]
- 22.Ogiya R, Niikura N, Kumaki N, et al. Comparison of tumor-infiltrating lymphocytes between primary and metastatic tumors in breast cancer patients. Cancer Sci 2016;107:1730-5. 10.1111/cas.13101 [DOI] [PMC free article] [PubMed] [Google Scholar]


