

Abstract

Graphene quantum dots (GQDs) have attracted much attention of many researchers because of their low cytotoxicity, good optical stability, and excellent photoluminescence property, which make them novel nanostructured materials in many application fields ranging from energy to biomedicine and the environment. In this work, highly fluorescent nitrogen-doped graphene quantum dots (N-GQDs) were synthesized through microwave heating using sodium citrate and triethanolamine as raw materials. The as-prepared N-GQDs showed considerable bright blue fluorescence with a quantum yield of 8% and excellent uniform dispersion with an average diameter of approximately 5.6 nm; they also exhibited excellent stability and pH-sensitive properties. Furthermore, we demonstrated the application of N-GQDs as probes for metal ion detection. The results indicated that N-GQDs responded rapidly toward Fe3+ because of the static quenching mechanism. A detection method was proposed, with detection linear in two ranges from 20 to 70 nM (F = −0.9666 CFe3+ (nM) + 608.85 (R = 0.9740)) and from 1 to 100 μM (F = −12.04 CFe3+ (μM) + 1191.94 (R = 0.9541)); the lowest detection limit of 9.7 nM for Fe3+ was obtained. The results obtained in this work lay the foundation for the development of high-performance and robust metal ion detection sensors. Moreover, it can also possibly be used as a new type of fluorescent ink.
1. Introduction
Graphene quantum dots (GQDs), as a member of the graphene family, also exhibit a sequence of new properties due to the boundary effect and the quantum constraint effect in addition to their excellent properties.1 Therefore, they have attracted widespread attention from scientists working in the fields of materials, chemistry, physics, and biology.2 GQDs are very small fragments of graphene and represent single to dozens of graphene sheets with diameters less than 20 nm.1,3 Compared with conventional fluorescent organic dyes, colloidal quantum dots, and fluorescent proteins, GQDs have an attractive property; they are a kind of carbon raw material and also show more unique physical and chemical properties such as high optical stability, low toxicity, good biocompatibility, good thermal and electrical conductivity, adjustable photoluminescence, and solubility in various solvents.1,4 Moreover, functionalized or modified graphene quantum dots can alter the photoluminescence properties and improve their quality,5 for example, the introduction of special functional groups on the surface of quantum dots can enhance the specificity of their reaction.6 With the emergence of modified or functionalized nanocomposites, they have become novel nanostructured materials, which have a comprehensive range of applications in energy, biomedical, and environmental fields.4
To date, a variety of top-down and bottom-up approaches are being studied to develop a convenient preparation method of GQDs, such as hydrotherma,7−10 solvothermal,11−14 ultrasonic shearing,15 and microwave.16,17 The former method usually requires multiple steps and lacks control over the product shape and size distribution; also, nonhomogeneous morphology, low quantum yields, and low production yields of GQDs limit the mass production. The latter method, in most cases, refers to the preparation of quantum dots for polycyclic aromatic compounds such as C60 and C70. Indeed, microwave synthetic methods are versatile and can offer several advantages when used. With their homogeneous heating and a quite short reaction time, the microwave method is widely used in the synthesis.
At present, there are many ways to detect ions;18−20 for example, flame atomic absorption spectrometry, with high speed and high accuracy, can meet the requirements of trace element detection of the classic method. But the detection of metal ions by a fluorescent probe has many advantages such as low equipment demand, easy operation, quick analysis, and high sensitivity. To date, quantum dots (QDs), as fluorescent probes, have been widely used both in analysis and in detection.3 Due to different modification effects, QDs show different fluorescence properties; different metal ions can be detected by QDs with different fluorescent properties. As a result, specific physical and chemical reactions occur between the detected object and the functionalized QDs, during which the composition of groups and charges on the surface structure of QDs are altered, resulting in subsequent luminescence intensity either increasing or being extinguished.21
This article aimed to solve the problem of synthesis of a weak fluorescent GQDs by a microwave one-pot synthesis. A particularly weak fluorescent GQDs were prepared according to the reported work by the Zhuang group.2
In this work, we prepared nitrogen-doped graphene quantum dots (N-GQDs) using sodium citrate and triethanolamine (TEOA) as raw materials, which present highly blue fluorescence with an average diameter of approximately 5.6 nm and excellent environmental stability and pH-sensitive properties. The N-GQDs were prepared by a domestic microwave one-step synthesis. No other harsh chemicals (strong acids and organic solvents) were used during the experiment. The method of synthesis is shown in Scheme 1. Compared to the traditional method route, this synthesis method is faster, simpler, and more efficient, and it is easy to obtain the raw materials, easy to operate, and no solvent and catalyst are required. The obtained N-GQDs can be applied to detect Fe3+ as a fluorescent probe due to their high selectivity and high sensitivity toward Fe3+. After adding Fe3+, the experimental results show that the decrease in the fluorescence intensity is directly proportional to the increase in the Fe3+ concentration and that the lowest detection limit (LOD) of 9.7 nM for Fe3+ is obtained. The process of detection is shown in Scheme S1.
Scheme 1. Synthesis of Highly Fluorescent N-GQDs.

2. Results and Discussion
2.1. Optimization of Synthesis Conditions of N-GQDs and Characterization of N-GQDs
Among the experiments conducted, the optimization experiment was carried out first. We investigated the effects of the dosage ratio, microwave temperature, and microwave heating time on the fluorescence intensity of highly fluorescent N-GQDs. Figure S1 shows the effect of different dosage ratios on the fluorescence intensity (1:5, 1:11, 1:20, 1:30, and 1:50). The fluorescence intensity of the product is greatly affected by the dosage ratio, and the result indicated that the fluorescence intensity is optimal when the ratio of sodium citrate to triethanolamine is 1:11. Next, different microwave times (1, 2, 3, 4 min) were measured; the effect of fluorescence intensity of N-GQDs with the microwave time is shown in Figure S2. According to the previous literature, the microwave heating time should be strictly controlled; especially additional heating time should be avoided strictly because overheating may lead to the formation of large nonfluorescent GQDs or graphene oxide.22 The fluorescence intensity was the largest when the time was 2 min. As shown in Figure S3, different microwave temperatures (low, thaw, mid-low, middle, mid-high) were further investigated under the optimal dosage ratio and microwave heating time conditions. The fluorescence intensity is maximum at the middle and low fire. Therefore, we chose the middle and low fire as the optimal heating temperature of the N-GQDs in our subsequent experiments.
According to the previous optimization experiments, we synthesized N-GQDs with a dosage ratio of sodium citrate to triethanolamine of 1:11 at the middle and low fire in 2 min. The fluorescence spectra of the resultant N-GQDs are shown in Figure 1a. The emission peak of N-GQDs is 442 nm and the excitation peak is 340 nm; the bright blue fluorescence was observed when the N-GQDs were exposed to ultraviolet light at 365 nm (Figure 1a). Moreover, the fluorescent properties of the two raw materials through the same reaction process were also compared and are shown in Figure S4. The fluorescence spectra of GQDs with a peak of excitation at 306 nm (black line) and a peak of emission at 404 nm (green line), and TEOA with a peak of excitation at 336 nm (blue line) and a peak of emission at 419 nm (yellow line), and N-GQDs with a peak of excitation at 340 nm (red line) and a peak of emission at 442 nm (pink line) were clearly observed; the fluorescence intensity of the synthesized N-GQDs is 22 times higher than that of the GQDs prepared. Besides, to verify that the GQDs are not doped with a nitrogen element, a simple full survey spectrum through XPS is performed as shown in Figure S5. To survey the surface morphology and estimate the average diameter of the as-prepared N-GQDs, transmission electron microscopy (TEM) analysis was carried out and the results are shown in Figures 1b and S6. The N-GQDs are uniformly dispersed in an aqueous solution without obvious sediment, and the average diameter was approximately 5.6 nm within the particle size distribution range of 2.4–9.6 nm. The atomic force microscopy (AFM) measurement is a powerful tool for the characterization of the thickness of N-GQDs (less than 2 nm), normally thinner than that of carbon dots. The AFM image revealed that the typical topographic heights are mainly in the range of 1.10–1.83 nm, with an average height of 1.58 nm as shown in Figures 1c,d and S7, which suggests that most of the N-GQDs have one to three graphene layers.23 Further, the quantum yield was calculated using a quinine–sulfate solution as the reference; the quantum yields of GQDs and N-GQDs were calculated and are shown in Table S1. The results confirmed that the N-GQDs with an 8% quantum yield have a higher fluorescence quantum yield as compared to GQDs.
Figure 1.

(a) Fluorescence spectra of highly fluorescent N-GQDs with excitation at 340 nm (black line) and emission at 442 nm (red line). Inset: highly fluorescent N-GQDs are under the visible light (left) and a UV lamp at 365 nm (right). (b) TEM image and size distribution of highly fluorescent N-GQDs. (c) AFM image of N-GQDs on a maria substrate. Inset: the height distributions of N-GQDs. (d) Height profile along the lines in (c).
Fourier transform infrared (FT-IR) spectra were evaluated to determine the surface chemistry of the as-prepared N-GQDs. As shown in Figure S8, the FT-IR spectra of N-GQDs exhibited the characteristic peak at 3356 cm–1, showing stretching vibration for the O–H bond. The stretching vibration peaks at 2954, 2887, and 2831 cm–1 are the C–H bond stretching vibration and 1589 cm–1 is the stretching vibration peak of the C=O bond. The stretching vibration peaks at 1404 and 1076 cm–1 were assigned to the C–N bond and the C–O bond, respectively.
The elemental composition and surface groups of N-GQDs were also analyzed by X-ray photoelectron spectroscopy (XPS). Figure 2 shows the full-range spectrum of XPS and high-resolution O 1s, C 1s, and N 1s spectra of the resultant N-GQDs. Three major peaks at 284.6, 401.2, and 532.3 eV were observed in the full-range spectrum, which corresponded to C 1s, N 1s, and O 1s, respectively. This indicated that N-GQDs were mainly composed of carbon, nitrogen, oxygen, and hydrogen, and N atoms have been successfully doped into the framework of N-CQDs. A high-resolution C1s spectrum can be deconvoluted into three typical peaks at 284.7 eV (C–C/C=C), 286.5 eV (C–O/C–N), and 288.6 eV (C=O/C=N). The N 1s spectrum can be broken down into two peaks at 400.2 and 402.9 eV, revealing the presence of pyridinic N and pyrrolic N, respectively. This result indicated that the doped nitrogen existed in the form of the above two chemical states. Moreover, the XPS analysis is in accord with the FT-IR result. Finally, the peaks of the high-resolution spectrum of the O 1s could be fitted into characteristic three peaks at 531.5, 532, and 533.4 eV, respectively, representing C=O and C–O groups. Table S2 indicated that oxygen may be the main doped element that makes an important contribution to the change in the fluorescence property, and nitrogen also plays a certain role but the effect is not very obvious, which is consistent with previous reports.24,25
Figure 2.

(a) XPS full-range survey spectrum and (b) high-resolution C 1s, (c) N 1s, and (d) O 1s spectra of as-prepared N-GQDs.
2.2. Optical Properties of N-GQDs
As shown in the UV–vis spectrum (Figure 3a), one characteristic absorption band in the ultraviolet region was observed. The absorption peak of N-GQDs in the ultraviolet region is about 263 nm, corresponding to the GQDs of π–π* energy-level transition. The intensity of the light absorption peak first increases and then decreases with an increase in the dilution ratio with a slight redshift, which is likely caused due to surface/edge defects in the N-GQDs. In addition, compared with other semiconductor QDs, GQDs have a unique characteristic of larger fluorescence bandwidth; its fluorescence bandwidth decreases with an increase in the excitation wavelength and redshift occurs. Figure 3b shows the emission spectra of the resultant N-GQDs with increasing excitation wavelength ranging from 280 to 520 nm. The resultant N-GQDs display the highest emission intensity when excited at 340 nm. The emission bands show the redshift phenomenon with increasing excitation wavelength, as shown in the normalized fluorescence emission spectra (Figure 3b).
Figure 3.

(a) UV–vis absorption spectra of the as-prepared N-GQDs. (b) Fluorescence (FL) emission spectra of highly fluorescent N-GQDs excited by various wavelengths ranging from 280 to 520 nm (inset: the normalized FL emission spectra). (c) The photobleaching performance of the N-GQD solution under continuous illumination with a 365 nm UV lamp for 1 h.
The fluorescence stability of the resultant N-GQDs was also studied. The photobleaching performance was evaluated (Figures 3c and S9). The as-prepared N-GQDs show insignificant photobleaching under continuous illumination with the 365 nm UV lamp for 1 h and fluorescent time scan for 2 h under 360 nm excitation. The results showed that the fluorescence intensity remained stable and strong during continuous illumination or scanning. The pH values of the solution increasing from 2 to 12 were tested. At pH ranging from 2 to 5, the fluorescence intensity of the as-prepared N-GQDs increased with increasing pH values; however, the fluorescence intensity of the N-GQDs decreased with increasing pH between 7 and 12 (Figure S10). The fluorescent intensity is the highest when the pH value is 5; this result indicated that the fluorescence intensity of N-GQDs was closely related to the pH. Therefore, the subsequent detection of ions is completed in phosphate-buffered saline (PBS)-buffered solution (pH 5). In addition, the fluorescence intensity of N-GQDs in different concentrations of NaCl solutions did not change significantly within 1 M (Figure S11), which indicated that the N-GQDs remain stable under conditions of high ionic strength and this result confirmed their viability in complex environments.
2.3. Fluorescence Sensing of Fe3+
The fluorescence reaction-quenching effects of the N-GQDs were investigated to test the selectivity and sensing after adding to different metal ions including Co2+, Fe3+, Fe2+, Ni2+, Bi2+, Na+, Mn2+, Cd2+, Ca2+, K+, Mg2+, Zn2+, Al3+, Pb2+, and Cr3+, respectively. Figure 4a,b shows that Fe2+ and Fe3+ can trigger the fluorescence reaction quenching of N-GQDs. Ferrum exists universally in two kinds of stable states in nature, namely Fe2+ and Fe3+, which can sometimes transform into each other. It was reported that ferrum in nature mainly exists in the form of Fe3+, and Fe3+ is an important ion in the biological system; it can be an indicator of conditions such as mental decline, heart failure, diabetes, and anemia.26 Therefore, the determination of Fe3+ is very important in sensing and environmental fields.
Figure 4.

(a, b) Fluorescence spectra of the highly fluorescent N-GQDs in the presence of various common metal ions. (c) Fluorescence spectra of the highly fluorescent N-GQDs upon the addition of Fe3+ increasing from 0 to 0.1 mM. (d) Linear relationship between Fe3+ concentrations and the fluorescence intensity.
As shown in Figure 4c, the fluorescence intensity of the N-GQD solution significantly decreased with increasing Fe3+ concentration from 0 to 0.1mM, which suggested that there is a certain correlation between the fluorescence intensity and the ion concentration. As shown in Figure 4d, two good linear relationships between quenching efficiency were observed over the ranges of 1–100 μM and 20–70 nm, and a detection method was used with two detection linear ranges from 20 to 70 nm (F = −0.9666 CFe3+ (nM) + 608.85 (R = 0.9740)) and from 1 to 100 μM (F = −12.04 CFe3+ (μM) + 1191.94 (R = 0.9541)). The lowest detection limit (LOD) of 9.7 nM was obtained for Fe3+ (LOD = 3Sa/b, where Sa represents the lowest signal standard deviation and b represents the slope of the linear calibration plot).27 The above experimental results clearly prove that N-GQDs can be applied as highly effective nanotechnology for the detection of Fe3+.
To investigate the mechanisms for interaction between N-GQDs and the detected ion, a Stern–Volmer plot was constructed to understand the quenching process of the system. Generally, the fluorescence-quenching process is caused by the interaction between fluorescence molecules and quenching molecules, which usually includes dynamic quenching or static quenching. The Stern–Volmer equation is given by
where F and F0 are the fluorescence intensities of N-GQDs in the presence and absence of the Fe3+ solution at an excitation of 340 nm, respectively, [Q] is the concentration of the quencher, and ksv represents the quenching constant.
The Stern–Volmer plot showed a good linear trend of the Fe3+ concentration in both the ranges 1–100 μM and 20–70 nm (Figure S12). The quenching constant (ksv) in the standard Stern–Volmer equation is a method to measure the binding affinity between fluorescence molecules and quenching molecules, and was equal to 1.2 × 10⁴ M–1 (μM grade) by the above equation. Therefore, we speculate that the static quenching may be caused by the combination of ground-state fluorescence molecules and quenching molecules to form nonfluorescent complexes. Meanwhile, the fluorescence lifetimes of N-GQDs and the N-GQDs/Fe3+ complex were determined as shown in Figure 5. The fluorescence lifetime of N-GQDs is 2.80 ns, which has three components: 0.50 ns (ca. 40.47%), 2.30 ns (ca. 39.75%), and 8.56 ns (ca. 19.78%) under excitation of 360 nm in solution. In the presence of Fe3+, the fluorescence lifetime of N-GQDs/Fe3+ is 1.90 ns, which also contains two components, 0.56 ns (ca. 48.86%) and 3.18 ns (ca. 51.14%), under the same condition. The average decay times of N-GQDs and N-GQDs/Fe3+ are very similar, which further confirms the formation of the nonfluorescent complexes due to static quenching. A TEM image of the N-GQDs/Fe3+ complex was also obtained (Figure S13) and the size shows little change when compared with that of the N-GQDs. Furthermore, evident changes were observed in the FT-IR spectra of N-GQDs without and with the addition of Fe3+ (Figure S8); this demonstrated that the chemical behavior of surface functionalities of N-GQDs changes due to strong affinity with Fe3+, and changes in the XPS spectra of N-GQDs with and without Fe3+ in Figure S14 indicated that the fluorescence quenching might be ascribed to the coordination of Fe3+ with −C–N–C of N-GQDs from the nonfluorescent complex.
Figure 5.
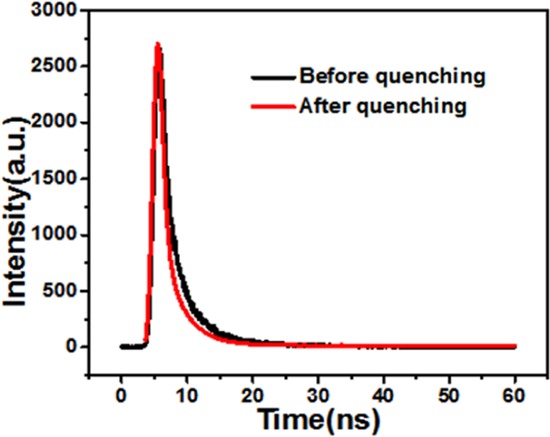
Fluorescence decays of N-GQDs and the N-GQDs/Fe3+ complex.
Finally, valid practical applications of N-GQDs were performed in sensing of Fe3+ in real samples such as tap water or natural mineral water and used as fluorescent ink. The recovery rate of Fe3+ in natural mineral water was about 107–129% and the recovery rate of Fe3+ in tap water was about 89–101% as shown in Table S3. Fluorescent patterns and characteristics on the filter paper under 365 nm UV lamp irradiation, as shown in Figure 6, indicated that it can possibly be used as a new type of fluorescent ink.
Figure 6.

(a, b) Fluorescent patterns and characteristics (c) on the filter paper under 365 nm UV lamp irradiation.
3. Conclusions
In this paper, we developed a highly efficient one-step synthesis method for highly fluorescent N-GQDs from the carbonization of sodium citrate and triethanolamine using a microwave; the as-prepared N-GQDs showed a bright blue luminescence with an 8% quantum yield and exhibited excellent properties such as high fluorescence intensity, excellent stability, and water solubility. The N-GQDs were successfully applied to act as a fluorescent probe for the detection of Fe3+ concentration with high selectivity and sensitivity due to a static quenching mechanism. The N-GQDs prepared showed good stability and a low detection limit, and it can possibly be used as a new type of fluorescent ink.
4. Experimental Section
4.1. Chemicals and Materials
Sodium citrate (Na3C6H5O7·2H2O) was purchased from China National Pharmaceutical Group Chemical Reagent Co., Ltd. Shanghai. Triethanolamine (TEOA, C6H15NO3) was purchased from Inner Mongolia Renjiu Trade Co., Ltd. All reagents and chemicals used in this work were of analytical grade and can be used directly without further purification. Phosphate-buffered solution (LOD) [50 mM, pH 5.0] was prepared with KH2PO4 and Na2HPO4.
4.2. Sample Characterization
The ultraviolet-visible (UV–vis) absorption spectra and fluorescence spectrum were recorded using a Hitachi U-2900 (Hitachi, Japan) UV–vis spectrophotometer and a Hitachi F-4600 (Hitachi, Japan) fluorescence spectrophotometer, respectively. The images of transmission electron microscopy (TEM) were taken using a JEOL-2100F transmission electron microscope (Japan) to probe the surface morphology and assess the average diameter of N-GQDs. Fourier transform infrared (FT-IR) spectra were characterized using a Nicolet Avatar 360 FT-IR spectrophotometer (Thermo Fisher Scientific). X-ray diffraction patterns were measured using an X-ray diffractometer (Rigaku, Japan). X-ray photoelectron spectroscopy (XPS) data were collected by a Thermo Scientific ESCALab 250Xi. The fluorescence lifetime was measured with an Edinburgh Instruments FLS980 fluorescence spectrophotometer with excitation at 360 nm.
4.3. Preparation of N-GQDs
N-GQDs were synthesized with sodium citrate and triethanolamine as raw materials by a one-step microwave synthesis method. In a typical process of synthesis, 2.0 g of sodium citrate and 10 mL of triethanolamine were added to 20 mL reagent bottle, stirred for 3 h until a transparent liquid was formed, and heated using a domestic microwave oven (Galanz, 750 W) for 2 min at the middle and low fire (80 °C). After cooling to room temperature, the products were centrifuged at 8000 rpm and the upper liquid was collected. The resultant N-GQDs were stored in a 4 °C refrigerator. Before use, the faint yellow solution obtained was subsequently purified with dialysis in deionized water using a dialysis bag (MWCO = 500 Da) for 24 h or more to remove the residue. The same method was used to synthesize undoped GQDs without adding triethanolamine.
4.4. Fluorescence Detection of Fe3+
For the fluorescence detection of metal ions, we studied the influence of metal ions on the fluorescence (FL) intensity of N-GQDs in a PBS buffer solution at room temperature. The detection of Fe3+ was performed by the following steps: first, in a typical procedure, 600 μL solution of N-GQDs and 300 μL of the PBS buffer solution (50 mM, pH 5) were fully mixed and then added to 100 μL of various metal ions solution of the same concentration (1 mM), including Co2+, Ni2+, Fe2+, Fe3+, Bi2+, Na+, Mn2+,Cd2+, Ca2+, K+, Mg2+, Zn2+, Al3+, Pb2+, and Cr3+; all of the aforementioned ion solutions were obtained from the corresponding nitrate (NO3–) and chloride (Cl–) reagents. They were reacted at room temperature for a few minutes; then, the fluorescent intensity of each sample was monitored in turn. Next, different concentrations of the Fe3+ solution from 0 to 1 mM were mixed with the as-prepared solution and the PBS buffer solution; the volume and reaction conditions of each substance are the same as above. Then, the fluorescent spectra were measured for each sample.
4.5. Fluorescent Ink
The solution of newly synthesized quantum dots is used as ink, and a cotton swab is used to draw patterns or letters in various shapes on a filter paper.
Acknowledgments
This work was supported financially by the Natural Science Foundation of Inner Mongolia (grant no. 2018MS02012), the National Natural Science Foundation of China (grant no. 21864020), the Collaborative Innovation Center for Water Environmental Security of Inner Mongolia Autonomous Region, China (grant no. XTCX003), and the “Young Science and Technology Talents Program” (Leading Person) in Inner Mongolia Autonomous Region Colleges and Universities (grant no. NJYT-19-A04).
Supporting Information Available
The Supporting Information is available free of charge on the ACS Publications website at DOI: 10.1021/acsomega.9b01612.
Quantum yield calculation of GQDs and N-GQDs; TEM and AFM images; XPS survey spectra; FT-IR spectra; fluorescence spectrum; and application of N-GQDs in real samples (PDF)
The authors declare no competing financial interest.
Supplementary Material
References
- Bacon M.; Bradley S. J.; Nann T. Graphene Quantum Dots. Part. Part. Syst. Charact. 2014, 31, 415–428. 10.1002/ppsc.201300252. [DOI] [Google Scholar]
- Tang L.; Ji R.; Li X.; Teng K. S.; Lau S. P. Energy-level structure of nitrogen-doped graphene quantum dot. J. Mater. Chem. C 2013, 1, 4908–4915. 10.1039/c3tc30877d. [DOI] [Google Scholar]
- Xu Y.; Wang X.; Zhang W. L.; Guo F.; Lv S. Recent progress in two-dimensional inorganic quantum dots. Chem. Soc. Rev. 2018, 47, 586–625. 10.1039/C7CS00500H. [DOI] [PubMed] [Google Scholar]
- Zhuang Q.; Wang Y.; Ni Y. Solid-phase synthesis of graphene quantum dots from the food additive citric acid under microwave irradiation and their use in live-cell imaging. Luminescence 2016, 31, 746–753. 10.1002/bio.3019. [DOI] [PubMed] [Google Scholar]
- Zhu S.; Song Y.; Zhao X.; Shao J.; Zhang J.; Yang B. The photoluminescence mechanism in carbon dots (graphene quantum dots, carbon nanodots, and polymer dots): current state and future perspective. Nano Res. 2015, 8, 355–381. 10.1007/s12274-014-0644-3. [DOI] [Google Scholar]
- Zhu S.; Zhang J.; Tang S.; Qiao C.; Wang L.; Wang H.; Wang X.; et al. Surface chemistry routes to modulate the photoluminescence of graphene quantum dots: from fluorescence mechanism to up-conversion bioimaging applications. Adv. Funct. Mater. 2012, 22, 4732–4740. 10.1002/adfm.201201499. [DOI] [Google Scholar]
- Tran Van T.; Won Mook C. One-pot synthesis of highly fluorescent amino-functionalized graphene quantum dots for effective detection of copper ions. Curr. Appl. Phys. 2018, 18, 1255–1260. 10.1016/j.cap.2018.07.002. [DOI] [Google Scholar]
- Han B.; Peng T.; Yu M.; Chi C.; Li Y.; Hu X.; He G. One-pot synthesis of highly fluorescent Fe2+-doped carbon dots for a dual-emissive nanohybrid for the detection of zinc ions and histidine. New J. Chem. 2018, 42, 13651–13659. 10.1039/C8NJ01858H. [DOI] [Google Scholar]
- Singh V. K.; Singh V.; Yadav P. K.; Chandra S.; Bano D.; Kumar V.; Koch B.; Talat M.; Hasan S. H. Bright-blue-emission nitrogen and phosphorus-doped carbon quantum dots as a promising nanoprobe for detection of Cr (VI) and ascorbic acid in pure aqueous solution and in living cells. New J. Chem. 2018, 42, 12990–12997. 10.1039/C8NJ02126K. [DOI] [Google Scholar]
- Ju J.; Chen W. Synthesis of highly fluorescent nitrogen-doped graphene quantum dots for sensitive, label-free detection of Fe (III) in aqueous media. Biosens. Bioelectron. 2014, 58, 219–225. 10.1016/j.bios.2014.02.061. [DOI] [PubMed] [Google Scholar]
- Zhao P.; Zhu L. Dispersibility of carbon dots in aqueous and/or organic solvents. Chem. Commun. 2018, 54, 5401–5406. 10.1039/C8CC02279H. [DOI] [PubMed] [Google Scholar]
- Zong J.; Zhu Y.; Yang X.; Shen J.; Li C. Synthesis of photoluminescent carbogenic dots using mesoporous silica spheres as nanoreactors. Chem. Commun. 2011, 47, 764–766. 10.1039/C0CC03092A. [DOI] [PubMed] [Google Scholar]
- Nair R. V.; Thomas R. T.; Sankar V.; Muhammad H.; Dong M.; Pillai S. Rapid, acid-free synthesis of high-quality graphene quantum dots for aggregation induced sensing of metal ions and bioimaging. ACS Omega 2017, 2, 8051–8061. 10.1021/acsomega.7b01262. [DOI] [PMC free article] [PubMed] [Google Scholar]
- Zhu S.; Zhang J.; Liu X.; Li B.; Wang X.; Tang S.; Yang B.; et al. Graphene quantum dots with controllable surface oxidation, tunable fluorescence and up-conversion emission. RSC Adv. 2012, 2, 2717–2720. 10.1039/c2ra20182h. [DOI] [Google Scholar]
- Zhuo S.; Shao M.; Lee S. T. Upconversion and downconversion fluorescent graphene quantum dots: ultrasonic preparation and photocatalysis. ACS Nano 2012, 6, 1059–1064. 10.1021/nn2040395. [DOI] [PubMed] [Google Scholar]
- Tang Y.; Rao L.; Li Z.; Lu H.; Yan C.; Yu S.; Ding X.; Yu B. Rapid synthesis of highly photoluminescent nitrogen-doped carbon quantum dots via a microreactor with foamy copper for the detection of Hg2+ ions. Sens. Actuators, B 2018, 258, 637–647. 10.1016/j.snb.2017.11.140. [DOI] [Google Scholar]
- Zheng B.; Chen Y.; Li P.; Wang Z.; Cao B.; Qi F.; Liu J.; Qiu Z.; Zhang W. Ultrafast ammonia-driven, microwave-assisted synthesis of nitrogen-doped graphene quantum dots and their optical properties. Nanophotonics 2017, 6, 259–267. 10.1515/nanoph-2016-0102. [DOI] [Google Scholar]
- Porento M.; Sutinen V.; Julku T.; Oikari R. Detection of copper in water using on-line plasma-excited atomic absorption spectroscopy (AAS). Appl. Spectrosc. 2011, 65, 678–683. 10.1366/10-06051. [DOI] [PubMed] [Google Scholar]
- Deng B.; Li X.; Zhu P.; Xu X.; Xu Q.; Kang Y. Speciation of magnesium in rat plasma using capillary electrophoresis-inductively coupled plasma-atomic emission spectrometry. Electrophoresis 2008, 29, 1534–1539. 10.1002/elps.200700423. [DOI] [PubMed] [Google Scholar]
- Pröfrock D.; Prange A. Inductively coupled plasma-mass spectrometry (ICP-MS) for quantitative analysis in environmental and life sciences: a review of challenges, solutions, and trends. Appl. Spectrosc. 2012, 66, 843–868. 10.1366/12-06681. [DOI] [PubMed] [Google Scholar]
- Zou L.; Gu Z.; Sun M. Review of the application of quantum dots in the heavy-metal detection. Toxicol. Environ. Chem. 2015, 97, 477–490. 10.1080/02772248.2015.1050201. [DOI] [Google Scholar]
- Tang L.; Ji R.; Li X.; Teng K. S.; Lau S. P. Size-dependent structural and optical characteristics of glucose-derived graphene quantum dots. Part. Part. Syst. Charact. 2013, 30, 523–531. 10.1002/ppsc.201200131. [DOI] [Google Scholar]
- Hu C.; Liu Y.; Yang Y.; Cui J.; Huang Z.; Wang Y.; Yang L.; Wang H.; Xiao Y.; Rong J. One-step preparation of nitrogen-doped graphene quantum dots from oxidized debris of graphene oxide. J. Mater. Chem. B 2013, 1, 39–42. 10.1039/C2TB00189F. [DOI] [PubMed] [Google Scholar]
- Li Y.; Zhao Y.; Cheng H.; Hu Y.; Shi G.; Dai L.; Qu L. Nitrogen-doped graphene quantum dots with oxygen-rich functional groups. J. Am. Chem. Soc. 2012, 134, 15–18. 10.1021/ja206030c. [DOI] [PubMed] [Google Scholar]
- Shi B.; Zhang L.; Lan C.; Zhao J.; Su Y.; Zhao S. One-pot green synthesis of oxygen-rich nitrogen-doped graphene quantum dots and their potential application in pH-sensitive photoluminescence and detection of mercury (II) ions. Talanta 2015, 142, 131–139. 10.1016/j.talanta.2015.04.059. [DOI] [PubMed] [Google Scholar]
- Shangguan J.; Huang J.; He D.; He X.; Wang K.; Ye R.; Yang X.; Qing T.; Tang J. Highly Fe3+ selective fluorescent nanoprobe based on ultrabright N/P codoped carbon dots and its application in biological samples. Anal. Chem. 2017, 89, 7477–7484. 10.1021/acs.analchem.7b01053. [DOI] [PubMed] [Google Scholar]
- Shrivastava A.; Gupta V. B. Methods for the determination of limit of detection and limit of quantitation of the analytical methods. Chron. Young Sci. 2011, 2, 21–25. 10.4103/2229-5186.79345. [DOI] [Google Scholar]
Associated Data
This section collects any data citations, data availability statements, or supplementary materials included in this article.