

Abstract
Perfluorooctane sulfonate (PFOS) known as a persistent organic pollutant has been attracting great interests due to its potential ecotoxicity. An approach capable of sensing ultra-trace PFOS is in urgent demand. Here, we developed an approach for highly sensitive sensing PFOS using surfactant-sensitized covalent organic frameworks (COFs)-functionalized upconversion nanoparticles (UCNPs) as a fluorescent probe. COFs-functionalized UCNPs (UCNPs@COFs) were obtained by solvothermal growth of 1,3,5-triformylbenzene and 1,4-phenylenediamine on the surface of UCNPs. COF’s layer on the surface of UCNPs not only provides recognition sites for PFOS but also improves the fluorescence quantum yields from 2.15 to 5.12%. Trace PFOS can quench the fluorescence emission of UCNPs@COFs at 550 nm due to the high electronegativity of PFOS. Moreover, the fluorescence quenching response can be significantly strengthened in the presence of a surfactant, which causes more sensitivity. The fluorescence quenching degrees (F0 – F) of the system are linear with the concentration of PFOS in the range of 1.8 × 10⁻¹³ to 1.8 × 10⁻⁸ M. The present sensor can sensitively and selectively detect PFOS in tap water and food packing with the limit of detection down to 0.15 pM (signal-to-noise ratio = 3), which is comparable to that of the liquid chromatography–mass spectrometry technique. The proposed approach realized a simple, fast, sensitive, and selective sensing PFOS, showing potential applications in various fields.
Introduction
Perfluorooctane sulfonate (PFOS) is an important chemical, which has been extensively used to make various products such as textiles, lubricants, clothes, cosmetics, carpet, waterproof agents, and firefighting foams due to its hydrophobic and oleophobic nature.1,2 PFOS is also well known as a typical persistent organic pollutant due to its persistence, bioaccumulation, high toxicity, and difficult degradation in the environment on account of the stability of the carbon–fluorine bond in fluorocarbons.3 As a widespread contaminant, the existence of PFOS in our surroundings has been widely reported.4 Toxicological studies have demonstrated that the presence of PFOS even in trace amounts might induce serious functional damages to the human liver and kidneys and adverse effects on the fatty acid metabolism, the reproductive system, and hormones secretion system.2,5,6 It is imperative to develop highly sensitive analytical methods for investigating the spread and potential quantity of PFOS in the environment. In the past years, major detection methods available for PFOS were mainly based on liquid chromatography–mass spectrometry (LC–MS) and liquid chromatography–mass spectrometry/mass spectrometry (LC–MS/MS).7−9 These techniques have demonstrated high sensitivity; however, complicated and expensive equipment, expert operators, and time-consuming sample preparation have limited their wide application in real-time monitoring. Thus, various sensing techniques such as electrochemical,10 photoelectrochemical,11 and fluorescence1,12−15 have also been used to detect PFOS. Nevertheless, these methods still have some disadvantages, such as lack of electrochemical activity,16,17 lower sensitivity, and serious background interference. Based on these facts, a rapid, simple, and sensitive method for the detection of PFOS is highly desirable for environmental monitoring.
Over the past decades, upconversion nanoparticles (UCNPs), especially lanthanide-doped nanocrystals, have attracted wide attention due to their prominent property that converts low-energy light (near-infrared) into a higher-energy light (UV–vis) via a two-photon or multiphoton mechanism.18 Compared with traditional fluorophores, UCNPs possess unique properties such as a weak autofluorescence background, high photochemical stability, high resistance to photobleaching, large Stokes shifts, sharp emission bands, and high fluorescence quantum yield.19−21 These unique properties make them ideal sensing materials for sensing trace targets in chemical and biochemical analysis.22−24 Furthermore, the integration of UCNPs with other functional nanostructures could construct the various nanocomposites with highly enriched functionalities,25 which possess a great utilitarian value for highly sensitive sensors. Covalent organic frameworks (COFs), as an emerging class of crystalline porous polymer materials covalently connected by organic building blocks containing light elements (typically C, H, N, B, O),26,27 have received exponential attention due to their remarkable properties such as low density, periodic porosity, high surface area, and high thermal and chemical stability.28−30 COFs have shown great potential applications in many research fields, such as gas storage and adsorption, chemical sensors, and drug delivery.31−33 In addition, COFs have been considered as ideal candidates for fluorescence sensors due to their conjugated structure. However, up to now, little attention has been devoted to construct the fluorescence sensor based on the combination of COFs with UCNPs.
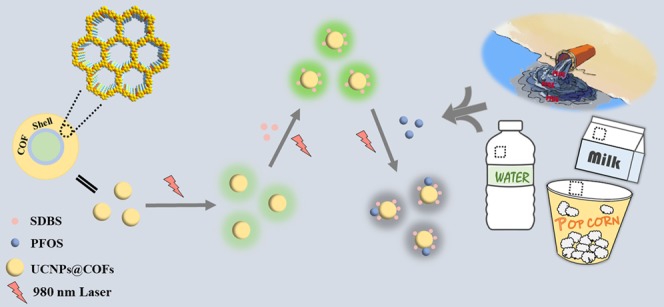
Here, we proposed a highly sensitive fluorescence approach for sensing ultra-trace PFOS based on a novel fluorescent probe integrating the advantages of UCNPs and COFs. Such a fluorescent probe was synthesized via the solvothermal growth of COFs on the surface of UCNPs (denoted as UCNPs@COFs). UCNPs were prepared by the solvothermal method with uniform size and shape and then modified by tetraethyl orthosilicate (TEOS) and 3-aminopropyltrimethoxysilane (APS) to generate amine groups-functionalized UCNPs (denoted as UCNPs@NH2). Meanwhile, highly stable porous COFs were synthesized by the condensation reaction between 1,3,5-triformylbenzene (TFB) and p-phenylenediamine (PDA) on the surface of UCNPs@NH2 (Scheme 1a). Importantly, the fluorescence response of UCNPs@COFs was highly sensitive to PFOS, and the fluorescence quenching occurred in the presence of different concentrations of PFOS (Scheme 1b). Besides, the surfactant could further sensitize the fluorescence quenching. With the sensing system, the amount of PFOS spiked in tap water and food packing was successfully analyzed.
Scheme 1. (a) Illustration of the Synthesis of Core–Shell UCNPs@COFs Nanoparticles and (b) Schematic Illustration of UCNPs@COFs Fluorescent Nanoparticles for Sensing PFOS.

Results and Discussion
Synthesis and Characterization of UCNPs@COFs
UCNPs with uniform size and shape distribution are highly attractive label groups.34 COF-LZU1 is a typical imine-based COF prepared by the condensation reaction between TFB and PDA.35 Here, we integrate the advantages of UCNPs and COF-LZU1 to fabricate the core–shell UCNPs@COFs. It is worth mentioning that besides the selective enrichment of PFOS, COF material on the surface of UCNPs also enhances dramatically the fluorescence quantum yield from 2.15 to 5.12%. The reason for the enhanced fluorescence quantum of UCNPs after being functionalized with COFs can be explained from two aspects. First, the surface characteristics of UCNPs are important for the fluorescence efficiency of UCNPs, as they expose numerous lanthanide dopants to surface deactivations caused by surface defects.36 Therefore, the upconversion efficiency can be improved by adjusting the surface surroundings of lanthanide UCNPs, such as the formation of core–shell structures or the combination with other materials.37 Besides, COFs usually contain large π-conjugated building units because of the inherent rigid structure. Therefore, COFs were mainly synthesized through the reactions of aromatic building blocks. Especially, the formation of −C=N– bonds could further enhance the π-conjugated system and the resulting materials have a stronger fluorescent intensity.38,39 The resulting fluorescent nanoparticle was employed as a fluorescent probe for sensing PFOS (Scheme 1). In the first step, UCNPs were synthesized by the solvothermal method, and the transmission electron microscope (TEM) image showed that the particle size of the hexagonal-phase UCNPs crystals was about 20–30 nm (Figure 1a). In the second step, the resulting UCNPs were further modified with APS by the reverse microemulsion method to obtain amino-functionalized UCNPs (UCNPs@NH2). As shown in Figure 1b, a layer material of amine groups has been successfully coated onto the surface of UCNPs, and the radius of the spherical particle was approximately 60 nm. In the final step, the nucleation seed material was synthesized by coating a thin layer of Schiff base polymer on the surface of UCNPs@NH2. As a special monomer, UCNPs@NH2 with amino groups could react with the aldehyde groups of TFB and significantly improve the compatibility of UCNPs and COFs. Then, TFB and PDA were added to synthesize COFs on the surface of the seed particles. TEM images revealed core–shell structures of the resulting UCNPs@COFs, and the thickness of the COFs layer was about 5 nm (Figure 1c). In addition, the scanning electron microscopy (SEM) image (Figure S1) also showed that the resultant was spherical and a fluffy porous structure was clearly observed.
Figure 1.

TEM images of UCNPs (a), UCNPs@NH2 (b), and UCNPs@COFs (c). (d) Fourier transform infrared (FT-IR) spectra of UCNPs (black), UCNPs@NH2 (red), and UCNPs@COFs (blue). (e) Powder X-ray diffraction (PXRD) patterns of JCPDS standard card number 16-0334 (green), UCNPs (pink), UCNPs@NH2 (blue), COFs (red), and UCNPs@COFs (black). (f) Thermogravimetry analysis (TGA) patterns of UCNPs (black) and UCNPs@COFs (red).
The corresponding structures of the resulting material in different steps were confirmed by FT-IR (Figure 1d). The characteristic peaks of the asymmetric and symmetrical stretching vibration of C=O groups of oleic acid (OA) were visible at 1421 and 1560 cm–1, respectively, and the peaks at 2929 and 2855 cm–1 were assigned to the stretching vibration of the methylene and ethylene groups of OA, respectively. For the FT-IR spectra of UCNPs@NH2, the peaks at 1047 and 3436 cm–1 were attributed to the stretching vibration of Si–O–Si and N–H, respectively. The vibration bands at around 1617 cm–1 in the FT-IR spectrum of UCNPs@COFs were visibly observed, which was evident for the formation of the C=N bond. By comparing the FT-IR spectrum of UCNPs@COFs with those of the corresponding monomers, the reduced peak intensities corresponding to aldehyde (1697 cm–1) and amino (3374 cm–1) bands were associated with the residual aldehyde and amino groups at the edges of the COFs, respectively (Figure S2).
To further validated the resulting material, the crystal structures were analyzed by PXRD. As shown in Figure 1e, the shape and position of UCNPs diffracted peaks were consistently matched with the standard alignment card (JCPDS standard card number 16-0334). There were no significant changes in the PXRD curve of UCNPs@NH2 via the amino-functionalized process, and the curve of UCNPs@COFs contained major peaks and crystallinity of COFs, which could indicate that COFs have been successfully grafted on the surface of the UCNPs@NH2 via the Schiff base reaction.
The thermal stabilities of UCNPs and UCNPs@COFs were evaluated by TGA. The curves of UCNPs and UCNPs@COFs are all shown in Figure 1f. The mass loss was observed in the range from 200 to 800 °C, which could result from the decomposition of the organic coating of COFs. In addition, the evaporation of the adsorbed moisture also caused mass loss below 200 °C (Figure 1f). The mass loss in the range of 200–800 °C followed the sequence of UCNPs (10.5%) < UCNPs@COFs (43.6%), which indicated the successful bonding of COFs on the surface of UCNPs.
Fluorescence Response of UCNPs@COFs to PFOS
Fluorophore, the solvent, and the analyte are three major factors of fluorescence sensing. The interference of the Raman scattering signal of the solvent can be eliminated due to the inherent nature of the present upconversion fluorescence material. Here, the fluorescence emissions of UCNPs@COFs dispersed in different solvents were first investigated, where four organic solvents (ethanol, dimethylformamide (DMF), acetonitrile, and dichloromethane (DCM)) commonly used in laboratories and water were chosen. The results displayed that the fluorescence emission intensity of UCNPs@COFs dispersed in different solvents had a marked difference. The resulting material dispersed in DMF exhibited the strongest fluorescence emission at 550 nm among the investigated solvents (Figure S3). The fluorescence emission intensities of UCNPs@COFs dispersed in different organic solvents decreased in the order of DMF, acetonitrile, ethanol, and DCM. The weakest fluorescence emission was observed in the case of UCNPs@COFs dispersed in water and is the reason we inferred was that the polarity of the organic solvent mainly led to the difference in the fluorescence intensity. The polarity of these organic solvents decreased in the order of DMF > acetonitrile > ethanol > DCM. In addition, the weakest fluorescence emission of UCNPs@COFs dispersed in water might be attributed to the strong polarity of water to form the hydrogen bond between water and the imine of the material, and the poor dispersion in water was caused by the hydrophobic nature of UCNPs@COFs. Thus, the subsequent experiments were conducted in the DMF medium.
Besides the effect of the solvent on the fluorescence intensity, the stability and the amount of the resulting fluorescence material added have been also evaluated. The fluorescence emission intensities were almost constant as the initial level after storage for 90 days in DMF (Figure S4), which illustrated the excellent stability of UCNPs@COFs. In addition, the fluorescence response of the resulting material to PFOS was examined by mixing different concentrations (0.07, 0.08, 0.09, 0.10, 0.11, and 0.12 mg·mL–1) of UCNPs@COF solution with a fixed concentration of the PFOS solution. From these results, we found that when the concentration of the resulting fluorescence material was 0.10 mg·mL–1, the maximum difference F0 – F (here, F0 and F are the fluorescence intensities of UCNPs@COFs without and with PFOS, respectively) was obtained (Figure 2a). Thus, we could conclude that the fluorescence emission of UCNPs@COFs was quenched by PFOS, and the quenching degree was dependent on the concentrations of UCNPs@COFs. So, we chose 0.10 mg·mL–1 UCNPs@COFs for further experiments.
Figure 2.

(a) Effect of the concentration of UCNPs@COFs on fluorescence quenching. (b) Effect of the reaction time on fluorescence quenching. (c) Effect of different surfactants on fluorescence quenching. (d) Effect of the concentration of SDBS on fluorescence quenching (F0 and F are the fluorescence intensities of UCNPs@COFs at 550 nm in the absence and presence of PFOS, respectively).
Effect of the Reaction Time on Fluorescence Quenching
Reaction time is a significant factor in the sensing system. Here, the effect of the reaction time on the fluorescence quenching efficiency of UCNPs@COFs has been checked by keeping the concentration of UCNPs@COFs (0.10 mg·mL–1) and PFOS (1.8 × 10⁻⁴ M) constant. The results revealed that fluorescence quenching immediately occurred, and the quenching efficiency was increased by increasing the reaction time to 10 min and then decreased with the increase in the reaction time (Figure 2b). Thus, the reaction time was set at 10 min for the following experiments.
Effect of the Surfactant on Fluorescence Quenching
Surfactants have been well known as dispersing agents and surface modifiers.40 To acquire a preferable fluorescence quenching efficiency, we inspected whether the addition of a surfactant to the sensing system could improve the fluorescence response of UCNPs@COFs to PFOS. Here, three kinds of surfactants, including two anion surfactants (sodium dodecylsulfate (SDS) and sodium dodecyl benzene sulfonate (SDBS)), two cationic surfactants (hexadecyl trimethyl ammonium bromide (CTAB) and cetylpyridine bromide (CPB)), and one neutral surfactant (3-[(3-cholamidopropyl) dimethylammonio] propanesulfonate; CHAPS), were employed. The fluorescence response of UCNPs@COFs to PFOS was checked in the presence of each surfactant. As shown in Figure 2c, the surfactant markedly affected the fluorescence quenching of UCNPs@COFs caused by PFOS. Compared with the results obtained in the absence of any surfactant, SDS, SDBS, and CHAPS could enhance fluorescence quenching; however, CTAB and CPB caused an inverse effect (Figure S5). The strongest quenching response of the material caused by PFOS was observed in the presence of SDBS. We speculated that the surfactant changed the surface property of UCNPs@COFs due to their interaction. CTAB and CPB carried a positive charge and both could induce a charge transfer from UCNPs@COFs to surfactants, which caused fluorescence quenching in the absence of PFOS. However, anion and neutral surfactants improved the fluorescence intensity of the material due to a negative charge or neutral nature. To verify the change in the surface property, UCNPs@COFs were separated from the solutions containing SDBS, CHAPS, or CPB, respectively, and their contact angles were analyzed. The results revealed that the contact angle increased from 80.60° for initial UCNPs@COFs to 115.89° for SDBS-treated UNCPs@COFs and 95.93° for CPB-treated UNCPs@COFs (Figure S6). After being treated with CHAPS, UNCPs@COFs exhibited a smaller contact angle (61.90°) due to the neutral nature.
According to the above results, the effect of the concentration of SDBS on the sensing sensitivity was further demonstrated by investigating the fluorescence quenching of UCNPs@COFs caused by the same concentration of PFOS in the presence of different concentrations of SDBS. From the results (Figure 2d), we found that the fluorescence intensity difference F0 – F reached the maximum when the concentration of SDBS was 5 mM. To improve the fluorescence response of UCNPs@COFs to PFOS, 5 mM of SDBS was added to the sensing system in the subsequent experiments.
Quenching Mechanism
Our experimental results indicated that the fluorescence emission intensity of UCNPs@COFs greatly decreased at 550 nm in the presence of PFOS at an excitation wavelength of 980 nm. The aperture size of COFs is ∼1.8 nm as estimated from the crystallographic data.41 Molecules with sizes below 1.2 nm could easily enter the ordered pores of UCNPs@COFs.35 Thus, one reasonable explanation of the quenching mechanism was that the layer of COFs on the surface of UCNPs@COFs could enrich more PFOS, which could lead to fluorescence quenching, due to the sulfonate groups and the perfluoroalkyl chain of PFOS, as they can combine with the amino groups and hydrogens on the benzene ring of the COFs through hydrogen bond or electrostatic interactions.1,12 Besides, the sensitized fluorescence quenching effect might be attributed to the SDBS adsorbed on the pores of UCNPs@COFs, which could induce more PFOS to enter the pores due to the hydrogen bonding interaction between perfluoroalkyl and dodecyl groups.14,42 In addition, collisional quenching of fluorescence can be described by the Stern–Volmer equation, and the plots of F0/F vs the concentration of the quencher are expected to be linear. Herein, linear Stern–Volmer plots and the absence of fluorescence spectra shifts suggested that the fluorescence quenching might be a dynamic process (Figure S7). Static and dynamic quenching can also be distinguished by their differing dependence on temperature, viscosity, or lifetime measurements. Higher temperatures result in faster diffusion and hence larger amounts of collisional quenching. According to our experimental results, the change in the slope of the Stern–Volmer plots with the increasing temperature confirmed our speculation effectively (Figure S7).
Sensitivity and Selectivity of the Sensor
As proof of the proposed strategy, fluorescence quenching of UCNPs@COFs was measured upon the addition of different concentrations of the PFOS solution. When the PFOS concentration was changed in the range of 1.8 × 10⁻¹³–1.8 × 10⁻⁸ M, the fluorescent intensity changes in UCNPs@COFs were collected (Figure 3a). We could observe that the fluorescence emission of UCNPs@COFs was quenched with the increase in the concentration of PFOS. It is worthy to note that trace PFOS even at a low concentration of 0.18 pM could cause fluorescence quenching, illustrating that UCNPs@COFs was ultrasensitive to trace PFOS. Plots of F0 – F vs log[PFOS] demonstrated a good linear correlation over the concentration range from 1.8 × 10⁻¹³ to 1.8 × 10⁻⁸ M for PFOS (R2 = 0.99959, Figure 3b). The limit of detection for PFOS, at a signal-to-noise ratio of 3, is 0.15 pM, which is far lower than the most recent United States Environmental Protection Agency Provisional Health Advisory values (1.3 × 10⁻¹⁰ M of PFOS for drinking water).43 Moreover, the result is compared to that obtained by LC–MS and is lowest among the reported results by other sensors (Table 1).
Figure 3.

(a) Fluorescence intensity response of UCNPs@COFs (dispersed in DMF) to different amounts of PFOS. (b) Plot of F0 – F vs log[PFOS] (F0 and F are the fluorescence intensities of UCNPs@COFs at 550 nm in the absence and presence of PFOS, respectively).
Table 1. Comparison with Other Methods for PFOS Detection.
To verify the selectivity of the present sensor, the fluorescence response of UCNPs@COFs to six structural analogues of PFOS was also evaluated. As shown in Figure 4, the results showed that PFOS induced the strongest fluorescence quenching (F0 – F), although the same concentration (1.8 × 10⁻⁸ M) was adopted for these compounds. Thus, UCNPs@COFs were highly selective toward PFOS over the other six perfluorinated compounds. We speculated that both the perfluorinated carbon chain and sulfonic acid groups synergistically caused the fluorescence quenching of UCNPs@COFs in the presence of SDBS. Thus, the fluorescence quenching degree was enhanced with the increase in the carbon chain of these compounds (perfluorohexanoic acid (PFHxA), perfluoroheptanoic acid (PFHpA), perfluorooctanoic acid (PFOA), perfluorononanoic acid (PFNA), and perfluorodecanoic acid (PFDA)) containing carboxyl groups. Furthermore, the apparent difference of fluorescence quenching between perfluorohexanesulfonic acid potassium (PFHxS) and PFHxA suggested that sulfonic acid played an important role in quenching. These results suggested that UCNPs@COFs could act as highly efficient potential fluorescent sensors for PFOS with excellent selectivity.
Figure 4.
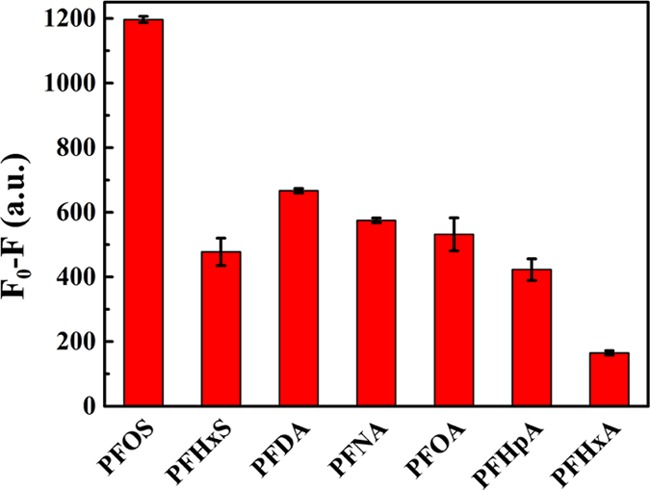
Selectivity of the sensing platform.
Detection of PFOS in Real Samples
The applicability of the elaborated method was validated by sensing PFOS in water and food packing samples. To examine the recovery, tap water and food packing samples were spiked with PFOS at three concentration levels; the recoveries were in the range from 106 to 108% (Table 2) for tap water samples. The repeatability was obtained by three replicate analysis of the spiked solution, with recoveries in the range of 103–104% for food packing samples and RSDs ranging from 2.7 to 4.0% (Table 3). The concentrations of PFOS in the spiked tap water and food packing samples obtained by the present sensing platform were compatible with those of spiked PFOS. These results showed that the present method had great potential for sensing PFOS in water and food packing materials.
Table 2. Recovery of PFOS-Spiked Tap Water Samples Using the Proposed Method.
| sample | test number | PFOS added (M) | PFOS founda (M) | recovery (%) |
|---|---|---|---|---|
| tap water | 1 | 1.80 × 10⁻⁸ | (1.90 ± 0.01) × 10–8 | 108 ± 1 |
| 2 | 1.80 × 10⁻¹⁰ | (1.90 ± 0.01) × 10–10 | 106 ± 1 | |
| 3 | 1.80 × 10⁻¹² | (1.90 ± 0.03) × 10–12 | 106 ± 2 |
Average of three measurements.
Table 3. Recovery of PFOS-Spiked Food Packing Samples Using the Proposed Method.
| sample | test number | PFOS added (M) | founda (M) | recovery (%) |
|---|---|---|---|---|
| water bottle | 1 | 1.80 × 10⁻⁸ | (1.86 ± 0.01) × 10–8 | 103 ± 4.00 |
| 2 | 1.80 × 10⁻⁹ | (1.88 ± 0.01) × 10–9 | 104 ± 2.70 | |
| 3 | 1.80 × 10⁻¹⁰ | (1.86 ± 0.01) × 10–10 | 103 ± 3.30 |
Average of three measurements.
Method Validation
To testify the accuracy of our method, the same real samples were also analyzed by the LC–MS/MS technique. The linear correlation with the PFOS concentration range of 3.6 × 10⁻¹⁰–1.8 × 10⁻⁸ M was developed. The equation was y = 8.05052 + 67.3301x (R2 = 0.996). The result of the spike-recovery test by LC–MS/MS is shown in Table S1; the recoveries were 116% for the tap water sample and 133% for the food packing sample for the same concentration (1.8 × 10⁻¹⁰ M). The results show the reliability of our proposed assay for the detection of PFOS.
Conclusions
In summary, a novel ultrasensitive fluorescence platform based on surfactant-sensitized nanoparticles UCNPs@COFs was constructed and applied to sense ultra-trace PFOS in water and food packing materials. The core–shell nanoparticles UCNPs@COFs were synthesized via the growth of COFs on the surface of UCNPs. The fluorescence response of UCNPs@COFs to PFOS could be significantly enhanced by anion surfactants. From the quenching mechanism, it was deduced that the layer of COFs enriched more PFOS molecules into its pore channel in the presence of SDBS, and the highly electronegative PFOS caused the fluorescence quenching of UCNPs@COFs. Compared with previous reports, the proposed method has the lowest limit of detection for PFOS. The excellent selectivity and sensitivity coupled with facile preparation and high stability make the present sensing platform an ideal candidate for sensing ultra-trace PFOS in the future.
Experimental Section
Chemicals and Materials
Y(CH3COO)3·4H2O (99.9%) and sodium dodecylsulfate (SDS) were obtained from Sigma-Aldrich (St. Louis). Yb (CH3COO)3·4H2O (99.9%), Er (CH3COO)3·xH2O (99.9%), perfluorodecanoic acid (PFDA, 97%), perfluorononanoic acid (PFNA, 97%), and perfluoroheptanoic acid (PFHpA, 98%) were purchased from Alfa Aesar Co. Ltd. (Massachusetts). Perfluorohexanoic acid (PFHxA, 98%) was offered by Aladdin Bio-Chem Technology Co. (Shanghai, China). Perfluorooctane sulfonate potassium (PFOS) was purchased from Martix Scientific Trade Co. (Cairo, Egypt). Oleic acid (OA, 90%), 1-octadecene (ODE, 90%), tetraethyl orthosilicate (TEOS, 98%), 3-aminopropyltriethoxysilane (APS, 97%), and perfluorohexanesulfonic acid potassium (PFHxS, 98%) were obtained from J&K Chemical (Beijing, China). Triton X-100 was purchased from GFCO Chemical (Hongkong, China). Ethanol (95%), methanol (99.5%), dichloromethane (DCM), acetonitrile, and ammonia solution (25%) were supplied by North Tianyi Chemical Reagent Factory (Tianjin, China). Cyclohexane (95%) and N,N-dimethylformamide (DMF) were bought from Jindongtianzheng Precision Chemical (Tianjin, China). Hexadecyl trimethyl ammonium bromide (CTAB) was offered by Biotopped Technology Co. (Beijing, China). Sodium dodecyl benzene sulfonate (SDBS) was obtained from BaiShi Chemical Industry Co. Ltd. (Tianjin, China). 1,4-Phenylenediamine (PDA) was supplied by Fuchen Chemical Reagent Factory (Tianjin, China). 3-[(3-Cholamidopropyl) dimethylammonio] propanesulfate (CHAPS) was obtained from Amresco. 1,3,5-Triformylbenzene (TFB) and perfluorooctanoic acid (PFOA) were purchased from Fluorochem. Ltd. (Derbyshire, U.K.). Double-distilled water (18.2 MΩ·cm–1) was offered by a Water Pro purification system (Labconco, Kansas City). Other reagents were at least of analytical grade and used without any further purification. Food packing sample (plastic bottle) was bought from the local supermarket.
Characterizations
Fluorescence spectra were recorded on an F-7000 fluorescence spectrometer (Hitachi, Japan) equipped with an external 980 nm laser (2 W, continuous wave with a 2 m fiber, Beijing Viasho Technology Co.) instead of the internal excitation source. Transmission electron microscope (TEM) images were conducted on a JEOL 2010F (JEOL, Japan). Scanning electron microscopy (SEM) images were acquired on a LEO-1530VP (Zeiss, Germany). Fourier transform infrared (FT-IR) spectra (4000–400 cm–1) in KBr were collected with a Vector 22 FT-IR spectrophotometer (Bruker, Germany). Powder X-ray diffraction (PXRD) analyses were carried out on a Siemens D5005 X-ray powder diffractometer at a scanning rate of 1° min–1 in the 2θ range from 2 to 80° (Beckman coulter, Bruker). Thermogravimetry analyses (TGA) were carried out on TGA/SDTA851 (METTLER TOLEDO) by heating samples from 25 to 800 °C under N2 with a heating rate of 10 °C min–1. The quantum yield was measured using an FLS920 homeostasis/transient fluorescence spectrometer (Edinburgh Instrument, England) with a TCSPC system. Water contact angles were measured on a DSA30 contact-angle system (KRÜSS, Germany) at room temperature. Liquid chromatography–mass spectrometry/mass spectrometry (LC–MS/MS) data were determined on a Waters Acquity UCLP Quattro Premier XE MS/MS with Waters Acquity UPLC sample manager and a binary solvent manager. The suspension of UCNPs@COFs was performed in an ultrasonic bath SBL-10DT (Ningbo Xinzhi Biotechnology Co. Ltd., China; peak power of 1000 W).
Preparation of UCNPs
UCNPs were prepared according to the previous method.44 One millimolar RE (CH3COO)3 ( Y/Yb/Er 78:20:2) was injected into the solution of 6.0 mL of OA and 17.0 mL of ODE in a three-neck round-bottom flask under argon atmosphere. After the temperature was adjusted to 160 °C, the mixture was kept under vigorous stirring for 30 min to form a transparent solution. After the system was cooled to room temperature, 10.0 mL of the mixture consisting of 2.5 mM NaOH and 4.0 mM NH4F in methanol was added, and the system was kept for 30 min. Subsequently, methanol was removed from the system, and then the temperature was adjusted to 300 °C. After the system was maintained under the argon atmosphere with vigorous stirring for 1 h, UCNPs were collected via centrifugation at room temperature. Finally, the resultant was washed with ethanol three times and dried in air.
Preparation of UCNPs@NH2
Triton X-100 (0.1 mL), cyclohexane (6.0 mL), and UCNPs material (10 mM) were mixed in a round flask at room temperature. After the solution was stirred for 10 min, 80 μL of ammonia solution and 0.4 mL of Triton X-100 were injected sequentially. After the system was sealed and sonicated for 20 min, an inverse microemulsion solution was formed. Subsequently, 40 μL of TEOS and 30 μL of APS were dropped slowly into the mixture under stirring, and the system was kept at room temperature for 24 h. Finally, UCNPs@NH2 material was collected by washing with ethanol three times and dried.
Preparation of UCNPs@COFs
TFB (0.04 mM) was dissolved in 1.0 mL of UCNPs@NH2 suspension (100 mg mL–1 in dioxane) in a 25 mL two-neck round-bottle flask. Then, PDA (6.46 mg in 1.0 mL dioxane, 0.06 mM) and 18.0 μL of acetic acid were added. The system was kept at room temperature for 1 h. The mixture (denoted seed solution) was used right away in the following procedures.
TFB (0.2 mM) and PDA (0.3 mM) were added into 1.0 mL of the seed solution in a two-neck flask, where one neck was equipped with a condenser and the other neck with a stopper. Subsequently, 90 μL of acetic acid was added. Then, the temperature of the system was adjusted to 120 °C. The system was then maintained for 3 h. The precipitates were collected via centrifugation at room temperature and washed with DMF three times. Finally, the resultants were dried for 12 h under vacuum.
Sensing PFOS
A stock solution of PFOS (3.7 × 10⁻⁴ M) was prepared by dissolving a proper amount of the target in DMF, and various concentrations of the PFOS solution were obtained by serial dilution of the stock solution with DMF. For the detection of PFOS, 500 μL of UCNPs@COFs (0.02 mg·mL–1 mixed with 10 mM of SDBS in DMF) and 500 μL of PFOS solution were poured into a 5.0 mL vial. Then, the mixture was maintained for 10 min and transferred into a fluorescence quartz cuvette. The fluorescence intensity at 550 nm was recorded under excitation at 980 nm. F0 – F was used as an analytical signal, where F0 and F are the fluorescence intensity of the system in the absence and presence of the PFOS, respectively. The selectivity of the present sensor was evaluated by choosing six structural analogues (PFDA, PFNA, PFOA, PFHpA, PFHxA, and PFHxS, as shown in Table S2) of PFOS as competitors.
Quantitation of PFOS in Real Samples
Tap water and food packing (plastic bottle) samples were chosen as real samples to validate the applicability of the present approach. Tap water was collected from the lab of Tianjin University of Science and Technology and filtered through a nylon membrane (0.22 μm in diameter). The samples were spiked with different levels of PFOS and then evaporated to dryness by a rotary evaporator. Then, the residue was dissolved in DMF (20.0 mL) to obtain the samples containing different concentrations of PFOS (3.7 × 10⁻⁸, 3.7 × 10⁻¹⁰, and 3.7 × 10⁻¹² M). Finally, 500 μL of UCNPs@COFs (0.02 mg·mL–1 solution containing 10 mM of SDBS in DEMF) and 500 μL of the spiked samples were mixed, and the fluorescence intensity of the system was measured.
Food packing sample was purchased from the local supermarket. Subsequently, the plastic bottles were cut into pieces of approximately 1 cm2 with scissors. The samples (2.0 g, dry weight) were ultrasonically spiked with three different levels of PFOS and then extracted with 20.0 mL of methanol under sonication for 25 min at 25 °C. Subsequently, similar sample treatment procedures as water samples were performed.
Acknowledgments
Q.D. is grateful for the financial support provided by the Ministry of Science and Technology of China (Project No. 2016YFD0401101) and the National Natural Science Foundation of China (Project No. 21375094).
Supporting Information Available
The Supporting Information is available free of charge on the ACS Publications website at DOI: 10.1021/acsomega.9b01996.
SEM images; FT-IR spectra; effect of solvent and surfactants on the fluorescence emission of UCNPs@COFs; stability of UCNPs@COFs; contact angles; Stern–Volmer plots; method validation results; structural analogues of PFOS (PDF)
The authors declare no competing financial interest.
Supplementary Material
References
- Feng H.; Wang N.; Tran.T T. T.; Yuan L.; Li J.; Cai Q. Surface Molecular Imprinting on Dye-(NH2)-SiO2 NPs for Specific Recognition and Direct Fluorescent Quantification of Perfluorooctane Sulfonate. Sens. Actuators, B 2014, 195, 266–273. 10.1016/j.snb.2014.01.036. [DOI] [Google Scholar]
- Guo H.; Liu Y.; Ma W.; Yan L.; Li K.; Lin S. Surface Molecular Imprinting on Carbon Microspheres for Fast and Selective Adsorption of Perfluorooctane Sulfonate. J. Hazard. Mater. 2018, 348, 29–38. 10.1016/j.jhazmat.2018.01.018. [DOI] [PubMed] [Google Scholar]
- Chen W.; Zhang X.; Mamadiev M.; Wang Z. Sorption of Perfluorooctane Sulfonate and Perfluorooctanoate on Polyacrylonitrile Fiber-Derived Activated Carbon Fibers: in Comparison with Activated Carbon. RSC Adv. 2017, 7, 927–938. 10.1039/C6RA25230C. [DOI] [Google Scholar]
- Chen S.; Li A.; Zhang L.; Gong J. Molecularly Imprinted Ultrathin Graphitic Carbon Nitride Nanosheets-Based Electrochemiluminescence Sensing Probe for Sensitive Detection of Perfluorooctanoic Acid. Anal. Chim. Acta 2015, 896, 68–77. 10.1016/j.aca.2015.09.022. [DOI] [PubMed] [Google Scholar]
- Chou W. C.; Lin Z. Bayesian Evaluation of a Physiologically Based Pharmacokinetic (PBPK) Model for Perfluorooctane Sulfonate (PFOS) to Characterize the Interspecies Uncertainty Between Mice, Rats, Monkeys, and Humans: Development and Performance Verification. Environ. Int. 2019, 129, 408–422. 10.1016/j.envint.2019.03.058. [DOI] [PubMed] [Google Scholar]
- Yu Y.; Zhao C.; Yu L.; Li P.; Wang T.; Xu Y. Removal of Perfluorooctane Sulfonates from Water by a Hybrid Coagulation–Nanofiltration Process. Chem. Eng. J. 2016, 289, 7–16. 10.1016/j.cej.2015.12.048. [DOI] [Google Scholar]
- Saito K.; Uemura E.; Ishizaki A.; Kataoka H. Determination of Perfluorooctanoic Acid and Perfluorooctane Sulfonate by Automated In-Tube Solid-Phase Microextraction Coupled with Liquid Chromatography-Mass Spectrometry. Anal. Chim. Acta 2010, 658, 141–146. 10.1016/j.aca.2009.11.004. [DOI] [PubMed] [Google Scholar]
- Zacs D.; Bartkevics V. Trace Determination of Perfluorooctane Sulfonate and Perfluorooctanoic Acid in Environmental Samples (Surface Water, Wastewater, Biota, Sediments, and Sewage Sludge) Using Liquid Chromatography-Orbitrap Mass Spectrometry. J. Chromatogr. A 2016, 1473, 109–121. 10.1016/j.chroma.2016.10.060. [DOI] [PubMed] [Google Scholar]
- Poothong S.; Boontanon S. K.; Boontanon N. Determination of Perfluorooctane Sulfonate and Perfluorooctanoic Acid in Food Packaging Using Liquid Chromatography Coupled with Tandem Mass Spectrometry. J. Hazard. Mater. 2012, 205-206, 139–143. 10.1016/j.jhazmat.2011.12.050. [DOI] [PubMed] [Google Scholar]
- Yang S.; Li Y.; Wang S.; Wang M.; Chu M.; Xia B. Advances in the Use of Carbonaceous Materials for the Electrochemical Determination of Persistent Organic Pollutants. Microchim. Acta 2018, 185, 112. 10.1007/s00604-017-2638-9. [DOI] [PubMed] [Google Scholar]
- Tran.T T. T.; Li J.; Feng H.; Cai J.; Yuan L.; Wang N.; Cai Q. Molecularly Imprinted Polymer Modified TiO2 Nanotube Arrays for Photoelectrochemical Determination of Perfluorooctane Sulfonate (PFOS). Sens. Actuators, B 2014, 190, 745–751. 10.1016/j.snb.2013.09.048. [DOI] [Google Scholar]
- Jiao Z.; Li J.; Mo L.; Liang L.; Fan H. A Molecularly Imprinted Chitosan Doped with Carbon Quantum Dots for Fluorometric Determination of Perfluorooctane Sulfonate. Microchim. Acta 2018, 185, 473. 10.1007/s00604-018-2996-y. [DOI] [PubMed] [Google Scholar]
- Chen Q.; Zhu P.; Xiong J.; Gao L.; Tan K. A Sensitive and Selective Triple-Channel Optical Assay Based on Red-Emissive Carbon Dots for the Determination of PFOS. Microchem. J. 2019, 145, 388–396. 10.1016/j.microc.2018.11.003. [DOI] [Google Scholar]
- Cheng Z.; Du L.; Zhu P.; Chen Q.; Tan K. An Erythrosin B-Based “Turn On” Fluorescent Sensor for Detecting Perfluorooctane Sulfonate and Perfluorooctanoic Acid in Environmental Water Samples. Spectrochim. Acta, Part A 2018, 201, 281–287. 10.1016/j.saa.2018.05.013. [DOI] [PubMed] [Google Scholar]
- Cheng Z.; Dong H.; Liang J.; Zhang F.; Chen X.; Du L.; Tan K. Highly Selective Fluorescent Visual Detection of Perfluorooctane Sulfonate via Blue Fluorescent Carbon Dots and Berberine Chloride Hydrate. Spectrochim. Acta, Part A 2019, 207, 262–269. 10.1016/j.saa.2018.09.028. [DOI] [PubMed] [Google Scholar]
- Benford D.; de Boer J.; Carere A.; di Domenico A.; Johansson N.; Schrenk D.; Schoeters G.; de Voogt P.; Dellatte E. Perfluorooctane Sulfonate (PFOS), Perfluorooctanoic Acid (PFOA) and Their Salts Scientific Opinion of the Panel on Contaminants in the Food Chain. EFSA J. 2008, 6, 653 10.2903/j.efsa.2008.653. [DOI] [PMC free article] [PubMed] [Google Scholar]
- Ochoa-Herrera V.; Sierra-Alvarez R.; Somogyi A.; Jacobsen N. E.; Wysocki V. H.; Field J. A. Reductive Delfluorination of Perfluorooctane Sulfonare. Environ. Sci. Technol. 2008, 42, 3260–3264. 10.1021/es702842q. [DOI] [PubMed] [Google Scholar]
- Wang W.; Li H.; Yin M.; Wang K.; Deng Q.; Wang S.; Zhang Y. Highly Selective and Sensitive Sensing of 2,4,6-trinitrophenol in Beverages Based on Guanidine Functionalized Upconversion Fluorescent Nanoparticles. Sens. Actuators, B 2018, 255, 1422–1429. 10.1016/j.snb.2017.08.143. [DOI] [Google Scholar]
- Lv J.; Zhao S.; Wu S.; Wang Z. Upconversion Nanoparticles Grafted Molybdenum Disulfide Nanosheets Platform for Microcystin-LR Sensing. Biosens. Bioelectron. 2017, 90, 203–209. 10.1016/j.bios.2016.09.110. [DOI] [PubMed] [Google Scholar]
- Sheng W.; Shi Y.; Ma J.; Wang L.; Zhang B.; Chang Q.; Duan W.; Wang S. Highly Sensitive Atrazine Fluorescence Immunoassay by Using Magnetic Separation and Upconversion Nanoparticles as Labels. Microchim. Acta 2019, 186, 564. 10.1007/s00604-019-3667-3. [DOI] [PubMed] [Google Scholar]
- Zhang T.; Ying D.; Qi M.; Li X.; Fu L.; Sun X.; Wang L.; Zhou Y. Anti-Biofilm Property of Bioactive Upconversion Nanocomposites Containing Chlorin e6 against Periodontal Pathogens. Molecules 2019, 24, 2692 10.3390/molecules24152692. [DOI] [PMC free article] [PubMed] [Google Scholar]
- Chien H.; Wu C.; Yang C.; Wang T. Multiple Doping Effect of LiYF4:Yb3+/Er3+/Ho3+/Tm3+@LiYF4:Yb3+ Core/Shell Nanoparticles and Its Application in Hg2+ Sensing Detection. J. Alloys Compd. 2019, 806, 272–282. 10.1016/j.jallcom.2019.07.258. [DOI] [Google Scholar]
- Liu X.; Ren J.; Su L.; Gao X.; Tang Y.; Ma T.; Zhu L.; Li J. Novel Hybrid Probe Based on Double Recognition of Aptamer-Molecularly Imprinted Polymer Grafted on Upconversion Nanoparticles for Enrofloxacin Sensing. Biosens. Bioelectron. 2017, 87, 203–208. 10.1016/j.bios.2016.08.051. [DOI] [PubMed] [Google Scholar]
- Guo T.; Deng Q.; Fang G.; Yun Y.; Hu Y.; Wang S. A Double Responsive Smart Upconversion Fluorescence Sensing Material for Glycoprotein. Biosens. Bioelectron. 2016, 85, 596–602. 10.1016/j.bios.2016.05.056. [DOI] [PubMed] [Google Scholar]
- Yin M.; Li Z.; Ju E.; Wang Z.; Dong K.; Ren J.; Qu X. Multifunctional Upconverting Nanoparticles for Near-Infrared Triggered and Synergistic Antibacterial Resistance Therapy. Chem. Commun. 2014, 50, 10488–10490. 10.1039/C4CC04584J. [DOI] [PubMed] [Google Scholar]
- Guan X.; Ma Y.; Li H.; Yusran Y.; Xue M.; Fang Q.; Yan Y.; Valtchev V.; Qiu S. Fast, Ambient Temperature and Pressure Ionothermal Synthesis of Three-Dimensional Covalent Organic Frameworks. J. Am. Chem. Soc. 2018, 140, 4494–4498. 10.1021/jacs.8b01320. [DOI] [PubMed] [Google Scholar]
- Chen L.; He L.; Ma F.; Liu W.; Wang Y.; Silver M. A.; Chen L.; Zhu L.; Gui D.; Diwu J.; Chai Z.; Wang S. Covalent Organic Framework Functionalized with 8-Hydroxyquinoline as a Dual-Mode Fluorescent and Colorimetric pH Sensor. ACS. Appl. Mater. Interfaces 2018, 10, 15364–15368. 10.1021/acsami.8b05484. [DOI] [PubMed] [Google Scholar]
- Sun Q.; Aguila B.; Perman J.; Earl L. D.; Abney C. W.; Cheng Y.; Wei H.; Nguyen N.; Wojtas L.; Ma S. Postsynthetically Modified Covalent Organic Frameworks for Efficient and Effective Mercury Removal. J. Am. Chem. Soc. 2017, 139, 2786–2793. 10.1021/jacs.6b12885. [DOI] [PubMed] [Google Scholar]
- Zhang K.; Cai S.; Yan Y.; He Z.; Lin H.; Huang X.; Zheng S.; Fan J.; Zhang W. Construction of a Hydrazone-Linked Chiral Covalent Organic Framework-Silica Composite as the Stationary Phase for High Performance Liquid Chromatography. J. Chromatogr. A 2017, 1519, 100–109. 10.1016/j.chroma.2017.09.007. [DOI] [PubMed] [Google Scholar]
- Wu M.; Yang Y. Applications of Covalent Organic Frameworks (COFs): From Gas Storage and Separation to Drug Delivery. Chin. Chem. Lett. 2017, 28, 1135–1143. 10.1016/j.cclet.2017.03.026. [DOI] [Google Scholar]
- Fan H.; Gu J.; Meng H.; Alexander K.; Jürgen C. High-Flux Membranes Based on the Covalent Organic Framework COF-LZU1 for Selective Dye Separation by Nanofiltration. Angew. Chem., Int. Ed. 2018, 57, 4083–4087. 10.1002/anie.201712816. [DOI] [PubMed] [Google Scholar]
- Fang Q.; Wang J.; Gu S.; Kaspar R. B.; Zhuang Z.; Zheng J.; Guo H.; Qiu S.; Yan Y. 3D Porous Crystalline Polyimide Covalent Organic Frameworks for Drug Delivery. J. Am. Chem. Soc. 2015, 137, 8352–8355. 10.1021/jacs.5b04147. [DOI] [PubMed] [Google Scholar]
- Bai L.; Phua S. Z. F.; Lim W. Q.; Jana A.; Luo Z.; Tham H. P.; Zhao L.; Guo Q.; Zhao Y. Nanoscale Covalent Organic Frameworks as Smart Carriers for Drug Delivery. Chem. Commun. 2016, 52, 4128–4131. 10.1039/C6CC00853D. [DOI] [PubMed] [Google Scholar]
- Palo E.; Tuomisto M.; Hyppänen I.; Swart H. C.; Hölsä J.; Soukka T.; Lastusaari M. Highly Uniform Up-Converting Nanoparticles: Why You Should Control Your Synthesis Even More. J. Lumin. 2017, 185, 125–131. 10.1016/j.jlumin.2016.12.051. [DOI] [Google Scholar]
- Fan H.; Gu J.; Meng H.; Knebel A.; Caro J. High-Flux Imine-Linked Covalent Organic Framework COF-LZU1 Membranes on Tubular Alumina Supports for Highly Selective Dye Separation by Nanofiltration. Angew. Chem. Int. Ed. 2017, 57, 4083–4087. 10.1002/anie.201712816. [DOI] [PubMed] [Google Scholar]
- Chen G.; Qiu H.; Prasad; Paras N.; Chen X. Upconversion Nanoparticles: Design, Nanochemistry, and Applications in Theranostics. Chem. Rev. 2014, 114, 5161–5214. 10.1021/cr400425h. [DOI] [PMC free article] [PubMed] [Google Scholar]
- Zhou J.; Liu Q.; Feng W.; Sun Y.; Li F. Upconversion Luminescent Materials: Advances and Applications. Chem. Rev. 2015, 115, 395–465. 10.1021/cr400478f. [DOI] [PubMed] [Google Scholar]
- Xue R.; Guo H.; Wang T.; Gong L.; Wang Y.; Ai J.; Huang D.; Chen H.; Yang W. Fluorescence Properties and Analytical Applications of Covalent Organic Frameworks. Anal. Methods 2017, 9, 3737–3750. 10.1039/C7AY01261F. [DOI] [Google Scholar]
- Zhang Y.; Zhang D.; Liu H. Luminescent Molecularly Imprinted Polymers Based on Covalent Organic Frameworks and Quantum Dots with Strong Optical Response to Quinoxaline-2-Carboxylicacid. Polymers 2019, 11, 708. 10.3390/polym11040708. [DOI] [PMC free article] [PubMed] [Google Scholar]
- Motoyuki I.; Takaya T.; Momoko K.; Junichi T. Complex of Polyethyleneimine and Anionic Surfactant with Functional Chain: a Versatile Surface Modifier Applicable to Various Particles, Solvents, and Surface Modification Processes. Colloids Surf., A 2018, 545, 110–116. 10.1016/j.colsurfa.2018.02.050. [DOI] [Google Scholar]
- Peng Y.; Wong W. K.; Hu Z.; Cheng Y.; Yuan D.; Khan S. A.; Zhao D. Room Temperature Batch and Continuous Flow Synthesis of Water-stable Covalent Organic Frameworks (COFs). Chem. Mater. 2016, 28, 5095–5101. 10.1021/acs.chemmater.6b01954. [DOI] [Google Scholar]
- Pan G.; Jia C.; Zhao D.; You C.; Chen H.; Jiang G. Effect of Cationic and Anionic Surfactants on the Sorption and Desorption of Perfluorooctane Sulfonate (PFOS) on Natural Sediments. Environ. Pollut. 2009, 157, 325–330. 10.1016/j.envpol.2008.06.035. [DOI] [PubMed] [Google Scholar]
- Park S.; Zenobio J. E.; Lee L. S. Perfluorooctane Sulfonate (PFOS) Removal with Pd(0)/nFe(0) Nanoparticles: Adsorption or Aqueous Fe-complexation, Not Transformation?. J. Hazard. Mater. 2018, 342, 20–28. 10.1016/j.jhazmat.2017.08.001. [DOI] [PubMed] [Google Scholar]
- Yin M.; Wu C.; Li H.; Jia Z.; Deng Q.; Wang S.; Zhang Y. Simultaneous Sensing of Seven Pathogenic Bacteria by Guanidine-Functionalized Upconversion Fluorescent Nanoparticles. ACS Omega 2019, 4, 8953–8959. 10.1021/acsomega.9b00775. [DOI] [PMC free article] [PubMed] [Google Scholar]
Associated Data
This section collects any data citations, data availability statements, or supplementary materials included in this article.