Abstract
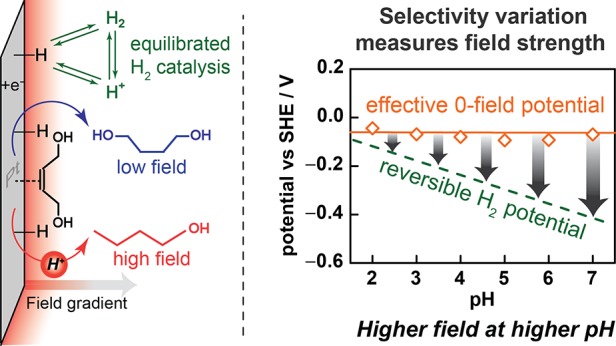
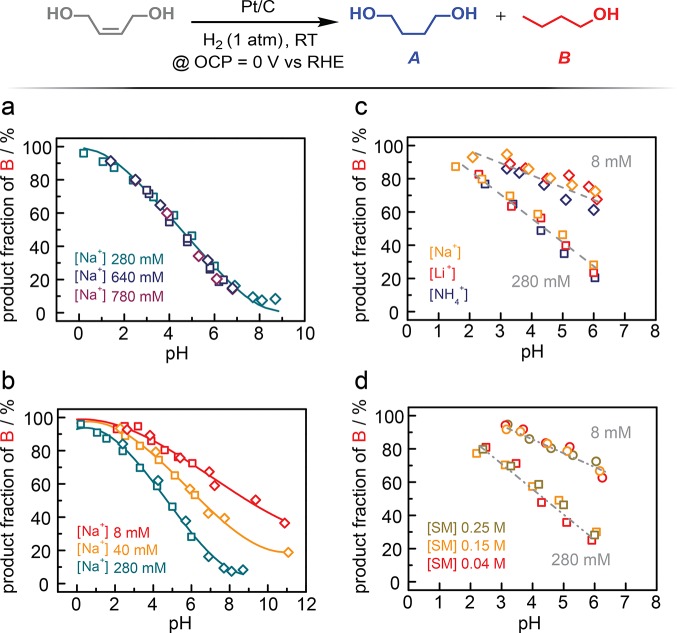
We quantify changes in the magnitude of the interfacial electric field under the conditions of H2/H+ catalysis at a Pt surface. We track the product distribution of a local pH-sensitive, surface-catalyzed nonfaradaic reaction, H2 addition to cis-2-butene-1,4-diol to form n-butanol and 1,4-butanediol, to quantify the concentration of solvated H+ at a Pt surface that is constantly held at the reversible hydrogen electrode potential. By tracking the surface H+ concentration across a wide range of pH and ionic strengths, we directly quantify the magnitude of the electrostatic potential drop at the Pt/solution interface and establish that it increases by ∼60 mV per unit increase in pH. These results provide direct insight into the electric field environment at the Pt surface and highlight the dramatically amplified field existent under alkaline vs acidic conditions.
Introduction
The efficient interconversion of electrical and chemical energy requires control over inner-sphere bond activation and electron-transfer reactions taking place at electrode surfaces. Unlike outer-sphere electron-transfer reactions, inner-sphere reactions require bonding between the substrate and the surface, and thus, the local environment within molecular length scales of the surface defines the reaction profile. This local environment is radically different from the environment in the bulk of the electrolyte because the polarization of the electrode surface generates a sharp electrostatic potential gradient that corresponds to an electric field in the range of 109 V m–1.1−4 At a qualitative level, these fields are known to order the solvent, orient dipolar species, and accumulate ions, all of which serve to dramatically augment the free energy landscape for inner-sphere electrocatalysis.5−8 As a poignant example, it has long been recognized that Pt electrodes are ∼100-fold less active for H2 evolution catalysis in alkaline than acidic media,9−16 and a recent study attributed this to an increased interfacial field strength in alkaline media that serves to slow proton transfer to the surface.9,17,18 Clearly, a quantitative understanding of the interfacial field environment under reaction conditions is essential for understanding reactivity trends, and for the rational design of new catalysts and electrochemical transformations.
The interfacial field is equal to the gradient of the electrostatic potential at the interface. Importantly, the electrostatic potential (Volta potential) of an electrode results purely from the free charge separation existing at the interface, and is fundamentally distinct from the electrode (electrochemical) potential, E, which is readily measured relative to a reference redox couple.1−3 Indeed, E is the sum of the contributions from the intrinsic energy of electrons in the solid (chemical and dipole potentials) and the electrostatic contribution from charging the surface. The former is related to the work function of the solid and is augmented upon adsorption of species from solution, which can introduce additional dipole contributions. The latter electrostatic potential (Volta potential), φ, determines the magnitude of the interfacial electric field, resulting from the presence of solvated ions, free charge, in the double layer.3 Throughout this article, we will refer to the electrostatic potential explicitly and all other uses of the word potential will take the common meaning of electrochemical potential.
Because of this key distinction, quantifying the magnitude of the interfacial field is challenging and requires a technique that decouples the free charging behavior of the interface from the surface adsorption reactions that give rise to catalysis.19−21 This is particularly true for catalytically active metals like Pt, which strongly adsorb ions over a wide potential window. This decoupling can be achieved by employed interface specific spectroscopies such as sum frequency generation (SFG)5,22−26 or ambient pressure X-ray photoelectron spectroscopy (APXPS)27 in conjunction with molecular reporters (Figure 1a, left). However, these methods have, thus far, been predominantly limited to studies of relatively inert metals such as Au or Ag. Alternatively, as an electrometric approach, laser-induced temperature-jump techniques can be used to determine the potential at which the entropy of the solvent is maximized (Figure 1a, right).28−30 This potential of maximum entropy closely approximates the potential of zero free charge, EPZFC, at which the interfacial electrostatic potential is zero and the electric field vanishes.19 If the population and orientation of surface adsorbates remain unchanged across a given range of potentials, the electrostatic potential, φ, at the interface can be accurately gauged by the difference between the E and EPZFC. Unfortunately, for highly active materials such as Pt, the adsorbate population under relevant catalytic conditions is often dramatically different than that present under the inert conditions used to measure EPZFC. Consequently, measurements of EPZFC do not necessarily provide direct insight into the electrostatic potential drop and corresponding interfacial field under the conditions of catalysis. This knowledge gap has impeded quantitative understanding of the electric field environment under which electrocatalytic reactions take place.
Figure 1.
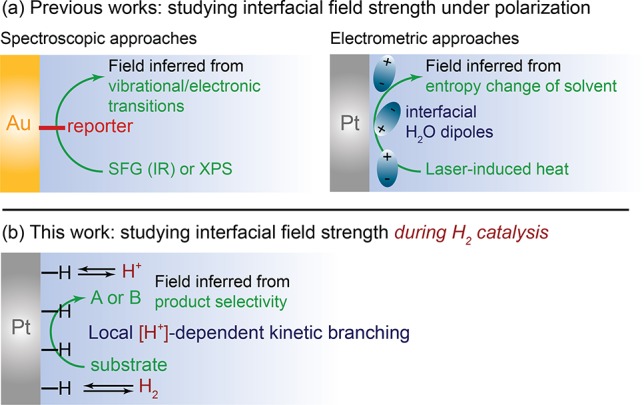
(a) Previous spectroscopic (left) and electrometric (right) approaches to investigate interfacial field strengths. (b) This work investigates the field strength in operando under the conditions of hydrogen catalysis using a surface-specific nonfaradaic reaction.
Herein, we provide quantitative insights into the magnitude of the interfacial field under the conditions of electrocatalysis. Since catalytic reactions entail electrosorption steps, direct estimation of the field strength under catalytic conditions requires a strategy for decoupling faradaic electrosorption events from the free charging behavior of the electrode that establishes the strength of the interfacial field. We show that this decoupling can be achieved by employing a nonfaradaic reaction probe, hydrogenation/hydrogenolysis of cis-2-butene-1,4-diol, whose selectivity is uniquely sensitive to the concentration of protons (solvated H+) at the interface. We use this sensitivity to quantify the extent of H+ migration as a reporter of the magnitude of the interfacial field strength. Using this approach, we track the interfacial field strength as a function of pH under the conditions of H2/H+ catalysis at a Pt surface. Conveniently, the presence of H2 (1 atm) and the reversible catalytic activity of Pt serve to pin the electrode to ∼0 V vs the reversible hydrogen electrode (RHE) even in the complete absence of net faradaic charge flow. Combining these elements, we show that the magnitude of the electrostatic potential drop at the Pt interface increases by ∼60 mV with each unit increase in pH. This direct quantification establishes the amplified field environment attendant to H2/H+ catalysis in alkaline vs acid media.
Results and Discussion
pH and Ionic Strength Dependence of the Probe Reaction at the Reversible Hydrogen Potential
We exploited the Pt/C-catalyzed reaction of H2 with cis-2-butene-1,4-diol as a sensitive nonfaradaic reaction probe of the environment at the Pt surface (see Supporting Information for experimental details). Pt catalyzes hydrogenation and hydrogenoloysis of this substrate to 1,4-butanediol (A) and n-butanol (B), respectively. We first examined the product selectivity at ∼30% of total conversion as a function of bulk pH in the presence of high ionic strength electrolytes (Figure 2a). For these experiments, the concentration of Na+ is fixed for each buffer employed and the pH was varied by the addition of HClO4. For a Na+ concentration of 280 mM, corresponding to an ionic strength (I) of 0.4 M (Figure S1), irrespective of whether we employed a citrate (Figure 2a, green square) or phosphate buffer (Figure 2a, green diamond), we observed overlaying data that evinces a systematic increase in B fraction (B/(A + B) in %) as the pH is lowered. We note that A and B are the only products detected in all reaction conditions explored and that the B fraction (%) is simply 100 – A fraction (%) by definition. We observe that the B fraction increases linearly from ∼15% to ∼90% as the pH decreases from ∼7 to ∼1 and the dependence tails toward 100 and 0% at below pH 1 and above pH 7, respectively (Figure 2a). The overlay of the data for citrate and phosphate buffers indicates that this pH dependence in product selectivity is negligibly convoluted by specific interactions with the buffer proton donor or corresponding conjugated base anion. Importantly, increasing the electrolyte strength to a Na+ concentration of 0.64 (I = ∼0.8 M) or 0.78 M (I = ∼1.0 M) with added NaClO4 supporting electrolyte (Figure 2a, blue and purple) leads to no change in the pH scaling in product selectivity.31 Together these data indicate that (a) the selectivity of the probe reaction is highly sensitive to the pH of the electrolyte and that (b) this pH dependence is insensitive to the ionic strength of the electrolyte beyond 0.4 M ionic strength.
Figure 2.
Product fraction of n-butanol, B (in %), at approximately 30% total conversion for Pt/C-catalyzed H2 addition to cis-2-butene-1,4-diol as a function of electrolyte conditions. (a) pH dependence of B fraction under high ionic strength (I) conditions in the presence of 280 (green, I = 0.4 M), 640 (blue, I = 0.8 M), and 780 mM Na+ (purple, I = 1.0 M). (b) pH dependence of B fraction under low ionic strength conditions in the presence of 40 (orange, I = 0.05 M) and 8 mM Na+ (red, I = 0.01 M). For panels (a) and (b), data were collected in the presence of citrate (square) and phosphate (diamond) counteranions. (c) pH dependence of B fraction with varying cation species, Na+ (orange), Li+ (red), and NH4+ (blue) with 280 (square, I = 0.4 M) and 8 mM (diamond, I = 0.01 M) of each cation. (d) pH dependence of B fraction with varying substrate (SM = starting material) concentrations, 0.25 (green), 0.15 (orange), and 0.04 M (red), under varying ionic strength electrolytes containing 280 (square, I = 0.4 M) and 8 mM Na+ (circle, I = 0.01 M). All data were collected at the open-circuit potential, ∼0 V vs RHE.
The pH dependence of product selectivity is dramatically altered as the ionic strength of the electrolyte is lowered (Figure 2b). In the presence of a dilute electrolyte with 40 mM Na+ (I = 0.05 M) (Figure 2b, orange), the B fraction at any given pH is dramatically enhanced relative to the corresponding value measured in the presence of 280 mM Na+ (Figure 2b, green). The selectivity for B increases as the electrolyte strength is further decreased to 8 mM Na+ (I = 0.01 M) (Figure 2b, red). The overall variation in product selectivity is quite dramatic, changing, at pH 7, from a B fraction of 16% at 280 mM Na+ to 62% at 8 mM Na+.
Across this series of decreasing electrolyte strengths, we also find that the pH-dependent selectivity profile is entirely independent of the identity of the buffering anions (Figure 2a,b) and their counter cations (Figure 2c). These observations allow us to exclude substantial contributions from specific adsorption of anions as well as cations at the Pt surface. Additionally, we find that the results are independent of the concentration of probe molecules (Figure 2d), suggesting that substrate adsorption is not substantially influencing the observed changes in selectivity. The negligible impact of reactant-surface interactions on H2/H+ catalysis is further substantiated by the minimal shift of the open circuit potential (OCP) value from 0 V vs RHE (<10 mV) irrespective of substrate concentration (see below). Together, these data establish that the dependence of product selectivity on bulk pH is affected solely by the ionic strength of the electrolyte with negligible convolution from other electrolyte variables.
Surface Sensitivity and Kinetics of the Probe Reaction
Kinetic analysis establishes that the probe reaction is highly sensitive to the local proton concentration (Figure 3, Figures S2–S4). With high ionic strength electrolytes (280 mM Na+, Figure 3), we found that as the pH is increased, the rate (kobs) of formation of A (blue squares) increases, whereas the rate of formation of B (red squares) declines. Despite these changes in the rate of formation of each product, the aggregate rate of product generation (gray squares) remained constant over the entire pH range examined (∼0 to 9). At low ionic strength (8 mM Na+), we found that the rate of formation of A (green circles) is suppressed at each pH relative to the high ionic strength condition (blue squares). In contrast, the rate of formation of B is enhanced at low (orange circles) vs high (red squares) ionic strength. These correlated changes in the observed rate for A and B formation give rise to the selectivity enhancement for B at low ionic strength (Figure 2b). Importantly, despite the changes in the rate of formation of A and B, the total conversion rate (black circles) remained unchanged over the entire pH range examined (∼2 to 11) and is the same as the total conversion rate at high ionic strength (gray squares). Indeed, regardless of the electrolyte strength, composition, or pH, the aggregate rate of the nonfaradaic reaction to produce A and B remains constant (Figure S5). Only the selectivity for B relative to A changes as the pH or electrolyte strength is altered. In addition, our previous mechanistic analysis31 confirmed that the Pt surface does not catalyze the conversion of A to B. Taken together, these results indicate that the reaction proceeds through the pH-independent rate-limiting formation of a common surface-bound intermediate, I*, followed by pH-dependent kinetic branching to yield A or B (Figure 4a). In line with previous literature,32 we propose that I* is a partially hydrogenated Pt–alkyl species. Brønsted and Lewis acids are known to interact with oxygen moieties in the C–O bonds of many organic substrates, thereby lowering the activation barrier for C–O cleavage.33 We expect that, in a similar way, the proton concentration buildup near the surface assists or promotes the hydrogenolysis (C–O bond cleavage) of I* that leads to the formation of B. Regardless of the precise structure of this intermediate, the fact that it is a surface-bound species ensures that this reaction is a highly localized probe of the proton population within molecular length scales of the Pt surface. Therefore, changes in product selectivity provide a measure of the variation in proton excess within the double layer.
Figure 3.
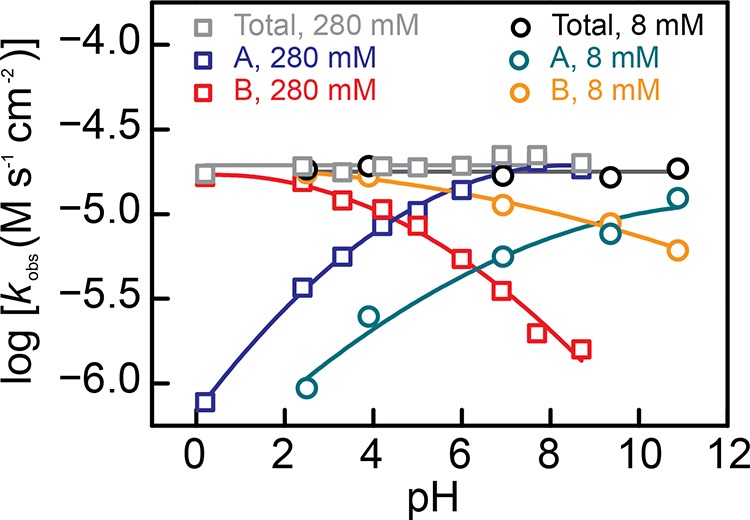
Log kobs versus pH for the rate of total conversion, 1,4-butanediol (A) formation and n-butanol formation (B). Squares correspond to data collected with high ionic strength electrolytes (I = 0.4 M) containing 280 mM Na+ (gray, blue, and red correspond to total conversion and A and B formation, respectively). Circles correspond to data collected with low ionic strength electrolytes (I = 0.01 M) containing 8 mM Na+ (black, green, and orange correspond to total conversion and A and B formation, respectively).
Figure 4.
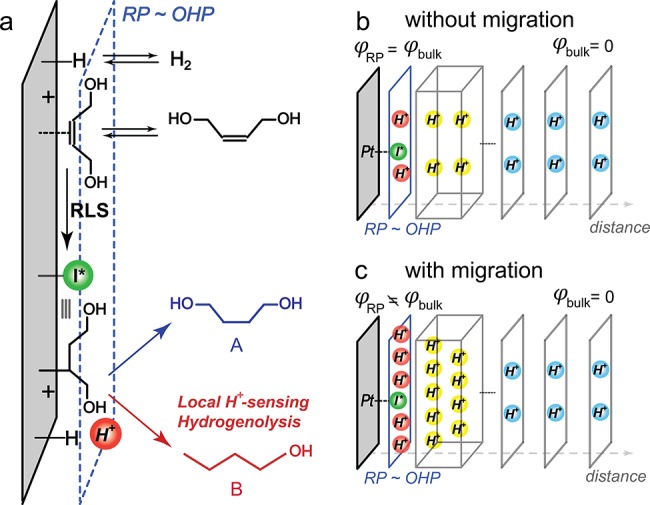
(a) Putative mechanism for Pt/C-catalyzed formation of 1,4-butanediol (A, blue) and n-butanol (B, red) (RLS stands for “rate-limiting step”). Simplified schemes depicting the H+ concentration profiles from the reaction plane (RP) (blue) to the bulk solution (gray) in the absence (b) and presence (c) of migration effects. Gray boxes indicate diffuse double layer regions. For simplicity, other free ion species in solution are omitted in these pictures and the nanoparticulate Pt surface is depicted as locally planar Pt.
Importantly, all of these measurements were conducted with the electrode held at the OCP. Despite the absence of external potential control, we find that the high reversibility of Pt for the H2/H+ couple serves to pin the OCP at 0 ± 10 mV vs RHE across all of the reaction conditions examined. Consequently, this method provides a direct probe of the local proton concentration under the conditions of hydrogen evolution reaction (HER)/hydrogen oxidation reaction (HOR) catalysis. Because of the complete absence of net current flow, we are able to uniquely probe the proton excess without convolution from net H+ production or consumption. We stress that since Pt is a reversible catalyst for the H2/H+ couple, HER and HOR are simultaneously taking place at equal and opposite rates under all conditions of our study.
Kinetic Orthogonality Between the Probe Reaction and Faradaic Hydrogen Catalysis
We stress that the probe hydrogenation/hydrogenolysis reactions at the Pt surface are nonfaradaic and kinetically orthogonal to the concurrent potential-dependent faradaic process involving H2/H+ equilibration. Several experiments (see Supporting Information for details) establish this orthogonality. First, at a fixed pH in the presence of excess supporting electrolyte, varying the applied potential from 0 to 0.25 V vs RHE led to no change in the total conversion rate of the probe reaction (Figure S6a,b). Second, in the presence of a very high buffer strength, 500 mM citrate, to suppress local pH change induced by concurrent HOR catalysis,31 varying the applied potential from 0 to 0.25 V vs RHE led to no appreciable change in product selectivity (Figure S6c). These experiments establish that the production of A and B is not coupled directly to any electrochemical surface reaction and that the formation of both is a purely nonfaradaic process. We postulate that the kinetic orthogonality arises from the known differential reactivity of electrochemically generated H bound in hollow sites and the atop H formed from dissociative adsorption of H2.34 Upon decrease of the buffer strength, the protons produced by concurrent HOR catalysis augment the local pH and lead to an increased B% (Figure S6c) while maintaining the same overall conversion rate. This further establishes that the probe reaction is sensitive to the local proton concentration but is otherwise orthogonal to the H2/H+ equilibration reactions.
The Local pH Change Estimates the Electrostatic Potential at the Reaction Plane Inside the Double Layer
Taking into account that (a) the probe reaction is sensitive to proton concentration near the Outer Helmholtz Plane (OHP) and (b) that the potential is pinned to 0 V vs RHE irrespective of varying electrolyte compositions, the observations in Figure 2a,b can be rationalized based on field-induced migration of H+ to the surface (Figure 4). For any metal/solution interface, electronic charge excess at the electrode will be counterbalanced by an opposite ionic charge excess in solution. For electrode potentials negative of EPZFC, the solution charge excess will be comprised predominantly of cations, which in this case, consist of Na+ (or Li+/NH4+) and H+, the only two cations in the medium. At high Na+ concentrations beyond 280 mM (I = 0.4 M), the electrode charge excess is fully compensated by Na+, and thus, we sample the pH dependence of reaction selectivity in the absence of proton migration (Figure 2a and Figure 4b). Importantly, upon changing the ionic strength, the potential of the electrode remains pinned at 0 vs RHE in this system and thus the charge excess in the Pt at given pH should also remain constant. As the Na+ concentration is decreased, the charge excess in the metal must be balanced, to a greater extent, by H+ ions that migrate to the surface. Therefore, the resulting proton excess leads to an increase in B fraction at a given pH as the Na+ concentration is lowered (Figure 2b and Figure 4c).
The above qualitative picture can also be elaborated mathematically. For this treatment, we define the local concentration of H+ as cH+RP at the reaction plane, RP, where pH-dependent product branching occurs (Figure 4a). This local H+ concentration is related to the H+ concentration in the bulk solution (cH+) by the Boltzmann relation,2
| 1 |
where φRP is the electrostatic potential at the RP, e is the electron charge, k is the Boltzmann constant, and T is the absolute temperature. The electrostatic potential of the uncharged bulk solution, φbulk, is zero. Taking the logarithm of eq 1 yields
| 2 |
Consistent with eqs 1 and 2, the nonzero value of φRP inside the double layer provides the driving force for migration of charged free ions to the interface. We find that increasing the Na+ concentration beyond 280 mM leads to no further change in the reaction selectivity across all reaction conditions. Thus, by eq 2, we conclude that, at sufficiently high electrolyte ionic strength, beyond 280 mM Na+, φRP approximates to zero and, consequently, pHRP is equal to pHbulk. Under these high ionic strength conditions, the electrostatic potential is effectively screened by the supporting electrolyte ions. In contrast, at low ionic strength, we do see a systematic increase in B fraction, indicating that pHRP is lower than pHbulk as a result of an increase in φRP. This mathematical treatment quantifies the relationship between changes in the pHRP and the interfacial electrostatic potential and highlights that interfacial field-induced migration of H+ is the cause of changes in selectivity of the probe reaction with decreasing ionic strength.
Although the discussion above highlights that φRP is strongly dependent on the ionic strength of the solution, eq 2 does not imply an explicit dependence of φRP on pH. If the φRP were pH-independent, the second term in eq 2 would be constant at any given ionic strength and this would simply lead to a lateral shift of the B fraction plot as the ionic strength is lowered, but no change in the slope of the pH dependence of product selectivity. This is clearly at odds with what we observe experimentally—the slope of the plot of B fraction vs pH is much shallower at low ionic strength than at high ionic strength (Figure 2b). At high ionic strength (Na+ ≥ 280 mM) the linear region of the B fraction plot displays a slope value of −14 (Figure 2b, green), whereas this slope decreases in magnitude to −10 (Figure 2b, orange) and −7 (Figure 2b, red) at 40 and 8 mM Na+, respectively. This can be explained only by an explicit pH dependence of φRP. Indeed, the change in the slope of the B fraction plot indicates that the magnitude of the electrostatic potential inside the double layer is increasing (more negative) as the pH increases at a given ionic strength.
Using the high ionic strength data as a calibration for the intrinsic pH dependence of product selectively, we estimate pHRP and ultimately φRP at reduced ionic strength. Indeed, the B fraction observed under a reduced ionic strength is also observed at a high ionic strength, but at a lower pH. Matching the B fraction difference between the low and high ionic strength curves in Figure 2a,b, therefore, provides a direct estimate of the pH at the RP and the corresponding ΔpH relative to the bulk value (Figure 5a). Consistent with the change in the slope of the B fraction plot with decreasing ionic strength, we see these ΔpH values increase (surface is more acidic than bulk) as the bulk pH increases. Using eq 2, we converted each ΔpH to a corresponding electrostatic potential at the reaction plane, φRP, as a function of the bulk pH (Figure 5b). We find that the electrostatic potential of the reaction plane shifts from −40 mV at pH 2 to −110 mV at pH 7 with the electrolytes containing 40 mM Na+ (Figure 5b, blue) and from −60 mV at pH 2 to −190 mV at pH 7 with the electrolytes containing 8 mM Na+ (Figure 5b, red). Over the entire pH range examined, the estimated φRP is more negative at lower ionic strength. Since the electrochemical potential of the metal, E, is pinned at the same value for a given pH, irrespective of ionic strength, the corresponding electrostatic potential at the metal surface, φM, also remains constant. Thus, our data are consistent with reduced electrostatic screening at the reaction plane under lower ionic strength conditions (Figure 5c). To the best of our knowledge, these values constitute the first direct measurements of the electrostatic potential inside the double layer, and its pH dependence, under the conditions of H2/H+ catalysis at a Pt electrode.
Figure 5.
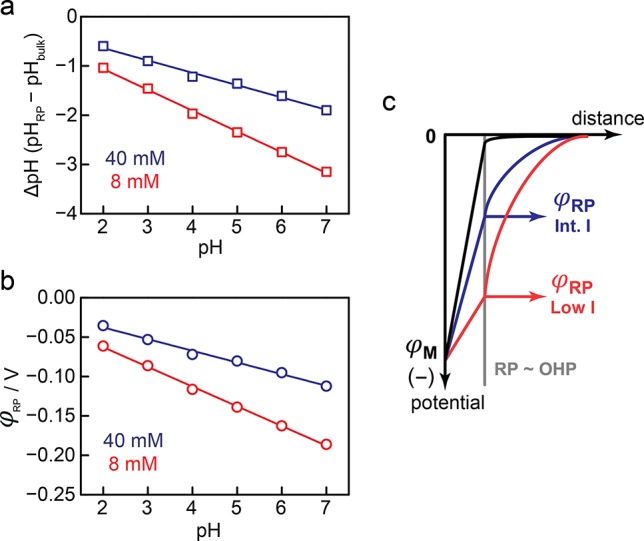
(a) ΔpH (= pHRP – pHbulk) as a function of bulk pH for data collected at 40 (blue) and 8 (red) mM Na+. Values were calculated from the data in Figure 2a,b. (b) Electrostatic potential at the reaction plane (φRP) vs bulk pH. Values were calculated using the ΔpH and eq 2. (c) Diagram of the interfacial electrostatic potential profile at very high, >280 (black), intermediate, 40 (blue), and low, 8 (red), mM Na+ concentration at fixed pH.
Estimation of the Electrostatic Potential at the Pt Surface and Its Relationship with Bulk pH
Whereas the probe reaction provides direct insight into the electrostatic potential at the reaction plane, the HER/HOR reactions on Pt electrodes take place at the surface itself. To provide insight into the electrostatic potential at the metal surface (φM), we translate φRP into φM by applying Gouy–Chapman–Stern (GCS) theory to the data obtained under the most dilute electrolyte conditions (8 mM Na+, I = 0.01 M). The electric field profile described by GCS theory is shown diagrammatically for two pH values in Figure 6a. This diagram illustrates the information extracted from Figure 5b and shows the shift in φRP to more negative values as the pH is increased. Within the framework of GCS theory, the closest point of approach of solvated ions corresponds to the OHP and our observation of a strong dependence on B fraction on solvated H+ and Na+ indicates that the RP cannot be closer to the surface than the OHP. If we assume that the RP is equal to the OHP, then φM can be simply calculated from the φRP values in Figure 5b using the following equation,2
| 3 |
where εo is the absolute permittivity, ε is the dielectric constant of aqueous solutions with low electrolyte strengths, and NA is Avogadro’s number. While this equation applies rigorously to a 1:1 symmetric electrolyte with a concentration of C, computational analysis indicates that this equation can closely approximate the behavior for the dilute asymmetric electrolytes used here.35−37 The xOHP term is the distance between the surface and the OHP (Figure 6a), which is generally estimated to be 0.5–0.7 nm based on the sum of the Stokes radii of the charge-compensating cations (H+ or Na+) and the thickness of the water layer that is adsorbed to the surface.1,2 Encouragingly, this OHP distance range matches the sum of Pt–C and one or two C–C/C–O bond lengths (0.5–0.7 nm) (see Figure 4a), suggesting that this is a reasonable estimate of the position of the reaction plane (RP). Figure 6a qualitatively illustrates a relationship between φM and φRP as described by GCS theory.
Figure 6.
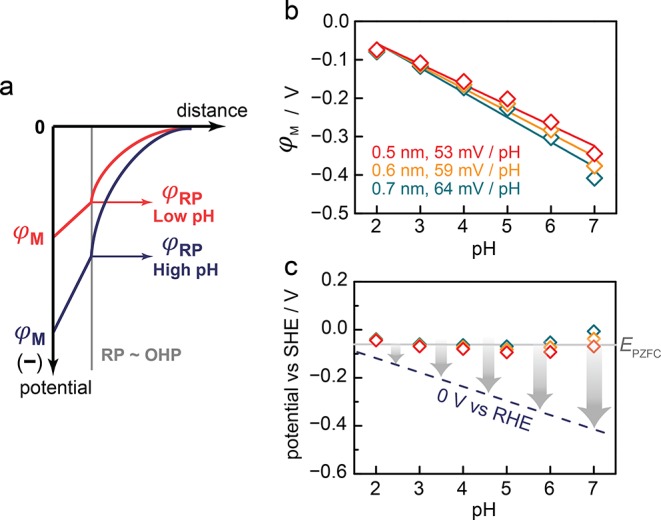
(a) Diagram of the interfacial electrostatic potential profile under low ionic strength conditions at low (red) and high (blue) pH. (b) Electrostatic potential at the Pt surface (φM) vs bulk pH, computed using the φRP in Figure 5b, red, eq 3, and varying xOHP distances of 0.5 (red), 0.6 (orange), and 0.7 (green) nm. (c) Potential vs bulk pH Pourbaix diagram showing the pH dependence of the reversible hydrogen couple (blue, dotted line) and the effective EPZFC values estimated from our analysis assuming xOHP of 0.5 (red), 0.6 (orange), and 0.7 (green) nm.
Using eq 3, we calculated φM over the entire pH range examined in this study (Figure 6b). While the magnitude of the electrostatic potential is small at pH 2, ca. −0.1 V, it systematically grows in magnitude as the pH increases, reaching a value of ca. −0.4 V at pH 7. Remarkably, the φM values exhibit a Nernstian shift (∼60 mV pH–1) over the entire pH range examined (Figure 6b). Changing xOHP from 0.5 to 0.7 nm leads to small changes in the slope from 53 to 64 mV pH–1, but preserves the overall trend. These φM values correspond to the true electrostatic potential drop at the interface under HER/HOR conditions. While we acknowledge that the RP can extend into the diffuse double layer beyond the OHP, we find that this possibility leads to very small changes in the calculated electrostatic potential at the Pt surface (Figure S7) relative to the above assumption that the RP is at the OHP. Although GCS theory provides a reasonable estimate of the electrostatic potential at the metal surface, we also acknowledge that more complex theories of double layer structure could be used to provide a richer picture of the electrostatic potential of the surface.
To analyze the data further, we can subtract φM from E to arrive at an effective EPZFC. This value, which could never be measured directly, corresponds to the hypothetical potential of an uncharged electrode with the adsorbate population and surface structure existent under catalytic conditions. Thus, this effective EPZFC need not match the EPZFC measured independently in the absence of catalysis. Indeed, we find an effective EPZFC of ∼0 V vs SHE (Figure 6c), which is ∼0.3 V more negative than the EPZFC measured for a Pt(111) surface in the absence of concurrent H2/H+ catalysis.9,38 While some of this shift may result from the polycrystalline surface structure employed here,29 the replacement of the water adlayer with a saturated adlayer of adsorbed H present under the condition of catalysis is expected to contribute as well. Furthermore, we find that our effective EPZFC values are roughly constant across the pH range (Figure 6c), suggesting that, at least between pH 2 and 7, the adsorbate population and surface structure of the Pt under HER/HOR conditions remain unchanged. Our results provide the first direct indication of a Nernstian pH dependence in the magnitude of the electrostatic potential under the conditions of HER/HOR. These results are in line with contemporary PZFC theory9,17,20,38 and highlights that, for a Pt electrode over this pH range, the electrostatic (Volta) potential change fully accounts for the aggregate Nernstian shift in the electrode potential.
Concluding Remarks
In conclusion, we establish a rigorous framework for understanding the electric field environment experienced by a Pt surface while it catalyzes the interconversion of H+ and H2. We use the H2/H+ couple to pin the Pt electrode at the reversible potential for this reaction across a wide pH range and then introduce a nonfaradaic reaction probe to sense the local pH at the Pt surface. We show that the field-induced migration of protons to the surfaces lowers the local pH relative to the bulk value at low ionic strengths, causing a change in the selectivity of the probe reaction. By quantifying the selectivity as a function of ionic strength and pH, we extract the electrostatic potential inside the double layer. Consequently, our probe reaction provides the first in situ measurements of the magnitude of the interfacial electric field under the conditions of reversible H2/H+ catalysis. We show that the magnitude of the electrostatic potential at the Pt surface increases by 60 mV for each unit increase in the bulk pH over the range explored in this study. Thus, our results show that Pt surfaces would experience a negligible interfacial field when catalyzing H2/H+ conversion at ca. pH 1, but experience an appreciable field of ∼108 V m–1 at pH 7. Linear extrapolation of our data to pH 14 would imply an even stronger field in alkaline media, although we acknowledge that binding of *OHx species39,40 could attenuate the field strength under strongly basic conditions. Nonetheless, the dramatic difference we uncover in the magnitude of the interfacial field at RHE should influence the rate of solvent reorganization and may contribute to the strong pH dependence of the kinetics of H2/H+ conversion.9 Together, this work highlights that differences in the interfacial electric field strength must be considered when comparing the kinetics of electrocatalysis across the pH range.
Acknowledgments
We thank Cyrille Costentin, Michael Pegis, and Corey Kaminsky for helpful discussions. This work is supported by the Air Force Office of Scientific Research (AFOSR) under award number FA9550-18-1-0420. J.R. acknowledges support from a Samsung Scholarship. Y.S. acknowledges the Sloan Foundation, Research Corporation for Science Advancement (Cottrell Scholar), and the Canadian Institute for Advanced Research (CIFAR Azrieli Global Scholar).
Supporting Information Available
The Supporting Information is available free of charge on the ACS Publications website at DOI: 10.1021/jacs.9b05148.
Full experimental and analytical details, raw reaction profiles, and additional kinetic data (PDF)
The authors declare no competing financial interest.
Supplementary Material
References
- Gileadi E.Physical Electrochemistry: Fundamentals, Techniques and Applications; Wiley-VCH: Weinheim, 2011. [Google Scholar]
- Bard A. J.Electrochemical Methods: Fundamentals and Applications; Wiley: New York, 2001. [Google Scholar]
- Bockris J. O’M.; Reddy A. K. N.; Gamboa-Aldeco M. G.-A.. Modern Electrochemistry 2A; Kluwer Academic Publishers: Boston, 2002. [Google Scholar]
- Fried S. D.; Boxer S. G. Measuring Electric Fields and Noncovalent Interactions Using the Vibrational Stark Effect. Acc. Chem. Res. 2015, 48 (4), 998–1006. 10.1021/ar500464j. [DOI] [PMC free article] [PubMed] [Google Scholar]
- Clark M. L.; Ge A.; Videla P. E.; Rudshteyn B.; Miller C. J.; Song J.; Batista V. S.; Lian T.; Kubiak C. P. CO2 Reduction Catalysts on Gold Electrode Surfaces Influenced by Large Electric Fields. J. Am. Chem. Soc. 2018, 140 (50), 17643–17655. 10.1021/jacs.8b09852. [DOI] [PubMed] [Google Scholar]
- Resasco J.; Chen L. D.; Clark E.; Tsai C.; Hahn C.; Jaramillo T. F.; Chan K.; Bell A. T. Promoter Effects of Alkali Metal Cations on the Electrochemical Reduction of Carbon Dioxide. J. Am. Chem. Soc. 2017, 139 (32), 11277–11287. 10.1021/jacs.7b06765. [DOI] [PubMed] [Google Scholar]
- Sevinc P. C.; Dhital B.; Govind Rao V.; Wang Y.; Lu H. P. Probing Electric Field Effect on Covalent Interactions at a Molecule–Semiconductor Interface. J. Am. Chem. Soc. 2016, 138 (5), 1536–1542. 10.1021/jacs.5b10253. [DOI] [PubMed] [Google Scholar]
- Chen L. D.; Urushihara M.; Chan K.; Nørskov J. K. Electric Field Effects in Electrochemical CO2 Reduction. ACS Catal. 2016, 6 (10), 7133–7139. 10.1021/acscatal.6b02299. [DOI] [Google Scholar]
- Ledezma-Yanez I.; Wallace W. D. Z.; Sebastián-Pascual P.; Climent V.; Feliu J. M.; Koper M. T. M. Interfacial Water Reorganization as a pH-Dependent Descriptor of the Hydrogen Evolution Rate on Platinum Electrodes. Nat. Energy 2017, 2 (4), 17031. 10.1038/nenergy.2017.31. [DOI] [Google Scholar]
- Subbaraman R.; Tripkovic D.; Strmcnik D.; Chang K.-C.; Uchimura M.; Paulikas a P.; Stamenkovic V.; Markovic N. M. Enhancing Hydrogen Evolution Activity in Water Splitting by Tailoring Li+-Ni(OH)2-Pt Interfaces. Science 2011, 334 (6060), 1256–1260. 10.1126/science.1211934. [DOI] [PubMed] [Google Scholar]
- Sheng W.; Zhuang Z.; Gao M.; Zheng J.; Chen J. G.; Yan Y. Correlating Hydrogen Oxidation and Evolution Activity on Platinum at Different pH with Measured Hydrogen Binding Energy. Nat. Commun. 2015, 6 (1), 5848. 10.1038/ncomms6848. [DOI] [PubMed] [Google Scholar]
- Subbaraman R.; Tripkovic D.; Chang K.-C.; Strmcnik D.; Paulikas A. P.; Hirunsit P.; Chan M.; Greeley J.; Stamenkovic V.; Markovic N. M. Trends in Activity for the Water Electrolyser Reactions on 3d M(Ni,Co,Fe,Mn) Hydr(Oxy)Oxide Catalysts. Nat. Mater. 2012, 11 (6), 550–557. 10.1038/nmat3313. [DOI] [PubMed] [Google Scholar]
- Cheng T.; Wang L.; Merinov B. V.; Goddard W. A. Explanation of Dramatic pH-Dependence of Hydrogen Binding on Noble Metal Electrode: Greatly Weakened Water Adsorption at High pH. J. Am. Chem. Soc. 2018, 140 (25), 7787–7790. 10.1021/jacs.8b04006. [DOI] [PubMed] [Google Scholar]
- Durst J.; Siebel A.; Simon C.; Hasché F.; Herranz J.; Gasteiger H. A. New Insights into the Electrochemical Hydrogen Oxidation and Evolution Reaction Mechanism. Energy Environ. Sci. 2014, 7 (7), 2255–2260. 10.1039/C4EE00440J. [DOI] [Google Scholar]
- Gorin C. F.; Beh E. S.; Bui Q. M.; Dick G. R.; Kanan M. W. Interfacial Electric Field Effects on a Carbene Reaction Catalyzed by Rh Porphyrins. J. Am. Chem. Soc. 2013, 135 (30), 11257–11265. 10.1021/ja404394z. [DOI] [PubMed] [Google Scholar]
- Chantarojsiri T.; Reath A. H.; Yang J. Y. Cationic Charges Leading to an Inverse Free-Energy Relationship for N–N Bond Formation by MnVI Nitrides. Angew. Chem., Int. Ed. 2018, 57 (43), 14037–14042. 10.1002/anie.201805832. [DOI] [PubMed] [Google Scholar]
- Sarabia F. J.; Sebastián-Pascual P.; Koper M. T. M.; Climent V.; Feliu J. M. Effect of the Interfacial Water Structure on the Hydrogen Evolution Reaction on Pt(111) Modified with Different Nickel Hydroxide Coverages in Alkaline Media. ACS Appl. Mater. Interfaces 2019, 11 (1), 613–623. 10.1021/acsami.8b15003. [DOI] [PubMed] [Google Scholar]
- Liu E.; Huang Y.; Jia Q.; Zhao Z.; Li J.; Mukerjee S.; Liu Z.; Doan H. T. T.; Abraham K. M.; Jiao L. Unifying the Hydrogen Evolution and Oxidation Reactions Kinetics in Base by Identifying the Catalytic Roles of Hydroxyl-Water-Cation Adducts. J. Am. Chem. Soc. 2019, 141, 3232–3239. 10.1021/jacs.8b13228. [DOI] [PubMed] [Google Scholar]
- Climent V.; Coles B. A.; Compton R. G. Coulostatic Potential Transients Induced by Laser Heating of a Pt(111) Single-Crystal Electrode in Aqueous Acid Solutions. Rate of Hydrogen Adsorption and Potential of Maximum Entropy. J. Phys. Chem. B 2002, 106 (23), 5988–5996. 10.1021/jp020785q. [DOI] [Google Scholar]
- Rizo R.; Sitta E.; Herrero E.; Climent V.; Feliu J. M. Towards the Understanding of the Interfacial pH Scale at Pt(111) Electrodes. Electrochim. Acta 2015, 162, 138–145. 10.1016/j.electacta.2015.01.069. [DOI] [Google Scholar]
- Weaver M. J. Potentials of Zero Charge for Platinum(111)–Aqueous Interfaces: A Combined Assessment from In-Situ and Ultrahigh-Vacuum Measurements. Langmuir 1998, 14 (14), 3932–3936. 10.1021/la9801054. [DOI] [Google Scholar]
- Oklejas V.; Sjostrom C.; Harris J. M. SERS Detection of the Vibrational Stark Effect from Nitrile-Terminated SAMs to Probe Electric Fields in the Diffuse Double-Layer. J. Am. Chem. Soc. 2002, 124 (11), 2408–2409. 10.1021/ja017656s. [DOI] [PubMed] [Google Scholar]
- Ge A.; Videla P. E.; Lee G. L.; Rudshteyn B.; Song J.; Kubiak C. P.; Batista V. S.; Lian T. Interfacial Structure and Electric Field Probed by in Situ Electrochemical Vibrational Stark Effect Spectroscopy and Computational Modeling. J. Phys. Chem. C 2017, 121 (34), 18674–18682. 10.1021/acs.jpcc.7b05563. [DOI] [Google Scholar]
- Sorenson S. A.; Patrow J. G.; Dawlaty J. M. Solvation Reaction Field at the Interface Measured by Vibrational Sum Frequency Generation Spectroscopy. J. Am. Chem. Soc. 2017, 139 (6), 2369–2378. 10.1021/jacs.6b11940. [DOI] [PubMed] [Google Scholar]
- Chattopadhyay A.; Boxer S. G. Vibrational Stark Effect Spectroscopy. J. Am. Chem. Soc. 1995, 117 (4), 1449–1450. 10.1021/ja00109a038. [DOI] [Google Scholar]
- Oklejas V.; Sjostrom C.; Harris J. M. Surface-Enhanced Raman Scattering Based Vibrational Stark Effect as a Spatial Probe of Interfacial Electric Fields in the Diffuse Double Layer. J. Phys. Chem. B 2003, 107 (31), 7788–7794. 10.1021/jp0344693. [DOI] [Google Scholar]
- Favaro M.; Jeong B.; Ross P. N.; Yano J.; Hussain Z.; Liu Z.; Crumlin E. J. Unravelling the Electrochemical Double Layer by Direct Probing of the Solid/Liquid Interface. Nat. Commun. 2016, 7 (1), 12695. 10.1038/ncomms12695. [DOI] [PMC free article] [PubMed] [Google Scholar]
- Martínez-Hincapié R.; Sebastián-Pascual P.; Climent V.; Feliu J. M. Exploring the Interfacial Neutral pH Region of Pt(111) Electrodes. Electrochem. Commun. 2015, 58 (111), 62–64. 10.1016/j.elecom.2015.06.005. [DOI] [Google Scholar]
- Garcia-Araez N.; Climent V.; Feliu J. Potential-Dependent Water Orientation on Pt(111), Pt(100), and Pt(110), As Inferred from Laser-Pulsed Experiments. Electrostatic and Chemical Effects. J. Phys. Chem. C 2009, 113 (21), 9290–9304. 10.1021/jp900792q. [DOI] [Google Scholar]
- Gómez R.; Climent V.; Feliu J. M.; Weaver M. J. Dependence of the Potential of Zero Charge of Stepped Platinum (111) Electrodes on the Oriented Step-Edge Density: Electrochemical Implications and Comparison with Work Function Behavior. J. Phys. Chem. B 2000, 104 (3), 597–605. 10.1021/jp992870c. [DOI] [Google Scholar]
- Ryu J.; Wuttig A.; Surendranath Y. Quantification of Interfacial pH Variation at Molecular Length Scales Using a Concurrent Non-Faradaic Reaction. Angew. Chem., Int. Ed. 2018, 57 (30), 9300–9304. 10.1002/anie.201802756. [DOI] [PubMed] [Google Scholar]
- Zaera F. The Surface Chemistry of Metal-Based Hydrogenation Catalysis. ACS Catal. 2017, 7 (8), 4947–4967. 10.1021/acscatal.7b01368. [DOI] [Google Scholar]
- Lohr T. L.; Li Z.; Marks T. J. Thermodynamic Strategies for C–O Bond Formation and Cleavage via Tandem Catalysis. Acc. Chem. Res. 2016, 49 (5), 824–834. 10.1021/acs.accounts.6b00069. [DOI] [PubMed] [Google Scholar]
- Jerkiewicz G. Hydrogen Sorption At/In Electrodes. Prog. Surf. Sci. 1998, 57 (2), 137–186. 10.1016/S0079-6816(98)00015-X. [DOI] [Google Scholar]
- Torrie G. M.; Valleau J. P. Electrical Double Layers. 4. Limitations of the Gouy-Chapman Theory. J. Phys. Chem. 1982, 86 (16), 3251–3257. 10.1021/j100213a035. [DOI] [Google Scholar]
- Yamamoto M. Electric(al) Double Layer for Unsymmetrical Electrolytes: Tutorials. Rev. Polarogr. 2011, 57 (1), 27–39. 10.5189/revpolarography.57.27. [DOI] [Google Scholar]
- Bari Bhuiyan L.; Outhwaite C. W. Comparison of the Modified Poisson–Boltzmann Theory with Recent Density Functional Theory and Simulation Results in the Planar Electric Double Layer. Phys. Chem. Chem. Phys. 2004, 6 (13), 3467–3473. 10.1039/B316098J. [DOI] [Google Scholar]
- Ganassin A.; Sebastian P.; Climent V.; Schuhmann W.; Bandarenka A. S.; Feliu J. On the pH Dependence of the Potential of Maximum Entropy of Ir(111) Electrodes. Sci. Rep. 2017, 7 (1), 1–14. 10.1038/s41598-017-01295-1. [DOI] [PMC free article] [PubMed] [Google Scholar]
- Chen X.; McCrum I. T.; Schwarz K. A.; Janik M. J.; Koper M. T. M. Co-Adsorption of Cations as the Cause of the Apparent pH Dependence of Hydrogen Adsorption on a Stepped Platinum Single-Crystal Electrode. Angew. Chem., Int. Ed. 2017, 56 (47), 15025–15029. 10.1002/anie.201709455. [DOI] [PMC free article] [PubMed] [Google Scholar]
- Van Der Niet M. J. T. C.; Garcia-Araez N.; Hernández J.; Feliu J. M.; Koper M. T. M. Water Dissociation on Well-Defined Platinum Surfaces: The Electrochemical Perspective. Catal. Today 2013, 202 (1), 105–113. 10.1016/j.cattod.2012.04.059. [DOI] [Google Scholar]
Associated Data
This section collects any data citations, data availability statements, or supplementary materials included in this article.


