Abstract
Atrazine is a common herbicide that is widely used to control weed growth in both agricultural and residential settings. It has been shown to act as an endocrine disruptor that affects aquatic organisms. Rapid and low-cost monitoring methods for atrazine is the first step to mitigate its widespread persistency. Aptamers are small synthetic oligonucleotides that can assume a 3D structure to act as the molecular recognition element for a specific target of interest. Two different atrazine binding aptamers (R12.23 Trunc. and R12.45 Trunc.) have been identified from the same library design but with fundamentally different in vitro selection methodologies. While the R12.23 Trunc. has been utilized in immobilized biosensing platforms, it is unclear if in-solution-based applications would be suitable for both atrazine binding aptamers. This study provides the first insight of comparative in-solution binding profiles of the two atrazine binding aptamers. Based on our results, this information will be useful for future biosensing platform development utilizing the two aptamers.
Introduction
Atrazine is one of the most widely applied herbicides in the world.1 It is used to control the growth of many kinds of grass and broadleaf weeds in crops such as corn and sorghum. In addition, it has also been used on residential lawns.2 Atrazine can leak into the soil and contaminate both the ground and drinking water.3 The presence of atrazine in these bodies of water has increased public concern about atrazine contamination. It can also damage plants which are not resistant to atrazine because of the absence of a detoxifying system.4 Studies have shown the negative impacts of atrazine on amphibians, fish, and algae and its potential toxicity in the aquatic ecosystem.5 Atrazine is also known to be an endocrine disruptor that reduces the production of testosterone in mammals. A study demonstrated that daily exposure to atrazine could diminish the testosterone level in male rats.6 Kucka et al. identified that atrazine disrupts the endocrine system by inhibiting cAMP-specific phosphodiesterase-4 and leads to an increase in the cAMP level. This causes an increase in the production of prolactin in rat pituitary cells and androgen from Leydig cells.7 Because of the widespread use and the detrimental effects of atrazine, it is important to be able to monitor its level precisely. Currently available methods to detect atrazine such as [liquid chromatography/mass spectrometry (MS)] or gas chromatography/MS require specific expensive equipment and are typically labor-intensive.8 Thus, the development of a rapid biosensing system can be beneficial to the monitoring of atrazine contamination of soil and water. Aptamers have been shown to have a high potential to be incorporated into different biosensing systems.9−11
Aptamers are short single-stranded RNA or DNA oligonucleotide molecules capable of binding to specific targets with a high affinity and specificity. They are low cost in production and relatively stable and can be chemically synthesized with high purity. Many ssDNA aptamers have been reported to undergo conformational changes upon target binding. This particular binding property is favorable in biosensing systems.12 Nucleic acid aptamers can be selected from large random oligonucleotide pools through a method, termed systematic evolution of ligands by exponential enrichment (SELEX).13,14 In brief, the large random oligonucleotide library is subjected to repeated cycles of incubation with target molecules, partitioning of nonbinding library molecules, and amplification of target bound library molecules. The target selection rounds (positive rounds) are sometimes followed by counter target selections (negative rounds), which enhances the selectivity of the resulting aptamer candidates.12 Different variants of SELEX such as graphene oxide SELEX (GO-SELEX) and Capture-SELEX have been described to identify aptamers with conformational changes upon binding to targets.15,16
There were previously three ssDNA aptamers reported that are specific toward atrazine.8,17,18 Williams et al. identified a single-stranded DNA aptamer with a high affinity for atrazine using a stringent SELEX methodology.8 The authors utilized fluorescently labeled full-length aptamer (a 79-mer) to characterize its binding affinity and specificity toward atrazine. The reported (Kd) for this ssDNA aptamer (R12. 23) is 0.62 ± 0.21 nM. It also displayed a high specificity toward atrazine. In addition, a truncated version of R12.23 (R12.23 Trunc.) was coupled with capillary electrophoresis to show a proof-of-principle detection assay.8 In another study, Sanchez utilized a capillary electrophoresis SELEX (CE-SELEX) technique to select an ssDNA aptamer (At-Apt-25) specific to atrazine. The fluorescent polarization technique was used to characterize the aptamer’s binding affinity. The reported Kd was 890 nM.18 Even though two previously described aptamers showed good affinity and specificity toward atrazine, both aptamers were characterized with a fluorescent label, which may interfere with the binding interaction between the ssDNA aptamer and the small molecule. McKeague et al. previously reported utilizing an array of characterization methods to determine the binding affinity between small-molecule targets and aptamers in solution, and with immobilized aptamers. The study reported that the measured binding affinity of small-molecule binding ssDNA aptamers can vary to a large degree depending on the characterization methods.19 This suggests that thorough binding characterization experiments are needed before aptamer-based biosensor development.
Our group recently reported an ssDNA aptamer (R12.45 Trunc.) that binds to atrazine with high affinity and specificity using three different in-solution binding experimental characterization methods.17 The result was perplexing, in which R12.45 Trunc. displayed nonconventional binding characteristics. In brief, R12.45 Trunc. displayed target induced structural stabilization that prevents aptamer-coated gold nanoparticle from target binding salt-induced aggregation. R12.45 Trunc. also displayed enhanced an SYBR Green fluorescence signal in the presence of low concentrations of atrazine. This result was different from traditional SYBR Green displacement fluorescence assays. It is to be noted that the oligonucleotide library used to identify the R12.45 Trunc. had the same primer design as the one used in the Williams study.8 To utilize R12.45 Trunc. as the binding element in a biosensor, we further compared the in-solution binding properties between R12.45 Trunc. and R12.23 Trunc. In this study, we used isothermal titration calorimetry (ITC), circular dichroism (CD) analysis, SYBR Green displacement fluorescence assay, and two different setups of gold nanoparticle colorimetric assays to characterize the in-solution binding differences between R12.45 Trunc. and R12.23 Trunc. At the conclusion of this study, all but one assay demonstrated significant differences in binding properties between the two studied aptamers. This study generated additional knowledge that will be useful in the future development of ssDNA aptamer-based atrazine biosensors utilizing the R12.45 Trunc. aptamer.
Results and Discussion
ITC Binding Experiments
One of the major challenges in developing aptamer-based biosensing assays is to obtain the binding affinity profile of each aptamer precisely. While aptamer binding between whole-cell and protein targets can be readily characterized with standardized analytical methods such as fluorescence-activated cell sorter and surface plasmon resonance (SPR), characterization of binding affinity between the aptamer and small molecules remains a challenge. McKeague et al. previously investigated how different binding assays yield a wider variance of the equilibrium dissociation constant (Kd) between individual pairs of aptamer and small molecule targets.19 To study this phenomenon further, we employed different in-solution binding assays to integrate two different atrazine-specific ssDNA aptamers, which were identified from the same library design, termed RMWN34, originally developed by the Sooter group formerly at West Virginia University.8
Previously, Williams et al. utilized a semi in-solution method to characterize the binding affinity (Kd = 0.62 ± 0.21 nM) between atrazine and the full-length R12.23 aptamer.8 In the study, an atrazine analog was first covalently immobilized on magnetic beads, and then fluorescently labeled R12.23 was introduced in the system. R12.23 that binds to the immobilized atrazine analog was competitively eluted out by free atrazine in solution at the end, for signal quantification and dissociation constant calculation.8 Hickey conducted a follow-up study to investigate the structural properties of the truncated version of R12.23 (R12.23 Trunc.).20 The same methodology was utilized to determine the Kd to be 15.0 ± 16.5 nM. The author stated that nonspecific binding with the fluorescein tag was the major drawback of this methodology and thus generated the high standard deviation.20 To mitigate this, we utilized ITC (MicroCal Auto-iTC200 by GE) to measure the Kd of R12.23 Trunc. directly in solution. In brief, 200 μL of 100 μM atrazine was titrated into 400 μL of 10 μM R12.23 Trunc. aptamer in the sample cell at 25 °C. The Kd was estimated to be 2.58 μM based on nonlinear regression model analysis by the companion software (Figure 1). This value indicated a much lower affinity (172 times) than that was previously reported.20 Thermodynamic values of the ITC experiment were evaluated to determine the validity of the data (Table S1). The Wiseman coefficient c = n × [aptamer]/Kd, where n represents the number of binding sites. The c value was determined to be 1.02. This value is within the reported range of 1–1000 for reliable ITC data.21 These data also suggested that the binding between the aptamer and atrazine was completed at the 1:10 aptamer/ligand ratio. In our ITC experiment, the n-value was fitted as a variable to obtain reliable data. An n-value of less than 1 suggested that potential multiple binding sites may be present on the aptamer (ligand).22 Although the heat generated from the experimental molar ratio between the aptamer and the ligand was relatively small, it is to be noted that an increased concentration of aptamer may lead to an increased Kd value because of the inter-aptamer interaction.22,23 Thus, the molar ratio was optimal for this experiment. The potential reason for the large differences between the newly determined Kd value and the value reported by Hickey is that the fluorescent tag may generate a high level of nonspecific background binding as previously noted.
Figure 1.
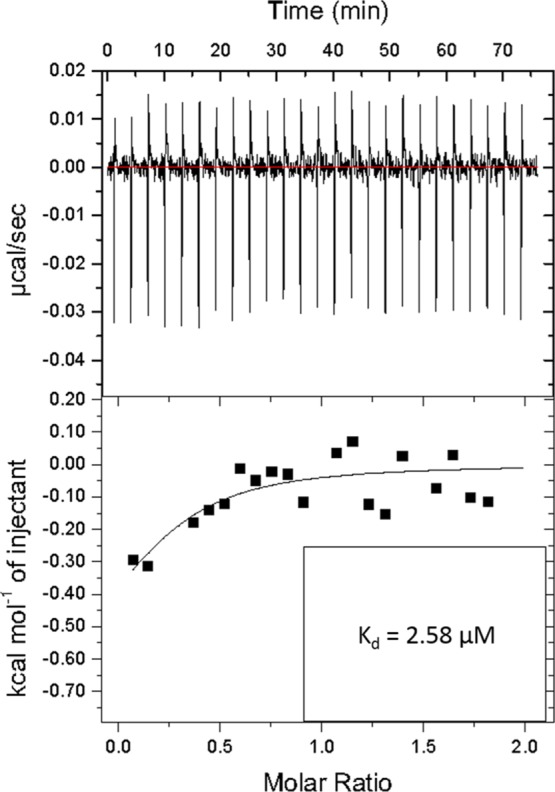
ITC analysis of binding affinity between R12.23 Trunc. and atrazine.
CD Studies and Secondary Structure Analysis
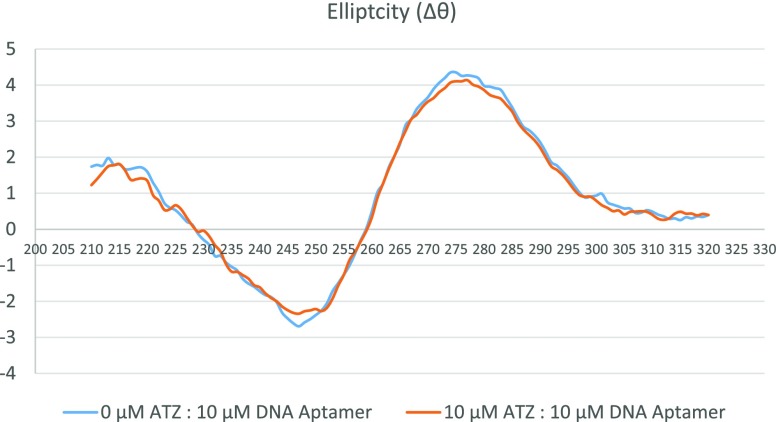
Hickey also reported that the binding between R12.23 Trunc. and atrazine yielded no conformational changes in the aptamer structure in CD analysis.20 CD analysis was performed to confirm the previous findings (Figure 2). The CD spectra indicated a negative band at approximately 245 nm and a positive band at approximately 270 nm. It assumed a B-form DNA structure in the presence and absence of atrazine. The CD spectrum obtained from this study confirmed the findings by Hickey.
Figure 2.
CD analysis of R12.23 Trunc. in the presence or absence of atrazine (ATZ: atrazine).
After the initial analysis of the affinity and the structural conformation of R12.23 Trunc., we noticed that both the quantitative and qualitative binding data of R12.23 Trunc. and R12.45 Trunc. were relatively different. The Kd value R12.23. Trunc. was 697-fold lower than R12.45 Trunc. (Kd = 3.7 nM).17 R12.23 Trunc. also did not appear to assume atrazine-induced B-form duplex to hairpin transition previously reported in R12.45 Trunc.17 It is to be noted that although both atrazine aptamers were selected from the same library design (RMWN34), different selection strategies were employed in the two studies. Williams et al. utilized a magnetic bead-based target (atrazine)-immobilized selection technique. In contrast, Abraham et al. utilized a library-immobilized selection technique (Capture-SELEX).8,17 Successful isolation of aptamer candidates in Capture-SELEX relies on the release of the library molecule from the complementary probe after target introduction. This library molecule detachment requirement in the selection process is likely to have generated a different aptamer candidate pool in comparison to the target-immobilized SELEX method. Interestingly, the Mfold predicted that secondary structures of both truncated aptamers contain a TTTA sequence motif in their hairpin structures (Figure 3).24 Stem-loop and hairpin regions in aptamers have been shown to assume binding pockets for their respective targets.25 Thus, this TTTA sequence motif is likely crucial in the binding interaction between the aptamer and atrazine.
Figure 3.
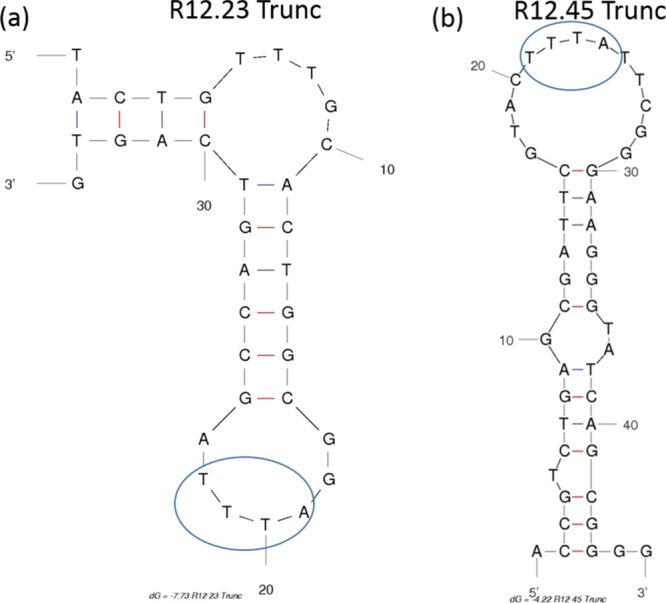
Predicted secondary structures of R12.23 Trunc. and R12.45 Trunc. (a) Secondary structure of R12. 23 Trunc. aptamer predicted by Mfold.20,24 (b) Secondary structure pf R12.45 Trunc. aptamer predicted by Mfold.17,24 The blue oval highlighted the TTTA motif similarity in both of the hairpin structures. (Images are generated from the free domain and are free of copyrights).
SYBR Green Displacement Studies
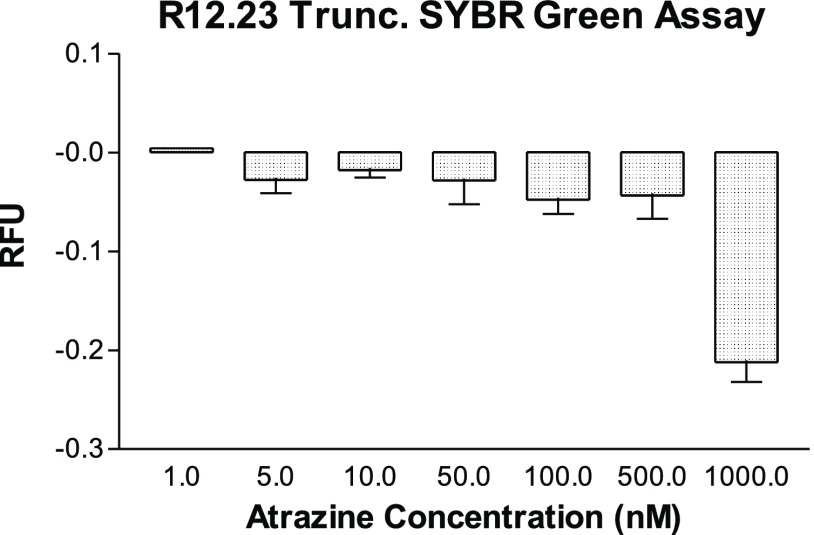
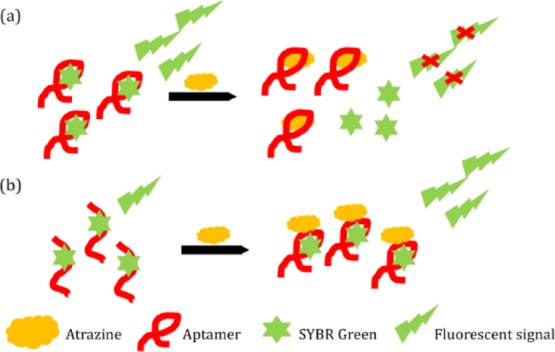
After the affinity and structural reassessment of R12.23 Trunc., we then interrogated its in-solution binding property with SYBR Green I (SG) displacement fluorescence assay. The assay principle is based upon measuring the decrease in the fluorescent signal from target binding to the SG intercalated double-stranded region in an aptamer. The SG compound has a very low background fluorescent signal when it is not interacting with double-stranded DNA elements. An increasing concentration of atrazine from 1 nM to 1 μM was incubated with SG treated R12.23 Trunc. After normalization of the recorded fluorescent signal, we observed a decreasing fluorescent signal from the baseline as the concentration of atrazine increased (Figure 4). This suggested that the binding of atrazine to R12.23 Trunc. displaced the intercalated SG molecule from the double-stranded region of R12.23 Trunc. This result was in contrast with our previous finding in R12.45 Trunc. We previously reported that the SG fluorescent signal generated from atrazine binding to R12.45 Trunc. followed an increased pattern from atrazine concentration of 1–50 nM and then decreased afterward. The normalized values of all atrazine-treated replicates were all higher than the control baseline value.17 The different fluorescence pattern produced in the same assay setup suggests the hypothesis that the binding of atrazine to R12.23 Trunc. is a pure SG displacement binding without aptamer structural stabilization (Figure S1a). This is again in contrast to the R12.45 Trunc. structural stabilization binding pattern we reported previously (Figure S1b).17
Figure 4.
SYBR Green displacement assays. Representative data from the SG standard assay. Atrazine concentrations were as follows: 1, 5, 10, 50, 100, 500, and 1000 nM. RFU represents the average normalized fluorescence signal with respect to the binding buffer. One-way ANOVA: F6,7 = 18.5, p = 0.000571.
Adsorbed Gold Nanoparticles Specificity Studies
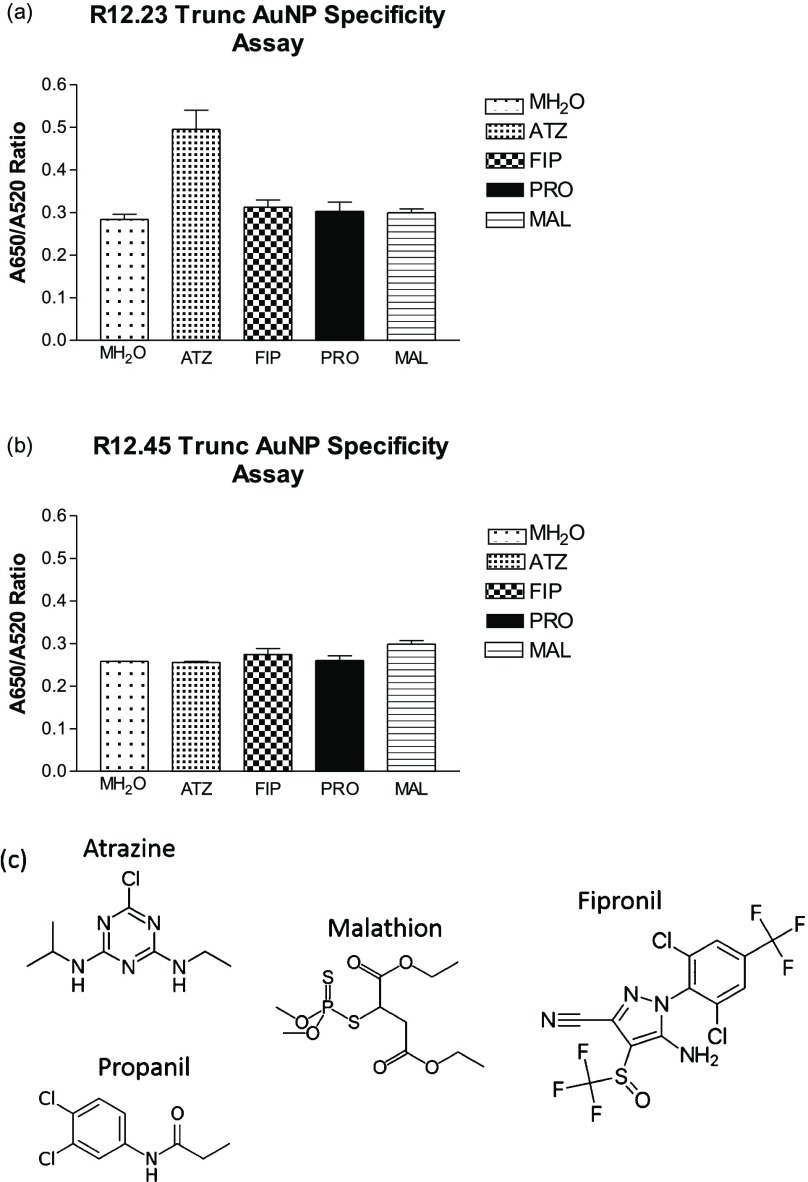
Given the different binding patterns we observed between R12.23 Trunc. and R12. 45 Trunc., we further investigated the in-solution binding differences with gold nanoparticle (AuNP) colorimetric assay, or in this case, the adsorbed AuNP aggregation assay. Briefly, the assay principle is based upon quantifying the red to blue-purple color change from salt-induced AuNP aggregation. When a specific target is present in the aptamer-coated gold nanoparticle solution, aptamer binding to the target will desorb the aptamer from the gold nanoparticles. Addition of salt afterward will induce a visible color shift. The changes in visible color can be monitored with absorbance readings at 520 and 650 nm. We first subjected R12.23 Trunc. to a specificity test using the adsorbed AuNP aggregation assay. R12.23 Trunc. generated a statistically significant red to blue-purple colorimetric shift when subjected to atrazine exposure (one-way ANOVA: F4,5 = 12.8, p < 0.01) (Figure 5a). All other herbicides and insecticides tested in the assay did not generate a significant colorimetric shift. This confirmed the specificity of the R12.23 Trunc. We then subjected R12.45 Trunc., to the same experimental setup. In contrast, atrazine exposure to the R12.45 Trunc.-coated AuNP did not generate any significant shift in the absorbance measurement (one-way ANOVA: F4,5 = 3.79, p > 0.05) (Figure 5b). This result was in agreement with our previous finding which showed that atrazine at up to 100 μM remains unable to produce a colorimetric shift.17
Figure 5.
Adsorbed gold nanoparticles specificity assays. (a) Aggregation response between R12.23 Trunc. and different analytes, one-way ANOVA: F4,5 = 12.8, p < 0.01. (b) Aggregation response between R12.45 Trunc. and different analytes, one-way ANOVA: F4,5 = 3.79, p > 0.05; MH2O: 10% methanol in water. (c) Chemical structures of tested molecules, ATZ: atrazine, FIP: fipronil, PRO: propanil, MAL: malathion. All analytes were at 1 μM.
Adsorbed Gold Nanoparticles Affinity Studies
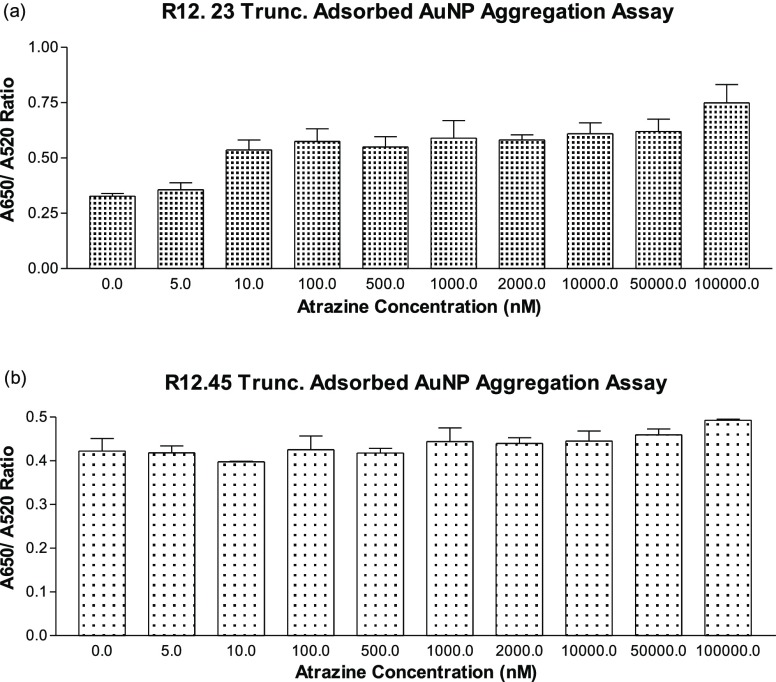
We further utilized the same adsorbed AuNP aggregation assay to characterize the binding affinity of both R12.23 Trunc. and R12.45 Trunc. at varying atrazine concentrations (0–100 μM). R12.23 Trunc. showed a statistically significant dose-dependent increase of red to blue-purple colorimetric shift (one-way ANOVA: F9,10 = 5.51, p < 0.05) (Figure 6a). The assay showed a linear range from 10 nM to 50 μM, and the LOD (limited of detection) of this assay was determined to be 174 nM (Figure S2). However, R12.45 Trunc. did not produce any statistically significant changes in color (one-way ANOVA: F9,10 = 1.76, p > 0.1) (Figure 6b). Two previous studies reported a similar phenomenon where the failure in salt-induced colorimetric shift upon target introduction to aptamer-coated gold nanoparticles was due to target-aptamer stabilization on the AuNP surface.26,27 In brief, Chávez et al. reported the binding between riboflavin and its corresponding aptamer stabilized the aptamer structure adsorbed on AuNP surfaces and no salt-induced AuNP aggregation was observed.26 Smith et al. also reported that the binding between cocaine with MN6 cocaine binding aptamer, an aptamer with known conformational changes upon target recognition, did not generate the salt-induced AuNPs aggregation in adsorbed AuNPs assays. On the other hand, the author observed the salt-induced AuNPs aggregation in the same assay setup with cocaine-bound MN4 cocaine binding aptamer, an aptamer that does not have conformational changes upon target binding.27 Thus, the result from the aptamer-adsorbed AuNP aggregation assay suggested the binding of atrazine to R12.23 Trunc. led to the detachment of the aptamer from the AuNP and resulted in salt-induced aggregation (Figure S3a). This result also supported the qualitative CD spectrum we reported in this study. On the other hand, the combined result of the specificity test and atrazine standard test of R12.45 Trunc. further confirmed our previous finding where binding of atrazine to R12.45 Trunc. stabilized the adsorbed aptamer on the AuNP surface, thus preventing salt-induced aggregation (Figure S3b).
Figure 6.
Adsorbed gold nanoparticle affinity aggregation assays. (a) Aggregation response between R12.23 Trunc. and varying concentration of atrazine, one-way ANOVA: F9,10 = 5.51, p < 0.05. (b) Aggregation response between R12.45 Trunc. and varying concentration of atrazine, one-way ANOVA: F9,10 = 1.76, p > 0.1.
Free Gold Nanoparticles Affinity Studies
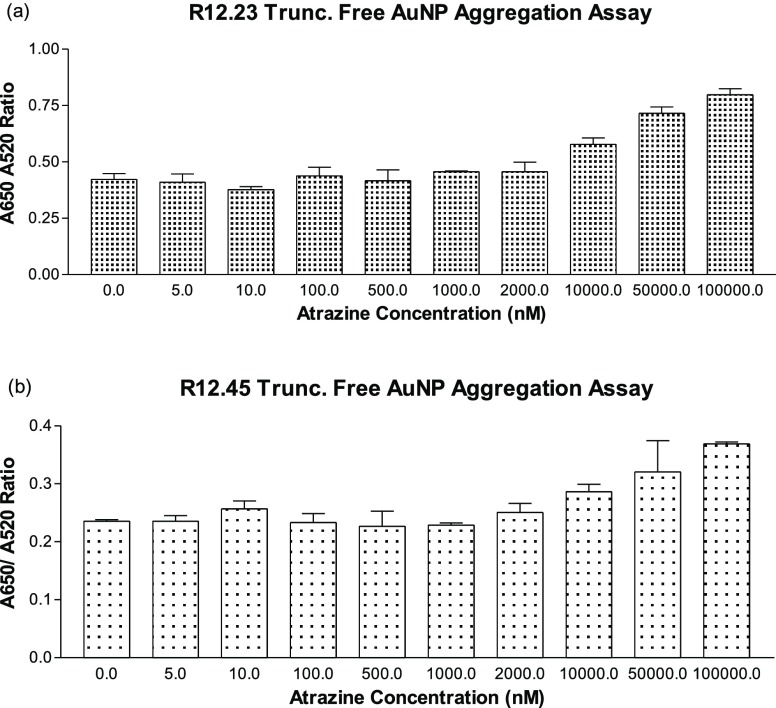
Finally, we investigated the AuNP assay with a different setup, where different concentrations of atrazine were first incubated with a given amount of aptamers in their binding buffers. We adopted a previously described protocol for this assay.27 This particular assay setup ensured the complete interaction between the two species, before the addition of AuNP. This assay was termed the free AuNP aggregation assay (Figure S3c). In this assay, R12.23 Trunc. again demonstrated a statistically significant dose-dependent increase of colorimetric shift (one-way ANOVA: F9,10 = 20.3, p < 0.001) (Figure 7a). The assay showed a linear range from 500 nM to 100 μM, and the LOD of this assay was determined to be 4 nM (Figure S4a). Interestingly, R12.45 Trunc. was able to produce the colorimetric shift in a dose-dependent manner for the first time (one-way ANOVA: F9,10 = 4.9, p < 0.05) (Figure 7b). The assay also showed a linear range from 500 nM to 100 μM, and the LOD was determined to be 5 nM (Figure S4b).
Figure 7.
Free gold nanoparticle affinity aggregation assays. (a) Aggregation response between R12.23 Trunc. and varying concentration of atrazine, one-way ANOVA: F9,10 = 20.3, p < 0.001. (b) Aggregation response between R12.45 Trunc. and varying concentration of atrazine, one-way ANOVA: F9,10 = 4.9, p < 0.05.
In the Smith study, the author reported a similar phenomenon where both MN6 and MN4 cocaine binding aptamers were able to produce the salt-induced colorimetric shift in their free aptamer AuNP assays.27 In our comparative study of the two atrazine binding aptamers, it is interesting to see although R12.45 Trunc. has a lower reported Kd value from ITC experiments (Kd = 3.7 nM), it failed to demonstrate observable signal changes upon atrazine recognition in all but the free AuNP aggregation assay. On the other hand, although R12.23 Trunc. had a higher estimated Kd from ITC experiments, the in-solution binding responses were much more predictable. This suggests that the binding events between atrazine and the two atrazine binding aptamers are more complicated than the apparent affinity between the species. The calculated LODs for R12.23 Trunc. in all of the AuNP aggregation assays were lower than the estimated Kd. It has been previously reported that AuNP assays tend to enhance the signal response due to localized SPR effects on the gold nanoparticles and thus leads to a much lower LOD, or an overestimated affinity.19 Madianos reported utilizing R12.23 Trunc. as the molecular recognition element in an impedimetric aptasensor. The author reported a linear range of responses from 100 pM to 1 μM and a LOD at 10 pM.28 More recently, Fan et al. developed an electrochemical atrazine aptasensor using nickel hexacyanoferrate nanoparticles and electrochemically reduced graphene oxide.29 The author reported using the full-length R12.23 aptamer as the binding element in the aptasensor and obtained a linear range of response from 0.25 to 250 pM, and a LOD of 0.1 pM. These two studies demonstrated the molecular recognition ability of R12.23 in immobilized biosensing platforms. It also suggested that the apparent affinity of R12.23 (Trunc.) in-solution may not directly relate to its ability to capture atrazine when it is immobilized.
At the time this article was written, there were no reported in-solution biosensing platforms developed using either R12.23 Trunc. or R12.45 Trunc. However, Sun et al. have recently reported using the full-length R12.23 aptamer in a photoelectrochemical aptasensor.30 Unmodified R12.23 aptamer was adsorbed to graphene material to serve as the molecular beacon. The sensing principle depended upon the detachment of the aptamer from the graphene surface and the formation of the atrazine–aptamer complex. The authors reported ultrasensitive detection of atrazine in water samples, with a linear range of responses from 50 fM to 0.3 nM, and a LOD of 12 fM.30 The sensing principle of this aptasensor is similar to our results for R12.23 Trunc. in this study. However, the spontaneous adsorption of ssDNA with both the AuNP and graphene material is very favorable and stable.31,32 To generate a detectable signal, the underlying affinity and structural status between the aptamer and the target must first be favorable enough to overcome the affinity between the aptamer and the AuNP and graphene material, so that the analyzing target can induce aptamer detachment from these solid surface. Additionally, the level of aptamer adsorption and detachment must also be finely tuned in the process. Our results suggested that the free aptamer AuNP assay is likely to be a relatively more universal assay for analyte detection using aptamers and AuNP. Moreover, utilizing different aptamers in a sensing setup may also be an advantage in overcoming the limitations of each aptamer. It is unknown if R12.45 Trunc. would perform well when it is immobilized in a biosensing platform. A large amount of published electrochemical aptasenors utilized the target-induced structural change property of aptamers for the electrical or electrochemical signal generation.33 Because R12.45 Trunc. is uniquely different from R12.23 Trunc. in terms of its structural stabilization upon atrazine binding, it is reasonable to consider integrating R12.45 Trunc. into different biosensing systems in future studies.
Conclusions
This study investigated the in-solution molecular recognition properties of two different atrazine binding aptamers. Our results elucidated the unconventional binding profile of R12.45 Trunc. that we reported in our previous study.17 In summary, R12.23 Trunc. binds to atrazine without conformational changes and is suitable for in-solution biosensing assays. The binding of atrazine to R12.45 Trunc. stabilizes the aptamer secondary structure. This structural stabilization phenomenon prevents signal responses in all but the free AuNP aggregation assay. This key information will be crucial in future studies that examine the sensitivity and specificity of R12.45 Trunc. in real samples, and in the development of aptamer-based biosensing platforms.
Experimental Section
Material
The aptamer sequences were purchased from Eurofins Genomics with polyacrylamide gel electrophoresis purification. Sequences are shown below.
R12.23 Trunc.: 5′-TAC TGT TTG CAC TGG CGG ATT TAG CCA GTC AGT G-3′
R12.45 Trunc.: 5′-ACC GTC TGA GCG ATT CGT ACT TTA TTC GGG AAG GGT ATC AGC GGG G-3′
Atrazine was purchased from Sigma with analytical standards.
CD Studies
The binding characteristics between R12.23 Trunc. and atrazine was studied in a JASCO J-1500 CD spectrophotometer (JASCO). The binding buffer was composed of 10% v/v methanol, 100 mM NaCl, 20 mM Tris-HCl, and 2 mM MgCl2, and at pH 7.4. Baseline was first established by scanning the binding buffer three times with a wavelength range from 210 to 320 nm at 50 nm/min scanning speed. The normalized spectra were obtained by averaging and subtracting from the sample scans. R12.23 Trunc. in 10 μM concentration dissolved in the binding buffer was scanned with the above parameter and served as a control. The same procedure was performed with the solution of 10 μM atrazine and 10 μM aptamer. All experiments were scanned in a 1 mm path length quartz cuvette. Spectra data were averaged and analyzed with the companion software from JASCO.
SG Displacement Assay
The SG assay was performed as adopted from a previously described method.34 Briefly, 10 μM of R12.23 Trunc. was prepared, using 10% methanol binding buffer. The aptamer suspension was denatured by heating to 95 °C for 5 min, followed by snap cooling to 4 °C, and equilibrated at room temperature. To perform the assay, 4 μL of 1 × SG was added to 10 μM of aptamer suspension with a ratio of 1 to 1. The 10% methanol binding buffer was used to prepare the atrazine concentration from 1 nM to 1 μM. Finally, atrazine and the SG-aptamer mixture were combined to the final volume of 125 μL. All samples were loaded in duplicate order in a black bottom 96-well microplate and the fluorescence signal was measured, using a FLx800 microplate reader (BioTek) with excitation at 490 nm and emission at 520 nm. Atrazine, SG-atrazine, and buffer with SG-aptamer were used as negative controls. All recorded fluorescence readings were normalized with ((F – F0)/F0), where F0 was the reading from buffer control. Three independent assays were performed as described.
Adsorbed AuNP Aggregation Assay
The gold nanoparticles were purchased from Nanocomposix with a manufacturer supplied specification of an averaged particle diameter of 9.8 ± 0.8 nm at 9.5 nM particle concentration. The adsorbed gold nanoparticle (AuNPs) assay was performed as described previously with minor modifications.17 Briefly, 6 μL of 10 μM R12.23 Trunc. aptamer stocked in pure water and 135 μL of AuNPs solution were mixed and incubated for 30 min at room temperature. The mixture was centrifuged at 13 000g for 20 min at 4 °C. All samples were kept at the 4 °C centrifuge for an additional 15 min to increase adsorption of the aptamer to AuNPs. The supernatant was discarded and an aliquot of 243 μL of analytes, atrazine, fipronil, propanil, and malathion at 1 μM dissolved in 10% methanol/water (v/v) was combined with the aptamer–gold mixture and briefly vortexed, followed by 15 min incubation at room temperature with rotation. The same volume of 10% methanol/water with aptamer served as the negative control. An aliquot of 6 μL of 1 M NaCl was added to each sample tube and incubated for an additional 10 min at room temperature. Finally, samples were transferred into a clear 96-well plate for absorbance scans at 520 and 650 nm with a μQuant plate reader (BioTek). All samples were prepared in duplicate. Three successful independent assays were performed. The same experiment was performed to characterize the binding activities between R12.45 Trunc. and atrazine.
The exact experimental procedure was carried out for characterizing the binding between R12.23 Trunc. and R12.45 Trunc. with atrazine at concentrations from 5 nM to 100 μM in 10% methanol/water.
Free AuNP Aggregation Assay
The free AuNP assay was adapted from a previously described method with minor modifications.27 Briefly, 3 μL of 10 μM R12.23 Trunc. aptamer stocked in pure water was combined with 72 μL of atrazine at concentrations from 5 nM to 100 μM in 10% methanol/water. The same volume of 10% methanol/water with aptamer served as the negative control. The mixture was incubated on a rotisserie for 30 min at room temperature for the formation of the aptamer–atrazine complex. The solution mixture was then added to 180 μL of the same stock of AuNP solution from Nanocomposix. After an additional 30 min of incubation at room temperature, 6 μL of 1 M NaCl was added to each sample tube for an additional 5 min at room temperature before absorbance measurement. Similarly, all samples were transferred into a clear 96-well plate for absorbance scans at 520 and 650 nm with a μQuant plate reader (BioTek). All samples were prepared in duplicate. Three successful independent assays were performed. The same experiment was performed to on R12.45 Trunc. as well.
Acknowledgments
This work was supported by Wilkes University Faculty Development Type I Grant, Wilkes University Research, and Scholarship Funds. K.M.A., and M.R. were supported in part by Wilkes University Summer Mentoring Grant. The authors would like to acknowledge Dr. Neela Yennawar and Julia Fecko from the Penn State Automated Biological Calorimetry Facility—University Park, PA for their assistance with the ITC and NSF-MRI award DBI-0922974 (Bevilacqua et al. 2009). The authors would also like to thank Nevina Trunzo for English editing.
Supporting Information Available
The Supporting Information is available free of charge on the ACS Publications website at DOI: 10.1021/acsomega.9b02414.
Binding thermodynamic values of ITC experiments; principle of the SYBR Green assays; linear calibration curve of R12.23 Trunc. in adsorbed AuNP aggregation assay; principle of the adsorbed and free AuNP aggregation assays; and linear calibration curves of R12.23 Trunc. and R12.45 Trunc. in free AuNP aggregation assay (PDF)
The authors declare no competing financial interest.
Supplementary Material
References
- Hayes T. B.; Khoury V.; Narayan A.; Nazir M.; Park A.; Brown T.; Adame L.; Chan E.; Buchholz D.; Stueve T.; Gallipeau S. Atrazine induces complete feminization and chemical castration in male African clawed frogs (Xenopus laevis). Proc. Natl. Acad. Sci. U.S.A. 2010, 107, 4612. 10.1073/pnas.0909519107. [DOI] [PMC free article] [PubMed] [Google Scholar]
- Brassard M. G.; Stavola A.; Lin J.; Turner L.. Atrazine: Analysis of Risks; USEP Agency, 2003.
- Colleen M.; Rossmeisl F. T. F.; Hetrick J. A.; et al. Refined Ecological Risk Assessment for Atrazine; Office of Chemical Safety and Pollution Prevention Agency, 2016.
- Wang L.; Samac D. A.; Shapir N.; Wackett L. P.; Vance C. P.; Olszewski N. E.; Sadowsky M. J. Biodegradation of atrazine in transgenic plants expressing a modified bacterial atrazine chlorohydrolase (atzA) gene. Plant Biotechnol. J. 2005, 3, 475–486. 10.1111/j.1467-7652.2005.00138.x. [DOI] [PubMed] [Google Scholar]
- Tillitt D. E.; Papoulias D. M.; Whyte J. J.; Richter C. A. Atrazine reduces reproduction in fathead minnow (Pimephales promelas). Aquat. Toxicol. 2010, 99, 149–159. 10.1016/j.aquatox.2010.04.011. [DOI] [PubMed] [Google Scholar]
- Friedmann A. S. Atrazine inhibition of testosterone production in rat males following peripubertal exposure. Reprod. Toxicol. 2002, 16, 275–279. 10.1016/s0890-6238(02)00019-9. [DOI] [PubMed] [Google Scholar]
- Kucka M.; Pogrmic-Majkic K.; Fa S.; Stojilkovic S. S.; Kovacevic R. Atrazine acts as an endocrine disrupter by inhibiting cAMP-specific phosphodiesterase-4. Toxicol. Appl. Pharmacol. 2012, 265, 19–26. 10.1016/j.taap.2012.09.019. [DOI] [PMC free article] [PubMed] [Google Scholar]
- Williams R.; Crihfield C.; Gattu S.; Holland L.; Sooter L. In Vitro Selection of a Single-Stranded DNA Molecular Recognition Element against Atrazine. Int. J. Mol. Sci. 2014, 15, 14332–14347. 10.3390/ijms150814332. [DOI] [PMC free article] [PubMed] [Google Scholar]
- Wang P.; Wan Y.; Ali A.; Deng S.; Su Y.; Fan C.; Yang S. Aptamer-wrapped gold nanoparticles for the colorimetric detection of omethoate. Sci. China Chem. 2016, 59, 237–242. 10.1007/s11426-015-5488-5. [DOI] [Google Scholar]
- Lv X.; Zhang Y.; Liu G.; Du L.; Wang S. Aptamer-based fluorescent detection of ochratoxin A by quenching of gold nanoparticles. RSC Adv. 2017, 7, 16290–16294. 10.1039/c7ra01474k. [DOI] [Google Scholar]
- Zheng D.; Zou R.; Lou X. Label-Free Fluorescent Detection of Ions, Proteins, and Small Molecules Using Structure-Switching Aptamers, SYBR Gold, and Exonuclease I. Anal. Chem. 2012, 84, 3554–3560. 10.1021/ac300690r. [DOI] [PubMed] [Google Scholar]
- Hong K. L.; Sooter L. J. Single-Stranded DNA Aptamers against Pathogens and Toxins: Identification and Biosensing Applications. BioMed Res. Int. 2015, 2015, 419318. 10.1155/2015/419318. [DOI] [PMC free article] [PubMed] [Google Scholar]
- Ellington A. D.; Szostak J. W. In vitro selection of RNA molecules that bind specific ligands. Nature 1990, 346, 818–822. 10.1038/346818a0. [DOI] [PubMed] [Google Scholar]
- Tuerk C.; Gold L. Systematic evolution of ligands by exponential enrichment: RNA ligands to bacteriophage T4 DNA polymerase. Science 1990, 249, 505–510. 10.1126/science.2200121. [DOI] [PubMed] [Google Scholar]
- Nutiu R.; Li Y. In vitro selection of structure-switching signaling aptamers. Angew. Chem. 2005, 44, 1061–1065. 10.1002/anie.200461848. [DOI] [PubMed] [Google Scholar]
- Park J.-W.; Tatavarty R.; Kim D. W.; Jung H.-T.; Gu M. B. Immobilization-free screening of aptamers assisted by graphene oxide. Chem. Commun. 2012, 48, 2071–2073. 10.1039/c2cc16473f. [DOI] [PubMed] [Google Scholar]
- Abraham K. M.; Roueinfar M.; Ponce A. T.; Lussier M. E.; Benson D. B.; Hong K. L. Vitro Selection and Characterization of a Single-Stranded DNA Aptamer Against the Herbicide Atrazine. ACS Omega 2018, 3, 13576–13583. 10.1021/acsomega.8b01859. [DOI] [PMC free article] [PubMed] [Google Scholar]
- Sanchez P. E.DNA Aptamer Development for Detection of Trazine and Protective Antigen Toxin using Fluorescence Polarization, UC Riverside Electronic Theses and Dissertations, 2012. [Google Scholar]
- McKeague M.; De Girolamo A.; Valenzano S.; Pascale M.; Ruscito A.; Velu R.; Frost N. R.; Hill K.; Smith M.; McConnell E. M.; DeRosa M. C. Comprehensive analytical comparison of strategies used for small molecule aptamer evaluation. Anal. Chem. 2015, 87, 8608–8612. 10.1021/acs.analchem.5b02102. [DOI] [PubMed] [Google Scholar]
- Hickey K. M.Analytical and Computational Methods for the Assessment of Biological Molecules and their Binding Interactions: Case Studies in DNA Aptamer-Target Binding and P450-P450 Dimerization, Dissertation, West Virginia University Morgantown, West Virginia, 2015. [Google Scholar]
- Wiseman T.; Williston S.; Brandts J. F.; Lin L.-N. Rapid measurement of binding constants and heats of binding using a new titration calorimeter. Anal. Biochem. 1989, 179, 131–137. 10.1016/0003-2697(89)90213-3. [DOI] [PubMed] [Google Scholar]
- Dutta A. K.; Rösgen J.; Rajarathnam K. Using isothermal titration calorimetry to determine thermodynamic parameters of protein-glycosaminoglycan interactions. Methods Mol. Biol. 2015, 1229, 315–324. 10.1007/978-1-4939-1714-3_25. [DOI] [PMC free article] [PubMed] [Google Scholar]
- Zhang Z.; Oni O.; Liu J. New insights into a classic aptamer: binding sites, cooperativity and more sensitive adenosine detection. Nucleic Acids Res. 2017, 45, 7593–7601. 10.1093/nar/gkx517. [DOI] [PMC free article] [PubMed] [Google Scholar]
- Zuker M. Mfold web server for nucleic acid folding and hybridization prediction. Nucleic Acids Res. 2003, 31, 3406–3415. 10.1093/nar/gkg595. [DOI] [PMC free article] [PubMed] [Google Scholar]
- Patel D. J.; Suri A. K.; Jiang F.; Jiang L.; Fan P.; Kumar R. A.; Nonin S. Structure, recognition and adaptive binding in RNA aptamer complexes. J. Mol. Biol. 1997, 272, 645–664. 10.1006/jmbi.1997.1281. [DOI] [PubMed] [Google Scholar]
- Chávez J. L.; MacCuspie R. I.; Stone M. O.; Kelley-Loughnane N. Colorimetric detection with aptamer-gold nanoparticle conjugates: effect of aptamer length on response. J. Nanopart. Res. 2012, 14, 1166. 10.1007/s11051-012-1166-0. [DOI] [Google Scholar]
- Smith J. E.; Griffin D. K.; Leny J. K.; Hagen J. A.; Chávez J. L.; Kelley-Loughnane N. Colorimetric detection with aptamer-gold nanoparticle conjugates coupled to an android-based color analysis application for use in the field. Talanta 2014, 121, 247–255. 10.1016/j.talanta.2013.12.062. [DOI] [PubMed] [Google Scholar]
- Madianos L.; Tsekenis G.; Skotadis E.; Patsiouras L.; Tsoukalas D. A highly sensitive impedimetric aptasensor for the selective detection of acetamiprid and atrazine based on microwires formed by platinum nanoparticles. Biosens. Bioelectron. 2018, 101, 268–274. 10.1016/j.bios.2017.10.034. [DOI] [PubMed] [Google Scholar]
- Fan L.; Zhang C.; Yan W.; Guo Y.; Shuang S.; Dong C.; Bi Y. Design of a facile and label-free electrochemical aptasensor for detection of atrazine. Talanta 2019, 201, 156–164. 10.1016/j.talanta.2019.03.114. [DOI] [PubMed] [Google Scholar]
- Sun C.; Liu M.; Sun H.; Lu H.; Zhao G. Immobilization-free photoelectrochemical aptasensor for environmental pollutants: Design, fabrication and mechanism. Biosens. Bioelectron. 2019, 140, 111352. 10.1016/j.bios.2019.111352. [DOI] [PubMed] [Google Scholar]
- He S.; Song B.; Li D.; Zhu C.; Qi W.; Wen Y.; Wang L.; Song S.; Fang H.; Fan C. A Graphene Nanoprobe for Rapid, Sensitive, and Multicolor Fluorescent DNA Analysis. Adv. Funct. Mater. 2010, 20, 453–459. 10.1002/adfm.200901639. [DOI] [Google Scholar]
- Su X.; Kanjanawarut R. Control of Metal Nanoparticles Aggregation and Dispersion by PNA and PNA–DNA Complexes, and Its Application for Colorimetric DNA Detection. ACS Nano 2009, 3, 2751–2759. 10.1021/nn9005768. [DOI] [PubMed] [Google Scholar]
- Sassolas A.; Blum L. J.; Leca-Bouvier B. D. Electrochemical Aptasensors. Electroanalysis 2009, 21, 1237–1250. 10.1002/elan.200804554. [DOI] [Google Scholar]
- McKeague M.; Velu R.; Hill K.; Bardóczy V.; Mészáros T.; DeRosa M. Selection and characterization of a novel DNA aptamer for label-free fluorescence biosensing of ochratoxin A. Toxins 2014, 6, 2435–2452. 10.3390/toxins6082435. [DOI] [PMC free article] [PubMed] [Google Scholar]
Associated Data
This section collects any data citations, data availability statements, or supplementary materials included in this article.


