Abstract
Immunoassays for circulating leptin are important research tools for examining the role and regulation of leptin expression in human obesity. However, uncertainty exists regarding the comparability between studies of reported plasma or serum leptin concentrations. The purpose of the present study was to directly compare plasma leptin concentrations by using two of the most widely reported immunoassay methods—namely, a commercially available radioimmunoassay (RIA) and a proprietary enzyme-linked immunosorbent assay (ELISA). Plasma leptin concentrations were measured in healthy lean and obese volunteers and in patients with Prader-Willi syndrome (PWS). Over a wide range of plasma concentrations (2 to 70 ng/mL), leptin measurements obtained with the RIA and ELISA methods were highly correlated (r = 0.957, P < .0001) and were essentially indistinguishable. Leptin levels measured by RIA and ELISA were highly correlated with body mass index (BMI) overall (r = 0.784, P < .0001 and r = 0.732, P < .0001, respectively) and in the lean and obese subgroups. When compared with the results in the lean individuals (mean ± SEM, 11.6 ± 3.2 ng/mL), plasma leptin was significantly higher in both the obese (35.5 ± 4.0 ng/mL, P < .0001) and the PWS subjects (30.7 ± 6.9 ng/mL, P < .05). However, after we controlled for differences in BMI, the leptin levels were similar in all three groups. In conclusion, we found that the RIA and ELISA used in the present study yield plasma leptin concentrations that are essentially indistinguishable. Our findings should facilitate comparisons of leptin levels measured by these two widely used immunoassays in previous and future studies that examine the role of leptin in body weight regulation. (J Lab Clin Med 1999;133:75–80)
Leptin is the circulating protein product of the recently cloned obese gene and is secreted exclusively by adipose tissue.1 The secreted peptide functions as a hormone with receptors in a variety tissues including the hypothalamus, where it is thought to regulate appetite, energy expenditure, and adiposity.2 The administration of recombinant leptin to obese, leptin-deficient ob/ob mice results in striking reductions in food intake, body weight, and adiposity.3–5 In contrast, the phenotypically similar db/db mice, which are characterized by hyperleptinemia and a mutation in the leptin receptor,6 demonstrate complete resistance to the metabolic actions of recombinant leptin even at high doses.4,5 In human beings, circulating leptin levels are highly correlated with adiposity, suggesting that leptin resistance may be a factor in human obesity.7
PWS, the most-common genetic syndrome associated with obesity, is characterized by hypothalamic dysfunction, hyperphagia, hypometabolism, and physical inactivity.8,9 The phenotypic similarities between PWS and ob/ob and db/db mice raise the possibility that either leptin deficiency or severe leptin resistance may contribute to the early-onset, severe obesity in PWS. Recently, however, three groups using different immunoassay methods measured circulating leptin concentrations in PWS patients and reported that leptin levels were appropriately elevated for their degree of adiposity when compared with equally obese control subjects.10–12
A variety of immunoassay methods have been reported for measuring plasma or serum leptin concentrations in human subjects. These methods include several RIAs,7,13–15 an ELISA,16 and a Western blot assay.17 However, few studies have attempted to directly compare leptin values obtained with the available methods in human subjects of varying adiposity.13,15 As pointed out by Nagy and Gower,18 the comparison of leptin values between published studies should be approached with caution because of the differing assay methods and the lack of standardization of leptin measurements. Therefore, the purpose of the present study was to directly compare plasma leptin values in lean, obese, and PWS subjects with the two most-widely published assay methods, a commercially available RIA and a proprietary ELISA.
METHODS
Experimental subjects and procedures.
The study participants included lean (n = 8), obese (n = 10), and PWS (n = 4) subjects. Clinical characteristics of the subject groups are summarized in Table I. All subjects were weight stable, were nondiabetic, and were not restricting their caloric intake. None were taking any medications known to affect metabolism. The diagnosis of PWS was based on the criteria of Holm et al19 and was confirmed by chromosomal and molecular genetic analysis.9 Obesity was defined as a BMI > 27.3 for males and > 27.8 for females.20 Height was recorded to the nearest 0.5 cm and weight to the nearest 0.1 kg. Venous blood samples were collected in standard EDTA-anticoagulated tubes after an overnight fast. Plasma was promptly separated by centrifugation at 4° C, and samples were stored at −70° C until analysis. Written informed consent was obtained before participation from each subject or from a parent or legal guardian when appropriate. The protocol was reviewed and approved by the Institutional Review Board of Vanderbilt University.
Table I.
Subject characteristics
| Lean | Obese | PWS | |
|---|---|---|---|
| Gender (M/F) | 2M/6F | 1M/9F | 1M/3F |
| Age (y) | 31 ± 5 | 36 ± 5 | 12 ± 3 |
| Weight (kg) | 70 ± 4 | 82 ± 3* | 54 ± 10† |
| Height (cm) | 168 ± 3 | 162 ± 2 | 137 ± 10‡§ |
| BMI (kg/m2) | 24 ± 1 | 31 ± 1 ‖ | 28 ± 2 ‡ |
Values are expressed as mean ± SEM.
PWS, Prader-Willi syndrome; M, male; F, female.
P < .01 versus lean group.
P < .01 versus obese group.
P < .05 versus lean group.
P < .05 versus obese group.
Measurement of plasma leptin by RIA.
Leptin concentrations in plasma were measured by a sensitive and specific RIA (Linco Research Inc, St. Louis, MO) as described by Ma et al.13 The anti-leptin antiserum is polyclonal in nature and raised in rabbits against highly purified, full-length recombinant human leptin. This antiserum does not cross-react with insulin, insulin-like growth factors I and II, glucagon, or interleukin-2.21 The iodine 125-labeled tracer and the calibrators used to generate the standard curve (0.5, 1, 2, 5, 10, 20, 50, 100) were prepared with recombinant human leptin. Duplicate aliquots (100 μL) of leptin standards or plasma samples were mixed with 125I-labeled leptin (about 20,000 cpm) and then incubated with anti-leptin antibodies at 4° C for 24 hours. The bound fraction was then precipitated with anti-rabbit immunoglobulin G and polyethylene glycol. The supernatant was decanted and the pellet counted on a gamma counter to determine bound radioactivity. The log values of the standards were plotted against the known bound counts divided by the zero standard bound counts (B/Bo) to generate the standard curve for calculation of the unknowns. The standard curve was linear up to 100 ng/mL (r2 = 0.996) with a limit of detection of 0.5 ng/mL. The within-assay CVs were 1.2% and 3.0% for the “low” (2.7 ng/mL) and “high” (14.6 ng/mL) controls, respectively. The between-assay CVs were 8.6% and 4.2% for the low and high controls, respectively.
Measurement of plasma leptin by ELISA.
Duplicate plasma samples from each subject were also analyzed by a solid-phase sandwich ELISA with an affinity-purified polyvalent antibody immobilized in microtiter wells as described by Rosenbaum et al.16 Bound leptin was detected with affinity-purified antibody conjugated to horseradish peroxidase and quantified by a chromogenic substrate. The limit of detection was 20 pg/mL, and the within-assay and between-assay CVs were 9.2% and 6.5%, respectively.16 Plasma leptin measurements by ELISA from some of the subjects in the present study have been reported previously.12
Calculations and statistics.
BMI. an index of adiposity, was calculated as follows: weight [kg] divided by height [meters]2,22 Quantitative data are expressed as group means ± SEM. Differences between groups were analyzed with Student’s t tests or Mann-Whitney ranked sum tests for nonparametric data. Relationships between leptin and various independent variables were analyzed by using Pearson product moment correlation coefficients and simple linear and multiple linear regression methods. All statistical analyses were performed with SPSS for Windows (version 8.0, SPSS Inc, Chicago, IL).
RESULTS
Subject characteristics.
The physical characteristics of the study participants are summarized in Table I. Female subjects predominated in all three groups. The lean and obese subjects were similar in age and height. Compared with subjects in the other groups, the PWS subjects were significantly younger and shorter (Table I). BMI was similar between the obese and PWS groups.
Comparison of plasma leptin measurements with RIA and ELISA methods.
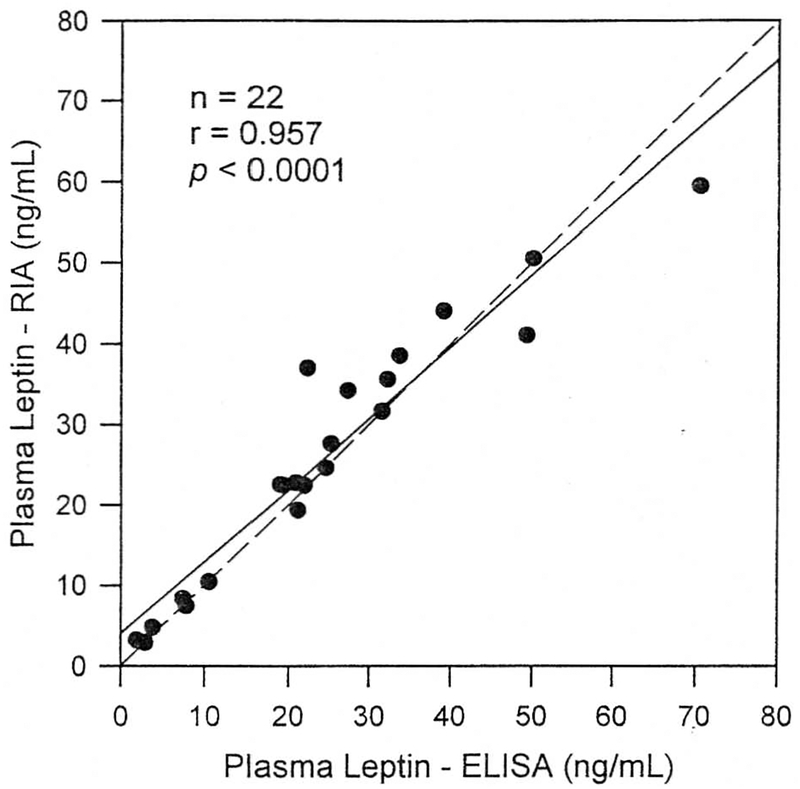
Plasma leptin determinations with the RIA and ELISA methods are compared in Fig 1. After the overnight fast, leptin concentrations were easily detectable in all subjects by both methods and ranged between 2 and 70 ng/mL. Mean (± SEM) plasma leptin levels in all participants were 25.9 ± 3.4 ng/mL by the RIA method and 24.7 ± 3.6 ng/mL with the ELISA (P = not significant). Leptin determinations by the RIA and ELISA methods were highly correlated (r = 0.957. P < .000l)(Fig 1). As shown in Fig 1, the regression line describing the relationship between the two measurements was not significantly different from the line of identity.
Fig 1.
Comparison of plasma leptin concentrations measured with RIA (y axis) and ELISA (x axis) methods in lean, obese, and PWS subjects. Solid line. Linear regression line; dashed line, line of identity.
Relationship between leptin and BMI in the lean, obese, and PWS groups.
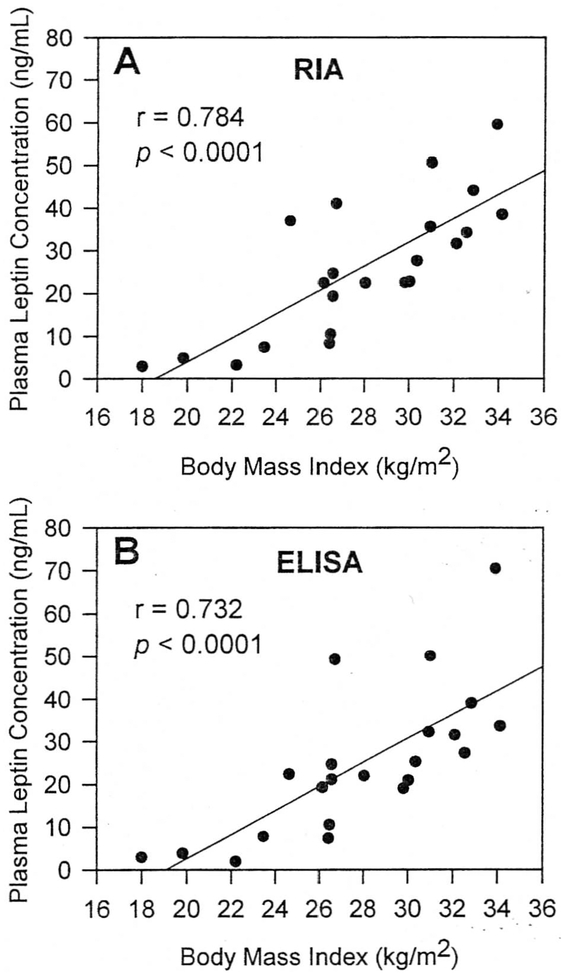
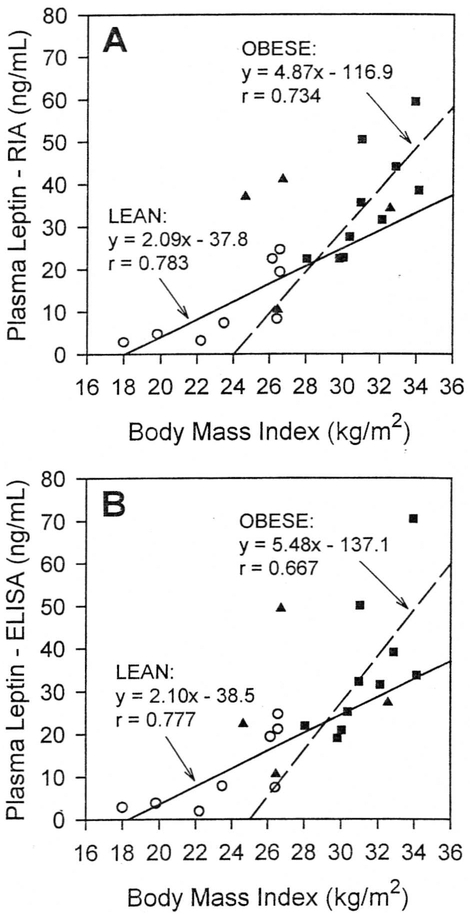
The relationships between leptin measurements when using the RIA and ELISA methods and BMI are shown in Figs 2 and 3. In the entire group of study participants, measured leptin concentrations were highly correlated with BMI for both RIA and ELISA methods (r = 0.784 and r = 0.732, respectively; both P < .0001). The relationship between leptin and BMI was equally strong with both assay methods (Fig 2). When the lean subjects were analyzed separately, leptin levels by either method remained significantly related to BMI (Fig 3). Similarly, in the obese group, BMI was strongly correlated with plasma leptin by either RIA or ELISA methods (Fig 3). However, the slopes of the regression lines relating leptin and BMI were steeper in the obese group than in the lean group (Fig 3). The rate of increase in plasma leptin concentrations as a function of BMI was approximately 2.5-fold greater in the obese subjects for both the RIA (4.87 vs 2.09 ng/mL per unit BMI) and the ELISA (5.48 vs 2.10 ng/mL per unit BMI) methods.
Fig 2.
Relationships between plasma leptin and BMI in lean, obese, and PWS subjects. Plasma leptin concentrations were measured with RIA (A) and ELISA (B) methods.
Fig 3.
Relationships between plasma leptin and BMI in lean (○), obese (■), and PWS (▲) subjects. Plasma leptin concentrations were measured with RIA (A) and ELISA (B) methods. Solid line, linear regression line for lean group; dashed line, linear regression line for obese group.
Differences in plasma leptin levels between lean, obese, and PWS groups.
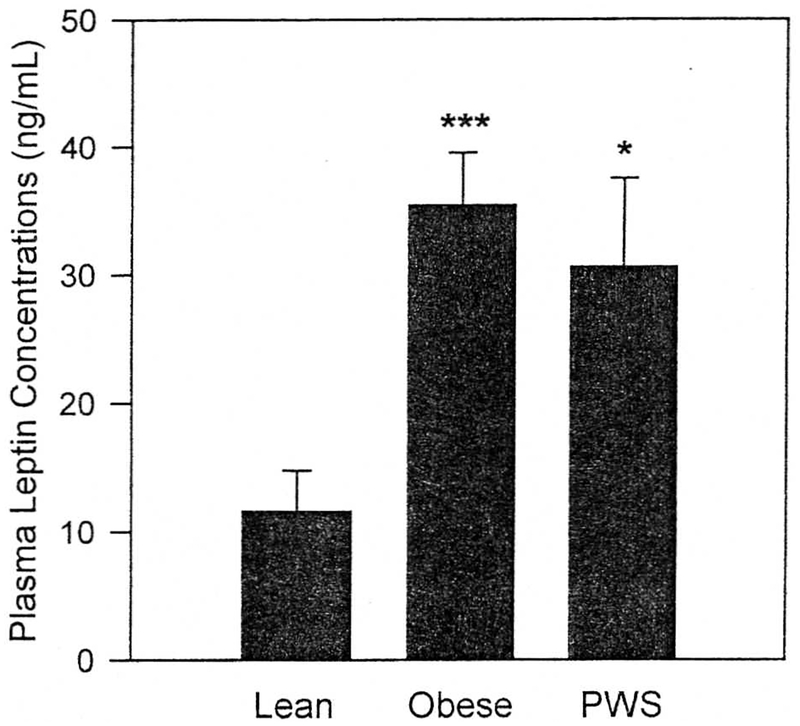
Plasma leptin concentrations measured by RIA in the lean, obese, and PWS groups are shown in Fig 4. Compared with levels in the lean subjects (11.6 ± 3.2 ng/mL). leptin levels were significantly greater in both the obese group (35.5 ± 4.0 ng/mL, P < .0001) and the PWS group (30.7 ± 6.9 ng/mL, P < .05). In contrast, plasma leptin concentrations were similar in the obese and PWS groups (Fig 4). The group differences in leptin were fully attributable to the differences in BMI between the groups. After we controlled for the influence of BMI in a multiple-regression analysis, there were no differences in plasma leptin between the lean, obese, and PWS groups.
Fig 4.
Mean (± SEM) plasma leptin concentrations in lean (n = 8), obese (n = 10), and PWS (n = 4) subjects. Leptin levels were measured by RIA. *P < .05, *** P < .0001 versus lean.
DISCUSSION
The measurement of leptin in serum or plasma represents an important research tool for investigating the role of leptin in body weight regulation and obesity development in human subjects. A variety of methods exist for the measurement of circulating leptin in human subjects. RIA,7,13–15 ELISA,16 and Western blot17 methods have been described by different groups using commercially available or proprietary reagents. However, few studies have compared leptin measurements when using the different assays. This information is critical for enabling the direct comparison of leptin data from published studies in lean and obese human subjects under a variety of physiologic and nutritional conditions. In the present study we report the first direct comparison of plasma leptin measurements in lean and obese human subjects and patients with PWS when using the two most widely published analytic methods, a commercially available RIA13 and a proprietary ELISA.16
Our findings clearly demonstrate that the two leptin assays described yield plasma leptin measurements that are statistically indistinguishable (Fig 1). Over a wide concentration range (2 to 70 ng/mL) in lean and obese human subjects, plasma leptin determinations obtained with these two analytic methods were highly correlated (r = 0.957, P < .0001; Fig 1). Moreover, the relationships between body adiposity (ie, BMI) and plasma leptin measurements in the subjects studied were identical with the RIA and ELISA methods (Figs 2 and 3). Our data indicate that circulating leptin levels reported in previous and future studies when using these two widely utilized assays should be directly comparable. However, this appears not to be the case for the other available leptin immunoassays.
Two previous studies have also directly compared other leptin immunoassays with very different results.13,15 Horn et al15 compared the RIA method used in the present study with an RIA they developed by utilizing anti-leptin antibodies raised against the C-terminal fragment of the peptide (leptin126–140). Although the results of the two RIA methods correlated well, the measured concentrations when using the C-terminal RIA were 8-fold lower. These authors speculated that their RIA measured only free (unbound) leptin, whereas the commercial RIA utilizing antibodies to full-length leptin measured both bound and free leptin fractions. In another study, Ma et al13 compared the leptin RIA utilized in the present study with the Western blot method of Maffei et al17 and found only weak agreement between the two assays. Moreover, the sensitivity of the Western blot method for leptin quantitation was clearly inferior, with a detection limit 40-fold higher than the RIA method (20 vs 0.5 ng/mL).13 When coupled with our findings, these two previous reports indicate that neither the RIA of Horn et al nor the Western blot method of Maffei et al yields leptin measurements that are directly comparable to the more widely utilized RIA and ELISA analytic methods described in the present study. Thus caution still must be exercised when attempting to compare leptin measurements in human subjects when using some assay methods.
It is now well established that circulating leptin concentrations in human beings are mainly determined by body adiposity. In the present study we found that plasma leptin levels were highly correlated with BMI in healthy lean and obese human subjects. A significant relationship between leptin and BMI in human beings has been reported in many,7,10–17 but not all.23 previous studies that used a variety of assay methods. In contrast to two recent reports15,24 in which leptin was related to BMI in obese but not lean individuals, we found that leptin levels were significantly related to BMI in both lean and obese human subjects (Fig 3). However, the slope of the regression line describing the relationship between leptin and BMI was ~2.5-fold greater in the obese subjects than in the lean individuals (Fig 3). This finding, along with differences in study populations and the imperfection of BMI as an index of adiposity,22 probably explains the discrepancies noted above between the present study and previous reports regarding the relationship between leptin and BMI. Nevertheless, our results confirm that even in lean individuals, body adiposity is the most important determinant of circulating leptin levels in human beings.
Morbid obesity is a characteristic feature of PWS.8,9 The phenotypic similarities between PWS and leptin-deficient (eg, ob/ob mice) or leptin-resistant (eg, db/db mice) genetic models of obesity in rodents suggested that PWS may also be associated with severe dysregulation of leptin expression. However, we and others10–12 found that circulating leptin levels in PWS were not different from those in healthy obese human subjects matched for body adiposity (Fig 4). Thus the severe hyperphagia and hypometabolism characteristic of PWS do not appear to be caused primarily by either leptin deficiency or severe leptin resistance. However, Isotani et al25 recently reported that the normal diurnal variation in circulating leptin was absent in a PWS patient, suggesting that the regulation of leptin secretion may be abnormal in PWS. Hence additional studies will be necessary to better define the determinants of plasma leptin concentrations in individuals with PWS.
In summary, we report the first study to directly compare plasma leptin measurements in healthy lean and obese human subjects and patients with PWS when using two widely utilized immunoassays, a commercially available RIA13 and a proprietary ELISA.16 These two methods yielded leptin measurements that were essentially identical over a wide concentration range (2 to 70 ng/mL). Moreover, leptin determinations with both immunoassay methods were highly correlated with BMI in the lean and obese human subjects studied. Finally, we have confirmed that circulating leptin concentrations in PWS are similar to those found in typical obese human subjects of comparable adiposity. Our findings should facilitate comparisons of leptin levels measured by these two widely utilized immunoassays in previous and future studies examining the role of leptin in body weight regulation in human subjects.
Acknowledgments
We thank Dr Margery Nicolson of Amgen Inc, Thousand Oaks, CA, for providing the ELISA measurements of plasma leptin concentrations.
Supported by National Institutes of Health grants P01-HD30329, P60-DK20593, and R29-DK47879 (M.G.C.).
Abbreviations:
- BMI
body mass index
- CV
coefficient of variation
- ELISA
enzyme-linked immunosorbent assay
- PWS
Prader-Willi syndrome
- RIA
radioimmunoassay
REFERENCES
- 1.Zhang Y, Proenca R, Maffei M, Barone M. Leopold L, Friedman JM. Positional cloning of the mouse obese gene and its human homologue. Nature 1994;372:425–32. [DOI] [PubMed] [Google Scholar]
- 2.Tartaglia LA, Dembski M, Weng X, Deng N. Culpepper J, Devos R, et al. Identification and expression cloning of a leptin receptor, OB-R. Cell 1995;83:1263–71. [DOI] [PubMed] [Google Scholar]
- 3.Pelleymounter MA, Cullen MJ, Baker MB. Hecht R, Winters D, Boone T, et al. Effects of the obese gene product on body weight regulation in mice. Science 1995;269:540–3. [DOI] [PubMed] [Google Scholar]
- 4.Halaas JL, Gajiwala KS, Maffei M, Cohen SL, Chait BT, Rabinowitz D, et al. Weight-reducing effects of the plasma protein encoded by the obese gene. Science 1995;269:543–6. [DOI] [PubMed] [Google Scholar]
- 5.Campfield LA, Smith FJ, Guisez Y, Devos R, Burn P. Recombinant mouse OB protein: evidence for a peripheral signal linking adiposity and central neural networks. Science 1995;269:546–9. [DOI] [PubMed] [Google Scholar]
- 6.Chen H, Charlat O, Tartaglia LA, Woolf EA, Weng X, Ellis SJ, et al. Evidence that the diabetes gene encodes the leptin receptor: identification of a mutation in the leptin receptor gene in db/db mice. Cell 1996;84:491–5. [DOI] [PubMed] [Google Scholar]
- 7.Considine RV, Sinha MK, Heiman ML. Kriauciunas A, Stephens TW, Nyce MR, et al. Serum immunoreactive-leptin concentrations in normal-weight and obese humans. N Engl J Med 1996;334:292–5. [DOI] [PubMed] [Google Scholar]
- 8.Bray GA, Dahms WT, Swerdloff RS, Fiser RH, Atkinson RL, Carrel RE. The Prader-Willi syndrome. Medicine 1983;62:59–80. [PubMed] [Google Scholar]
- 9.Butler MG. Prader-Willi syndrome: current understanding of cause and diagnosis. Am J Med Genet 1990;35:319–32. [DOI] [PMC free article] [PubMed] [Google Scholar]
- 10.Weigle DS, Ganter SL, Kuijper JL, Leonetti DL, Boyko EJ, Fujimoto WY. Effect of regional fat distribution and Prader-Willi syndrome on plasma leptin levels. J Clin Endocrinol Metab 1997;82:566–70. [DOI] [PubMed] [Google Scholar]
- 11.Lindgren AC, Marcus C, Skwirut C, Elimam A, Hagenas L. Schalling M, et al. Increased leptin messenger RNA and serum leptin levels in children with Prader-Willi syndrome and nonsyndromal obesity. Pediatr Res 1997;42:593–6. [DOI] [PubMed] [Google Scholar]
- 12.Butler MG, Moore J, Morawiecki A, Nicolson M. Comparison of leptin protein levels in Prader-Willi syndrome and control individuals. Am J Med Genet 1998;75:7–12. [PMC free article] [PubMed] [Google Scholar]
- 13.Ma Z, Gingerich RL, Santiago JV, Klein S, Smith CH, Landt M. Radioimmunoassay of leptin in human plasma. Clin Chem 1996;42:942–6. [PubMed] [Google Scholar]
- 14.McGregor GP. Desaga JF, Ehlenz K, Fischer A, Heese F, Hegele A, et al. Radioimmunological measurement of leptin in plasma of obese and diabetic human subjects. Endocrinology 1996;137:1501–3. [DOI] [PubMed] [Google Scholar]
- 15.Horn R, Geldszus R, von zur Mühlen A, Brabant G. Radioimmunoassay for the detection of leptin in human serum. Exp Clin Endocrinol Diabet 1996;104:454–8. [DOI] [PubMed] [Google Scholar]
- 16.Rosenbaum M. Nicolson M, Hirsch J, Heymsfield SB, Gallagher D, Chu F, et al. Effects of gender, body composition, and menopause on plasma concentrations of leptin. J Clin Endocrinol Metab 1996;81:3424–7. [DOI] [PubMed] [Google Scholar]
- 17.Maffei M, Halaas J, Ravussin E, Pratley RE, Lee GH, Zhang Y. et al. Leptin levels in human and rodent: measurement of plasma leptin and ob RNA in obese and weight-reduced subjects. Nature Med 1995;1:1155–61. [DOI] [PubMed] [Google Scholar]
- 18.Nagy TR, Gower BA. Correlates of leptin concentration in the San Antonio Heart Study. Ann Epidemiol 1997;7:79–80. [DOI] [PubMed] [Google Scholar]
- 19.Holm VA, Cassidy SB, Butler MG, Hanchett JM, Greenswag LR, Whitman BY, et al. Diagnostic criteria for Prader-Willi syndrome. Pediatrics 1993;91:201–6. [PMC free article] [PubMed] [Google Scholar]
- 20.National Institutes of Health Consensus Development Panel on the Health Implications of Obesity. Consensus conference statement. Ann Intem Med 1995;103:1073–7. [Google Scholar]
- 21.Lahlou N, Landais P, De Boissieu D, Bougneres PF. Circulating leptin in normal children and during the dynamic phase of juvenile obesity: relation to body fatness, energy metabolism, caloric intake, and sexual dimorphism. Diabetes 1997;46:989–93. [DOI] [PubMed] [Google Scholar]
- 22.Hannan WJ. Wrate RM, Cowen SJ, Freeman CPL. Body mass index as an estimate of body fat. Int J Eat Disord 1995;18:91–7. [DOI] [PubMed] [Google Scholar]
- 23.Laughlin GA. Yen SSC. Hypolepdnemia in women athletes: absence of a diurnal rhythm with amenorrhea. J Clin Endocrinol Metab 1997;82:318–21. [DOI] [PubMed] [Google Scholar]
- 24.Dagogo-Jack S. Fanelli C, Paramore D, Brothers J, Landt M. Plasma leptin and insulin relationships in obese and nonobese humans. Diabetes 1996;45:695–8. [DOI] [PubMed] [Google Scholar]
- 25.Isotani H, Kameoka K, Furukawa K. Daily profile of serum leptin in Prader-Willi syndrome complicated by diabetes mellitus: a case report. Horm Metab Res 1997;29:611–2. [DOI] [PubMed] [Google Scholar]


