

Summary
N6-methyladenosine (m6A) modification occurs co-transcriptionally and impacts pre-mRNA processing, however the mechanism of co-transcriptional m6A-dependent alternative splicing regulation is still poorly understood. HnRNPG is an m6A reader protein that binds RNA through RRM and Arg-Gly-Gly (RGG) motifs. Here, we show that hnRNPG directly binds to the phosphorylated carboxy-terminal domain (CTD) of RNA polymerase II (RNAPII) using RGG motifs in its low-complexity region. Through interactions with the phosphorylated CTD and nascent RNA, hnRNPG associates co-transcriptionally with RNAPII and regulates alternative splicing transcriptome-wide. m6A near splice sites in nascent premRNA modulate hnRNPG binding, which influences RNAPII occupancy patterns and promotes exon inclusion. Our results reveal an integrated mechanism of co-transcriptional m6A-mediated splicing regulation, in which an m6A reader protein uses RGG motifs to co-transcriptionally interact with both RNAPII and m6A-modified nascent pre-mRNA to modulate RNAPII occupancy and alternative splicing.
In Brief
Zhou et al. show that the m6A reader protein hnRNPG interacts with m6A-modified nascent pre-mRNA and the phosphorylated C-terminal domain of RNA polymerase II to regulate alternative splicing. These interactions depend on an RGG region in the low-complexity region of hnRNPG.
Introduction
The carboxy-terminal domain (CTD) of RNA polymerase II (RNAPII) plays a crucial role coordinating co-transcriptional processes with transcription (Bentley, 2014). The CTD is composed of tandem heptad repeats that undergo various post-translational modifications, including phosphorylation of Ser5 by cyclin-dependent kinase 7 (CDK7) during promoter escape, and phosphorylation of Ser2 by CDK9 upon promoter-proximal pause release (Harlen and Churchman, 2017). The various phosphorylation states of the CTD coordinate co-transcriptional processes with the stages of transcription: Ser5 phosphorylated CTD (S5P-CTD) recruits 5′ capping factors at the 5′ end of the gene; Ser2 phosphorylated CTD (S2P-CTD) recruits constitutive splicing factors in the gene body and 3′ cleavage and polyadenylation factors at the 3′ end of the gene (Hsin and Manley, 2012). While the CTD also contributes to alternative splicing, few alternative splicing factors are known to directly interact with the CTD (Kornblihtt et al., 2013; Muñoz et al., 2010). Although alternative splicing factors have been proposed to regulate splicing by modulating RNAPII pausing (Kornblihtt et al., 2013), previous studies have primarily examined this mode of splicing regulation at the transcriptome or interactome level (Ip et al., 2011; Shukla et al., 2011) and have not yet elucidated precise molecular mechanisms.
The most abundant and reversible internal modification in eukaryotic mRNA is N6-methyladenosine (m6A). m6A is deposited co-transcriptionally (Barbieri et al., 2017; Huang et al., 2019; Ke et al., 2017; Knuckles et al., 2017; Louloupi et al., 2018) at a subset of RRACH (R=A/G, H=A/C/U) sequences (Dominissini et al., 2012; Meyer et al., 2012) by an m6A methyltransferase complex (writer) with core components methyltransferase-like 3 (METTL3) and METTL14 (Liu et al., 2014). The m6A modification of an mRNA transcript can influence every step in its life cycle, including alternative splicing (Xiao et al., 2016; Liu et al., 2015, 2017; Roignant and Soller, 2017): (i) the m6A writers METTL3 and METTL14 localize in part to nuclear speckles (Liu et al., 2014; Ping et al., 2014; Wang et al., 2014), and their depletion leads to changes in alternative splicing (Liu et al., 2014, 2015; Louloupi et al., 2018; Ping et al., 2014; Yoon et al., 2017); (ii) the m6A erasers FTO and ALKBH5 also localize in part to nuclear speckles (Jia et al., 2011; Zheng et al., 2013), and their depletion leads to changes in alternative splicing (Bartosovic et al., 2017; Qiao et al., 2016; Tang et al., 2018; Zhao et al., 2014); (iii) depletion of m6A readers YTHDC1, hnRNPC, hnRNPG, and hnRNPA2B1 leads to changes in transcriptome-wide alternative splicing patterns (Alarcón et al., 2015; Kasowitz et al., 2018; Liu et al., 2015, 2017; Patil et al., 2016; Xiao et al., 2016), with hnRNPG and YTHDC1 knockdown having the largest effects on alternative splicing. m6A can regulate splicing by recruiting m6A reader proteins, which can either be splicing factors themselves (e.g. hnRNPG) or recruit other splicing factors (e.g. YTHDC1 recruits SRSF3) (Roundtree et al., 2017; Xiao et al., 2016). Recently, the extent to which m6A functions in mRNA splicing has been called into question based on the low abundance of m6A in introns within chromatin-associated mRNA (Ke et al., 2017). However, an independent study identified a much higher abundance of m6A in nascent RNA (Louloupi et al., 2018). These conflicting results on the function of m6A can be resolved by elucidating the concrete mechanisms behind m6A-dependent regulation of alternative splicing.
The hnRNPG (also known as RBMX) protein is unique among known m6A reader proteins in that it uses Arg-Gly-Gly (RGG) motifs in a low-complexity region to selectively bind m6A-modified RNA (Liu et al., 2017). The low-complexity sequence of hnRNPG includes two regions each containing three RGG motifs (RGG1 and RGG2). RGG regions are among the most common RNA-binding domains (Gerstberger et al., 2014) and tend to exhibit degenerate specificity for RNA (Ozdilek et al., 2017; Thandapani et al., 2013). In addition, RGG regions can function in protein–protein interactions (Thandapani et al., 2013). The RGG2 region of hnRNPG functions both in the selective binding of hnRNPG to m6A-modified RNA (Liu et al., 2017) and in the interaction of hnRNPG with the splicing factor hTra2-β1 (Hofmann and Wirth, 2002; Kanhoush et al., 2010). The function of the RGG1 region of hnRNPG has not yet been elucidated. To our knowledge, no RGG region has previously been shown to interact directly with RNA polymerase II.
Here, we investigate how the CTD of RNAPII, the RGG regions of hnRNPG, and m6A modification of nascent mRNA act together to regulate alternative splicing. We identify an m6A-mediated mechanism for alternative splicing regulation, in which the co-transcriptional interactions of hnRNPG simultaneously with RNAPII CTD and with nascent RNA influence RNAPII occupancy and affect exon inclusion. We demonstrate a direct interaction between the RGG regions of hnRNPG and the phosphorylated CTD of RNAPII, showing that hnRNPG can interact with both nascent RNA and RNAPII CTD. We also demonstrate that three distinct regions of hnRNPG function to regulate alternative splicing, and that hnRNPG-bound m6A and RNAPII occupancy occur in specific patterns near hnRNPG-regulated exons. Our results lead to a model in which hnRNPG interacts cotranscriptionally with nascent RNA and RNAPII CTD, while m6A in regulated exons modulates splicing through the interplay of hnRNPG binding and RNAPII occupancy.
Results
HnRNPG Interacts with RNA Polymerase II in vivo
RNAPII co-immunoprecipitated with hnRNPG from whole cell or chromatin extracts of human embryonic kidney (HEK) 293T cells (Figure 1A). This co-immunoprecipitation decreased with hnRNPG knockdown (Figure S1A) and was reproducible with three different hnRNPG antibodies (Figure S1B). Upon transcription inhibition with actinomycin D (actD) or 5,6-dichloro-1-β-D-ribofuranosylbenzimidazole (DRB), co-immunoprecipitation of RNAPII with hnRNPG decreased (Figure 1B); upon inhibition with camptothecin (CPT), co-immunoprecipitation of RNAPII increased (Figure 1C). While all three inhibitors block transcription elongation, actinomycin D and DRB decrease, whereas camptothecin increases, occupancy of transcribing RNAPII on chromatin (Borsos et al., 2017; Ljungman and Hanawalt, 1996; Sordet et al., 2008). Thus hnRNPG likely interacts with transcribing, chromatin-bound RNAPII. Consistent with this result, inhibiting RNAPII transcription with α-amanitin or actinomycin D altered the localization of hnRNPG from small nucleoplasmic granules to dense nuclear clusters (Figure S1C). Our chromatin preparation was treated with micrococcal nuclease, which degrades both DNA and RNA. Additional RNase treatment significantly increased the amount of co-precipitated RNAPII (Figure 1D), suggesting that the hnRNPG–RNAPII interaction is mediated through protein–protein interactions rather than through RNA. Our result is supported by an RNAPII CTD interactome study, which showed enrichment of hnRNPG with immunoprecipitation of S2P or S5P RNAPII (Nojima et al., 2018).
Figure 1: hnRNPG interacts with RNA polymerase II in vivo.

A. Western blot showing co-immunoprecipitation (co-IP) of Ser5-phosphorylated RNAPII (RNAPII S5P) with hnRNPG in whole cell or chromatin extracts. in: input; un: unbound; hnG IP: hnRNPG IP; hnG Ab: hnRNPG antibody; ctrl: isotype control IP.
B. Western blot showing co-IP of RNAPII with hnRNPG in chromatin extracts of cells treated with 0.5% v/v DMSO, 5 μg/mL actinomycin D (actD), or 100 μM DRB for 2 hours. RNAPII co-IP plotted relative to DMSO-treated cells and normalized to hnRNPG IP and to input: (RNAPIIIP / hnRNPGIP) / (RNAPIIinput / hnRNPGinput). Error bars: ± 1 standard deviation; n = 3 biological replicates; n.s., not significant; * p < 0.05, ** p < 0.01 by two-sample t-test.
C. Western blot showing co-IP of RNAPII S5P with hnRNPG in chromatin extracts of cells treated with 0.12% v/v DMSO or 6 μM camptothecin (CPT) for 5 hours. RNAPII co-IP plotted relative to DMSO-treated cells. Error bars: ± 1 standard deviation; n = 3 biological replicates; *** p < 0.001 by two-sample t-test.
D. Western blot showing co-IP of RNAPII S5P with hnRNPG in chromatin extracts treated with RNase A. n = 2 biological replicates. RNAPII S5P co-IP plotted relative to no RNase treatment.
E. Western blot showing co-IP of RNAPII S5P with FLAG–hnRNPG in chromatin extracts of cells transfected hnRNPG siRNA and pCMV3-Flag-RBMX plasmid (WT, RRMmut, RGG1mut, or RGG2mut). RNAPII co-IP measured relative to WT. Error bars: ± 1 standard deviation; n = 3 biological replicates; * p < 0.05 by two-sample t-test.
F. Western blot showing co-IP of RNAPII S5P with hnRNPG in chromatin extracts of cells transfected with control (ctrl) or METTL3 (M3) siRNA. RNAPII co-IP plotted relative to control. Error bars: ± 1 standard deviation; n = 4 biological replicates; n.s., not significant by two-sample t-test.
See also Figure S1.
We examined the roles of different regions of hnRNPG in interacting with RNAPII. The hnRNPG protein consists of an RNA recognition motif (RRM) and a ~300-amino-acid low-complexity sequence including two regions containing RGG motifs (RGG1 and RGG2). We introduced point mutations in the RRM, RGG1, or RGG2 region of hnRNPG to generate the mutants RRMmut, RGG1mut, and RGG2mut (Figure S1D), knocked down endogenous hnRNPG, and overexpressed FLAG-tagged forms of either wild-type or mutant hnRNPG. Mutations in the RRM, RGG1, or RGG2 region decreased coimmunoprecipitation of RNAPII with hnRNPG (Figure 1E). The mutations in RRMmut are known to abolish RNA binding by the RRM region of hnRNPG (Moursy et al., 2014), so the RRM region might promote the interaction with RNAPII by enhancing binding of hnRNPG to nascent RNA at transcription sites. To test the possibility that m6A modifications in nascent RNA could influence the interaction of hnRNPG with transcribing RNAPII, we measured the interaction between hnRNPG and RNAPII upon knockdown of the m6A writer METTL3, which associates with RNAPII (Figure S1E; Slobodin et al., 2017). METTL3 knockdown decreased the association of hnRNPG with RNAPII, but this effect was not significant (Figure 1F).
HnRNPG Binds Phosphorylated CTD of RNAPII and RNA Simultaneously
The RNAPII CTD is a docking site for many RNA processing factors and interacts with the low-complexity regions of multiple RNA-binding proteins (Burke et al., 2015; Harlen and Churchman, 2017; Kwon et al., 2013; Schwartz et al., 2013). We examined whether hnRNPG, which has an extensive low-complexity region (Figures S1D, S2A), can interact directly with the CTD. We used the GST-tagged CTD of RNAPII (GST–CTD) to pull down recombinant full-length hnRNPG protein (Figure S2B). Phosphorylated GST–CTD (GST–pCTD) was prepared by treatment with CDK7 or CDK9 prior to the pull-down. Only the phosphorylated forms of GST–CTD were able to pull down hnRNPG (Figure 2A). Furthermore, pre-binding hnRNPG to a known RNA ligand, an A- or m6A-containing 34-nucleotide hairpin from the long noncoding RNA metastasis-associated lung adenocarcinoma transcript 1 (MALAT1) (Liu et al., 2017), did not influence the pull-down of hnRNPG by GST–pCTD (Figure 2B). This result suggests that hnRNPG can simultaneously interact with RNA and pCTD. hnRNPG self-assembled in vitro, forming large assemblies with a radius of ~27 nm, with a slight increase in size in the presence of the MALAT1 RNA hairpin (Figure S2C). HnRNPG also formed large complexes on surface plasmon resonance (SPR) chips with immobilized MALAT1 RNA hairpin, evidenced by a continued slow increase after an initial rapid increase in SPR signal from RNA binding (Figure S2D). Addition of a synthetic peptide consisting of four heptapeptide repeats with phosphorylated Ser5 from the RNAPII CTD (S5P-peptide) reduced this larger complex formation without affecting initial RNA binding (Figure S2D). In solution, addition of S5P- or S2P-peptide had minimal effect on the size of hnRNPG assemblies measured by dynamic light scattering (Figure S2E).
Figure 2: hnRNPG binds directly to phosphorylated RNAPII CTD and can simultaneously interact with both RNA and CTD.

A. Western blot showing pull-down of recombinant hnRNPG with GST-tagged RNAPII CTD (GST–CTD) ± pre-treatment with CDK7, CDK9, and ATP. GST–pCTD: phosphorylated GST–CTD. Quantitation in Figure 2B.
B. Western blot showing pull-down of recombinant hnRNPG ± MALAT1 RNA hairpin containing A (2515-A) or m6A (2515-m6A) with the GST–CTD ± phosphorylation by CDK7 or CDK9. Quantitation normalized to hnRNPG IP and to input: (RNAPIIIP / hnRNPGIP) / (RNAPIIinput / hnRNPGinput). n = 3 replicates.
C. Filter spotting showing RNA binding to recombinant hnRNPG by spin-down assay. Plot shows percent of bound MALAT1 RNA hairpin at varying concentrations of S5P-peptide. n = 3 independent experiments.
D. Silver stained denaturing protein gel showing GST–pCTD binding (S5P by CDK7) to recombinant hnRNPG by spin-down assay. s: supernatant; p: pellet; +2515-A: with equimolar MALAT1 RNA hairpin. A and m6A superscripts correspond to addition of MALAT1 RNA with A or m6A. HnRNPG runs as two bands due to variable N-glycosylation. Fraction pCTD in the pellet refers to [GST-pCTD] / ([GST-pCTD] + [GST-CTD]). Dashed line shows the fraction of hnRNPG in the pellet in the absence of GST-pCTD or RNA. n = 3 replicates.
E. Denaturing protein gel showing time points from limited proteolysis of wild-type hnRNPG ± MALAT1 RNA hairpin (2515-A/m6A) by proteinase K. Plot showing half-life (t1/2) of wild-type and mutant hnRNPG proteolysis by proteinase K, with or without pre-binding to equimolar 2515-A, 2515-m6A, SMN2exon7, or WEc RNA, normalized to no RNA. Error bars: ± 1 standard deviation; n = 3–5 replicates; n.s., not significant by two-sample t-test; * p < 0.05, ** p < 0.01.
F. Silver stained denaturing protein gel showing GST–pCTD binding (S5P by CDK7) to wild-type and mutant hnRNPG by spin-down assay. s: supernatant; p: pellet. Plot of relative affinity 1-%pCTD(pellet) / %pCTD(input) where y >0 corresponds to pCTD binding.
See also Figure S2.
The tendency of hnRNPG to form large assemblies complicated the quantitative measurement of RNA binding using native gel shift or nitrocellulose filters (not shown). To directly demonstrate RNA binding in the presence of GST–pCTD, we took advantage of the observation that hnRNPG remained soluble at 0.5 M NaCl but formed larger complexes upon transfer to 0.15–0.25 M NaCl that could be pelleted by centrifugation (spin-down assay). We found that adding S5P-peptide had minimal effect on binding of A- or m6A-containing MALAT1 RNA hairpin (Figure 2C), showing that hnRNPG can bind simultaneously to RNA and pCTD. We also used the spin-down assay to measure hnRNPG binding to pCTD. Both GST–CTD and GST–pCTD were soluble on their own (Figure S2F), but in the presence of hnRNPG, GST–pCTD co-precipitated with hnRNPG while unphosphorylated GST–CTD remained soluble (Figure 2D). The addition of MALAT1 RNA hairpin increased the fraction of hnRNPG found in the pellet but did not affect the co-precipitation of GST–pCTD (Figure 2D). These results validate that hnRNPG has much higher affinity for phosphorylated than for unphosphorylated CTD, and that pCTD binding is unaffected by RNA binding.
The RRM, RGG1, and RGG2 Regions Mediate hnRNPG Binding to RNA and pCTD
To examine the effect of three functional domains in hnRNPG on RNA and CTD binding, we purified hnRNPG with mutations in the RRM, RGG1, or RGG2 region (Figures S1D, S2B). HnRNPG assembly size was not affected by mutations in RRM or RGG1 but slightly increased with mutations in the RGG2 region (Figure S2G). We used limited proteolysis to study hnRNPG binding to RNAs with distinct structures and lengths (Figure S2H). HnRNPG with or without equimolar RNA was treated with proteinase K, and its degradation was tracked over time (Figure 2E). Consistent with the preferential binding of hnRNPG to m6A-containing MALAT1 RNA hairpin (Liu et al., 2017), both MALAT1 RNAs protected hnRNPG from proteolysis, but the m6A-containing RNA had a more protective effect. This protection was reduced for RGG1mut and RGG2mut, and abolished for RRMmut. Mutations in the RRM also abolished the protective effect of two other RNAs bound by hnRNPG: unstructured RNA SMN2exon7 and structured RNA WEc (Kanhoush et al., 2010; Moursy et al., 2014). Mutations in RGG1 and RGG2 only slightly decreased the protective effect of SMN2exon7, which is bound by the RRM of hnRNPG (Moursy et al., 2014), but markedly blunted the protective effect of WEc, which is thought to bind the RGG2 region (Kanhoush et al., 2010). These results suggest that hnRNPG can bind both unstructured and structured RNA, with different roles for the RRM, RGG1 and RGG2 regions.
To examine the effect of domain mutations on RNAPII CTD binding, we first applied the GST–CTD pull-down assay at 0.5 M NaCl where the hnRNPG protein remained soluble (Figure S2I). Mutations in RRM reduced but did not abolish the interaction of hnRNPG with GST–CTD, whereas mutations in either RGG1 or RGG2 abolished this interaction. Next we used our spin-down assay to measure pCTD binding to mutant hnRNPG proteins (Figures 2F, S2J–K). Mutations in RGG1 or RGG2, but not in RRM, reduced pelleting of hnRNPG compared to wild-type. The RRM and RGG2 mutants, but not RGG1 mutant, could bind GST–pCTD in the absence of RNA (Figures S2J–K). On addition of MALAT1 RNA hairpin, RRM mutant remained capable of pCTD binding, but RGG2 mutant binding to pCTD was severely diminished (Figure 2F). In summary, we have used several independent in vitro assays to show that hnRNPG can simultaneously bind RNA and RNAPII pCTD. The RRM and two RGG regions all function in RNA binding, while the RGG regions are required for the direct interaction of hnRNPG with pCTD.
The RRM, RGG1, and RGG2 Regions of hnRNPG Affect Transcript Abundance
To examine the effect of the RRM, RGG1, and RGG2 regions on the cellular function of hnRNPG, we knocked down endogenous hnRNPG and overexpressed either negative control vector coding only for a FLAG tag (NCV), wild-type FLAG–hnRNPG (WT), or mutant FLAG–hnRNPG with mutations in the RRM, RGG1, or RGG2 region (RRMmut, RGG1mut, or RGG2mut) (Figures S1D, S3A). We conducted mRNA sequencing (mRNA-seq) to detect changes in transcript abundance relative to wild-type (Table S1), and we validated these changes by RT–qPCR (Figure S3B–C). Relative to cells expressing wild-type FLAG–hnRNPG, 1258 genes were differentially expressed in NCV, and 300–800 genes were differentially expressed for each hnRNPG mutant (Figure 3A). Changes in transcript abundance were correlated among the three mutants and NCV (Figures 3B, S3D), indicating that the RRM, RGG1, and RGG2 regions all contribute to the regulation of transcript abundance, and mutations in these regions led to partial loss-of-function. Differentially expressed genes were enriched for functions in developmental processes (Figure 3C), consistent with known functions of hnRNPG in development (Dichmann et al., 2008; Tsend-Ayush et al., 2005).
Figure 3: The RRM, RGG1, and RGG2 regions function in regulation of transcript abundance by hnRNPG.

A. Volcano plots showing log2(fold change) and −log10(p-value) for changes in gene expression in NCV, RRMmut, RGG1mut, and RGG2mut relative to WT. Genes satisfying the π value threshold (see methods) were considered differentially expressed. Numbers of down- and up-regulated genes are listed at the top left and right sides, respectively, of each plot. Black curves, π value threshold; blue points, differentially expressed exons; gray points, non-differentially expressed exons.
B. Correlated changes in gene expression, quantified as log2(fold change relative to WT), in mRNA sequencing data for RRMmut, RGG1mut, and RGG2mut. Each point is a gene. r, Pearson correlation coefficient; p, p-value using Fisher transformation; red line, model II major axis linear regression.
C. Gene ontology (GO) analysis showing false discovery rate (FDR) adjusted p-value (−log10) for biological processes (blue) and cellular components (green) enriched among genes differentially expressed relative to WT. Red line: FDR threshold (p = 0.05). Number (n) of genes in each category from top to bottom: NCV/WT biological process (n = 295, 214, 215, 32, 68), cellular component (n = 186, 122, 116, 275, 236); RRMmut/WT biological process (n = 18, 13), cellular component (n = 156, 9, 176, 170); RGG2mut/WT cellular component (n = 10, 97, 130).
The RRM, RGG1, and RGG2 regions of hnRNPG Function in Alternative Splicing Regulation
Using published mRNA sequencing data (Liu et al., 2017), we identified exons that were differentially expressed upon hnRNPG, METTL3, or METTL14 knockdown (regulated exons), or showed correlated changes in expression upon hnRNPG and either METTL3 or METTL14 knockdown (co-regulated exons) (Figure 4A–B). We found that 18031 exons were either co-down or co-up-regulated by hnRNPG and METTL3/14 knockdown, indicating that hnRNPG and METTL3/14 in wild-type cells promote their inclusion or exclusion, respectively (Figure 4B). Exons regulated by hnRNPG, or co-regulated by hnRNPG and METTL3/14, were enriched in genes that function in metabolic processes and RNA binding (Figures 4C, S4A). Using previously published photoactivatable ribonucleoside-enhanced crosslinking and immunoprecipitation followed by methylated RNA immunoprecipitation (PAR-CLIP–MeRIP) sequencing data (Liu et al., 2017), we examined the distribution of hnRNPG-bound m6A sites around hnRNPG- and METTL3/14-regulated exons (Figures 4D, S4B). We have previously shown that 81% of hnRNPG-bound m6A sites identified by hnRNPG PAR-CLIP–MeRIP were also m6A methyltransferase-dependent (Liu et al., 2017). We found that hnRNPG-bound m6A sites were enriched in exonic regions near splice sites (Figure 4D), similar to the known pattern of m6A sites in nascent mRNA (Louloupi et al., 2018). Co-down-regulated exons were more likely to have hnRNPG-bound m6A sites near their splice sites than co-up-regulated exons (Figures 4D, S4C), suggesting that m6A plays a bigger role in hnRNPG-dependent exon inclusion.
Figure 4: hnRNPG and m6A methyltransferase co-regulate exon splicing.

A. Distribution of differentially expressed exons showing number of exons at each log2(fold change) for hnRNPG (red), METTL3 (green), and METTL14 (blue) knockdown relative to control knockdown (Liu et al., 2017). Numbers of down- and up-regulated differentially expressed exons for each knockdown are listed at the top left and right corners of the plot in the color of the knockdown.
B. Venn diagram showing overlap between exons differentially expressed upon hnRNPG knockdown (39506) and upon METTL3 or METTL14 knockdown (83517). Overlapping exons are co-regulated exons (Co-reg, 18031), with correlated changes in expression upon hnRNPG KD and either METTL3 or METTL14 KD.
C. GO analysis showing false discovery rate (FDR) adjusted p-value (−log10) for biological processes (blue) and molecular functions (red) enriched among genes containing differentially expressed exons that were co-regulated by hnRNPG KD and either METTL3 or METTL14 KD. Red line: FDR threshold (p = 0.05).
D. HnRNPG-bound m6A sites per regulated exon at each site in the −250 to +250 nucleotide region around the splice sites of exons co-down-regulated (11996), co-up-regulated (9818), or not regulated (140932) upon hnRNPG KD and either METTL3 or METTL14 KD. * p < 10−16 by paired t-test between curves for down- vs up-regulated exons.
E. Same as (D) but using hnRNPG binding sites from chromatin associated PAR-CLIP data.
F. Sequencing track of VPRBP gene showing read density by chromatin-associated hnRNPG PAR-CLIP. T-to-C and T-to-A mutations (marks of cross-linking in PAR-CLIP) are shown as green and orange vertical lines. rep: biological replicate; si-C: control siRNA; si-hnG: hnRNPG siRNA. RRACH motifs: red; m6A sites: black.
Even though hnRNPG is strictly localized to the nucleus (Figure S1C), the above analysis would not distinguish between chromatin-associated nascent RNAs and nucleoplasmic RNAs bound by hnRNPG. Therefore we performed hnRNPG PAR-CLIP on the chromatin fraction to sequence only chromatin-bound mRNAs crosslinked to hnRNPG (Figure S4D–E, Table S2). Similar to hnRNPG-bound m6A sites in whole cell RNA (Figure 4D), hnRNPG-bound sites in chromatin-bound RNA (Figure 4E–F) were enriched in exonic regions near the splice sites of exons co-regulated by hnRNPG and METTL3/14, and this enrichment was stronger in co-down- than in co-up-regulated exons. The contrast between densities on the exonic versus intronic side of splice sites was even more pronounced for hnRNPG-bound sites in chromatin-bound RNAs (Figure 4E) than in whole cell RNAs (Figure 4D). Thus, hnRNPG binds to chromatin-associated nascent RNAs in a specific pattern near the splice sites of co-regulated exons, and this pattern is more prominent in nascent RNA than in whole-cell RNA, consistent with our model that hnRNPG-mediated alternative splicing primarily occurs co-transcriptionally.
The m6A reader YTHDC1 has been implicated in m6A-dependent regulation of alternative splicing (Xiao et al., 2016). Using published sequencing data (Liu et al., 2017; Xiao et al., 2016), we found that 6669 exons were differentially expressed upon both YTHDC1 and hnRNPG knockdown (Figure S4F), with similar numbers of co- and anti-co-regulated exons (Figure S4G). The m6A installation motif RRACH was enriched in exonic regions for both hnRNPG- and YTHDC1-regulated exons, but this enrichment was more pronounced in hnRNPG-regulated exons (Figure S4H).
We also analyzed our mRNA-seq data (Table S1) for changes in exon splicing in cells expressing NCV, RRMmut, RGG1mut, or RGG2mut relative to cells expressing wild-type hnRNPG (WT). We found thousands of differentially expressed exons for each mutant and NCV (Figures 5A–C), which were validated by RT–PCR (Figure S5A). Mutations in RGG1 affected fewer exons compared to mutations in RRM or RGG2, and mutations in RRM and RGG2 led to many more down-regulated than up-regulated exons, suggesting that these regions mainly promote exon inclusion in wild-type cells (Figure 5A–B). Changes in exon expression were correlated among cells expressing NCV and the three hnRNPG mutants (Figure 5D, S5B). The correlation between RRMmut and RGG2mut was much stronger than the correlation of either mutant with RGG1mut, possibly due to overlapping functions of RRM and RGG2 in nascent RNA binding. Genes containing exons regulated by NCV, RRMmut, and RGG1mut were enriched for biological processes in metabolism and development (Figure S5C). Unexpectedly, more exons were down-regulated in cells expressing the RRM and RRG2 mutants (~4500) than in cells expressing NCV (~1300, Figure 5A). Since RRM and RGG2 mutations decrease RNA binding (Figure 2E), this result is unlikely from off-target binding and more likely from a dominant negative effect in which RRM and RGG2 mutants lose RNA binding but still associate with pCTD to block its interactions with other proteins. In contrast, in cells expressing NCV, the simultaneous loss of interactions of hnRNPG with both nascent RNA and RNAPII may have a smaller effect on splicing since the CTD retains its interactions with other proteins.
Figure 5: The RRM, RGG1, and RGG2 regions function in regulation of alternative splicing by hnRNPG.

A. Volcano plots showing log2(fold change) and −log10(p-value) for changes in exon expression in NCV, RRMmut, RGG1mut, and RGG2mut relative to WT. Exons satisfying the π value threshold (see methods) were considered differentially expressed. Numbers of down- and up-regulated differentially expressed exons are listed at the top left and right corners of each plot. Black curves, π value threshold; blue points, differentially expressed exons; gray points, non-differentially expressed exons.
B. Distribution of differentially expressed exons showing number of exons at each log2(fold change) for RRMmut (red), RGG1mut (green), and RGG2mut (blue) relative to WT. Numbers of down- and up- regulated differentially expressed exons for each mutant are listed at the top left and top right corners of the plot, in the color of the mutant.
C. mRNA-seq reads for NASP transcripts in NCV (gray), WT (black), RRMmut (red), RGG1mut (green), RGG2mut (blue) expressing cells. Sashimi plot shows down-regulation of the middle exon in NCV, RRMmut, RGG1mut, and RGG2mut compared to WT cells.
D. Correlated changes in exon expression, quantified as log2(fold change relative to WT), in mRNA sequencing data for RRMmut, RGG1mut, and RGG2mut. Each point is an exon. r, Pearson correlation coefficient; p, p-value using Fisher transformation; red line, model II major axis linear regression.
See also Figures S5 and S6, and Table S1.
m6A Site Position in the Regulation of Alternative Splicing by hnRNPG
To further study the roles of RRM, RGG1, and RGG2 in the m6A-dependent regulation of alternative splicing by hnRNPG, we examined the pattern of hnRNPG-bound m6A sites around the splice sites of hnRNPG mutant-regulated exons. HnRNPG-bound m6A sites were more enriched in exonic regions near splice sites of exons down-regulated upon hnRNPG knockdown (NCV) than in up-regulated exons (Figure 6A). Similar enrichment was observed at exons regulated by hnRNPG mutants, however this enrichment was less prominent at RGG1mut-regulated exons than at RRMmutor RGG2mut-regulated exons (Figure 6A–B). HnRNPG-bound sites in nascent mRNA were also enriched in exonic regions near splice sites, and the contrast between site densities in exonic and intronic regions was even more pronounced than in whole-cell mRNA (Figure 6C). NCV- and RGG1mut-regulated exons in nascent RNA had higher densities of hnRNPG-bound sites for down-versus up-regulated exons at both splice sites, while RRMmut- and RGG2mut-regulated exons had higher or equal densities of hnRNPG-bound sites for up- versus down-regulated exons at the 3’ or 5’ splice site, respectively. A particularly pronounced effect of RRM and RGG2 mutation was the reduction of the density of the hnRNPG-bound m6A sites at down-regulated exons, consistent with the observed reduction in exon inclusion for these two mutants (Figure 5B). These results suggest that RRM and RGG2 regions of hnRNPG have overlapping functions in nascent RNA binding and regulation of exon inclusion.
Figure 6: Role of m6A site position in regulation of alternative splicing by hnRNPG.

A. Distribution of hnRNPG-bound m6A sites per regulated exon at each site in the −250 to +250 nucleotide region around the splice sites of exons down-regulated (red) or up-regulated (blue) in NCV (1317 down, 1279 up), RRMmut (4460 down, 1099 up), RGG1mut (654 down, 513 up), and RGG2mut (4543 down, 1129 up) relative to WT. * p < 10−16 by paired t-test between curves for down- vs up-regulated exons.
B. Overlay curves from (A) for RRMmut, RGG1mut, and RGG2mut.
C. Same as (A) but using hnRNPG binding sites from chromatin-associated PAR-CLIP data.
See also Figure S6.
A role for RGG2 in m6A-dependent splicing regulation would be consistent with the function of this region in the preferential binding of m6A-modified RNAs by hnRNPG (Liu et al., 2017). Genes containing RGG2mut-regulated exons were enriched in metabolic functions (Figure S6A), similar to exons co-regulated by hnRNPG and m6A methyltransferase (Figure 4C), and in functions in nervous system development, consistent with the known role of hnRNPG in neural development (Dichmann et al., 2008; Shashi et al., 2015; Tsend-Ayush et al., 2005). Further supporting the importance of RGG2 in splicing regulation, cells expressing RGG2mut showed significantly decreased proliferation compared to cells expressing wild-type hnRNPG (Figure S6B).
m6A-Mediated Regulation of RNAPII Occupancy and Alternative Splicing by hnRNPG
RNAPII dwell time in transcription elongation can influence exon usage by enhancing or blocking recognition of a splice site by splicing factors (Kornblihtt et al., 2013). To study the association between m6A modification, hnRNPG binding, and RNAPII occupancy at relevant exons, we knocked down hnRNPG (Figure S7A; Liu et al., 2017) and performed quantitative chromatinimmunoprecipitation followed by sequencing (ChIP-seq; Figures 7A–D, S7B; Table S3) using antibodies for total, S2P, and S5P RNAPII. Each sample was spiked with a known amount of Drosophila chromatin for cross-sample comparison of RNAPII densities (Egan et al., 2016). After normalization to the spiked-in Drosophila chromatin, the overall RNAPII ChIP-seq density across all gene regions decreased upon hnRNPG knockdown (Figure S7C). To identify the effects of hnRNPG on splicing, we focused our next analysis on regions of hnRNPG-dependent alternative splicing regulation. The total, S2P, and S5P RNAPII densities were analyzed separately for exons that are co-down-, coup-, and non-regulated upon hnRNPG or METTL3/14 knockdown. In the control samples, the densities of total, S2P, and S5P RNAPII were much higher for co-down-regulated than for co-up- or non-regulated exons, with a peak in RNAPII density ~80 nucleotides downstream of the 3’ splice site (Figure 7A–C). Moreover, hnRNPG knockdown significantly reduced RNAPII density near the splice sites of co-down-regulated exons (Figure 7A–C). These results support an association between RNAPII occupancy and hnRNPG-mediated regulation of exon inclusion. The RNAPII density for co-up-regulated exons was similar to that for non-regulated exons in magnitude and shape, suggesting that hnRNPG dependent regulation of exon exclusion is at best only weakly associated with RNAPII occupancy.
Figure 7: m6A-dependent regulation of alternative splicing by hnRNPG and RNAPII occupancy.

A. RNAPII ChIP-seq upon hnRNPG knockdown, using total RNAPII antibody. si-C: control knockdown; hnG1, hnG2: hnRNPG knockdown with two siRNAs. Co-regulated exons down- (dn, 15318), up-(up, 11255), and non-regulated (non, 35377) upon hnRNPG or METTL3/14 knockdown. * p < 10−4.
B. Same as (A) using S2P-CTD antibody.
C. Same as (A) using S5P-CTD antibody.
D. ChIP-seq tracks from KIAA0895L gene using RNAPII-S2P antibody in cells treated with control or hnRNPG siRNA. si-C: control siRNA; si-hnG1, si-hnG2: hnRNPG knockdown with two siRNAs. RRACH motifs: red; m6A sites: black.
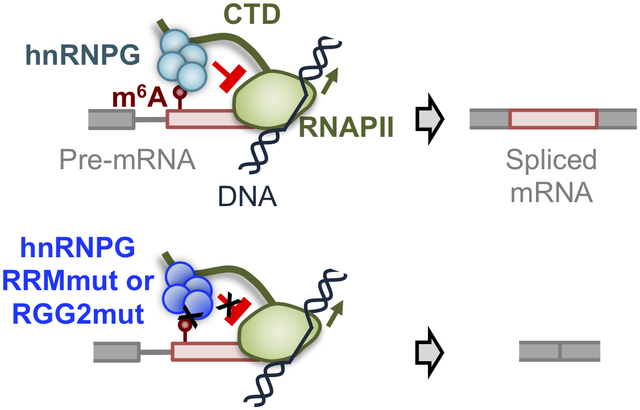
E. Model for m6A-dependent regulation of exon inclusion by hnRNPG. Red circle: m6A site; red box: alternative exon; gray: constitutive exon; black lines: DNA; green: RNAPII with CTD as extended line; cyan: hnRNPG complex. RNAPII transcribes through the splice site, m6A is installed, and hnRNPG interacts with m6A, causing RNAPII to increase dwell time downstream of the m6A site, which results in hnRNPG- and m6A-dependent exon inclusion.
We propose a model in which hnRNPG assemblies interact co-transcriptionally with both the m6A sites in nascent mRNA and the CTD of transcribing RNAPII to regulate exon inclusion (Figure 7E). Our model assumes that m6A modifications are installed co-transcriptionally shortly after nascent RNA emerges from the exit channel of RNAPII, consistent with literature reports (Barbieri et al., 2017; Huang et al., 2019; Ke et al., 2017; Knuckles et al., 2017; Louloupi et al., 2018; Xiang et al., 2017). A crucial feature is the ability of hnRNPG to assemble into a large complex, which allows simultaneous interactions with nascent mRNA, RNAPII CTD, and m6A. We propose the following order of events for hnRNPG- and m6A-dependent exon inclusion: RNAPII transcribes through the exon–intron junction; m6A is installed; hnRNPG binds to the m6A site, which is kinetically favored through its association with RNAPII CTD; RNAPII then dwells longer near the exon–intron junction; increased RNAPII dwell time increases splice site utilization, perhaps through recruitment of spliceosomal components or splicing factors.
Discussion
In this study, we showed that the RNA-binding protein hnRNPG uses RGG regions to directly interact with the phosphorylated CTD of RNAPII. HnRNPG binding to RNA and the RNAPII CTD can occur simultaneously, likely by assembly of hnRNPG into large complexes. In cells, the RRM, RGG1, and RGG2 regions of hnRNPG functioned in the regulation of alternative splicing. We further found that hnRNPG-bound m6A sites near the splice sites of regulated exons were associated with increased RNAPII occupancy and exon inclusion. Our results support a model in which hnRNPG assemblies interact co-transcriptionally with nascent RNA and the RNAPII CTD, while m6A sites in nascent RNA promote hnRNPG binding to modulate RNAPII occupancy and alternative splicing.
One possible mechanism for hnRNPG and m6A dependent alternative splicing regulation is through RNAPII pausing to provide an appropriate time window and spatial resolution to recruit splicing factors. RNAPII pausing during transcription elongation can be modulated by RNA sequence and structure, chromatin state, and RNA–protein interactions (Mayer et al., 2017). Although RNAPII density by ChIP-seq could reflect RNAPII pausing, ChIP-seq has limited resolution (100–200 nucleotides) and cannot distinguish between RNAPII pausing and other etiologies of RNAPII occupancy. A future direction could utilize the native elongating transcript sequencing (NET-seq) method to more accurately measure RNAPII pausing (Mayer et al., 2015; Nojima et al., 2015) and m6A-dependent splicing regulation. These published NET-seq results have shown that RNAPII density is higher in exons than in introns, and is also high around splice sites. NET-seq upon the depletion of hnRNPG, METTL3, and/or METTL14 could provide the single-base resolution needed to firmly establish the potential role of RNAPII pausing in m6A-dependent exon inclusion.
The RNAPII CTD coordinates co-transcriptional RNA processing with transcription by recruiting constitutive RNA processing factors through direct interactions. However, the role of the CTD in recruiting alternative splicing factors, particularly through direct interactions, is less clear (Bentley, 2014). Our study demonstrates that an alternative splicing factor, hnRNPG, directly interacts with the RNAPII CTD. The selective interaction of hnRNPG with phosphorylated CTD and the effect of transcription inhibitors on the hnRNPG–RNAPII interaction support our conclusion that hnRNPG interacts with RNAPII co-transcriptionally. We also found that the direct interaction of hnRNPG with phosphorylated CTD depended on two RGG regions in its low-complexity region. To our knowledge, RGG regions have not previously been shown to directly bind the CTD. Since RGG motifs are the second most common RNA binding motif among mammalian mRNA-binding proteins (Gerstberger et al., 2014), our findings suggest that many other RNA-binding proteins might regulate pre-mRNA processing by interacting directly with the RNAPII CTD through their RGG regions. Moreover, RGG motifs are commonly found in low-complexity regions, so a direct interaction between RGG motifs and the CTD could also have implications for low-complexity region assembly. The CTD is known to interact with low-complexity regions of several RNA-binding proteins, and these interactions have proposed functions in transcriptional regulation (Harlen and Churchman, 2017; Hnisz et al., 2017). HnRNPG forms a distinct interaction with the RNAPII CTD for co-transcriptional splicing regulation.
The abundant m6A modification in mRNA has been implicated in alternative splicing regulation. Most m6A modifications are deposited co-transcriptionally and enriched in exonic regions near splice sites (Barbieri et al., 2017; Ke et al., 2017; Knuckles et al., 2017; Louloupi et al., 2018), but it is unknown how m6A near splice sites can modulate co-transcriptional alternative splicing. Since alternative splicing regulation by RNA-binding proteins depends on their binding site positions (Fu and Ares, 2014), m6A site positions, which determine m6A reader protein binding sites, likely also influence alternative splicing regulation. We found that hnRNPG-regulated exons were associated with specific patterns of hnRNPG-bound m6A sites and RNAPII occupancy, supporting a model in which hnRNPG binds m6A sites near target exons and modulates RNAPII occupancy to promote exon inclusion. The regulation of alternative splicing involves a complex ‘splicing code’ of cis- and trans- acting factors (Fu and Ares, 2014). We have shown that a cis-acting RNA modification, m6A, modulates the regulation of alternative splicing by hnRNPG by recruiting hnRNPG to specific sites, while a trans-acting protein, hnRNPG, interacts with the transcription machinery and co-transcriptionally modulates RNAPII occupancy to regulate alternative splicing. The m6A-dependent regulation of alternative splicing by hnRNPG demonstrates how the RNAPII CTD, RGG regions, and m6A act together to modulate the cotranscriptional regulation of alternative splicing by a low-complexity m6A reader protein.
STAR Methods
Lead Contact and Materials Availability
Further information and requests for resources and reagents should be directed to and will be fulfilled by the Lead Contact, Tao Pan (taopan@uchicago.edu).
Experimental Model and Subject Details
Human embryonic kidney (HEK) cell line HEK293T/17 (CRL11268) was obtained from the American Type Culture Collection (ATCC) and cultured in Dulbecco’s Modified Eagle’s Medium (DMEM) with high glucose and L-glutamine, without sodium pyruvate (HyClone, SH30022.01) in a 37 °C incubator with a humidified atmosphere of 5% CO2. For Figure 1B, HEK293T cells were treated with 0.5% v/v dimethyl sulfoxide (DMSO), 5 μg/mL actinomycin D (A9415, Sigma), or 100 μM 5,6-dichloro-1-β-D-ribofuranosylbenzimidazole (DRB) (D1916, Sigma) for 2 hours before collection of cells for chromatin extraction. For Figure 1C, HEK293T cells were treated with 0.12% v/v DMSO or 6 μM camptothecin (C9911, Sigma) for 5 hours before collection of cells for chromatin extraction. For Figure S1C, HEK293T cells were treated with +2% v/v H2O or 20 μg/mL α-amanitin (A2263, Sigma) for 9 hours, or with 5 μg/mL actinomycin D (A9415, Sigma) for 2 hours, before fixation for immunofluorescence. For Figures 1E and S3A, 24 ng/mL of either pCMV3-Flag negative control vector (CV016, Sino Biological) or pCMV3-Flag-RBMX plasmid (WT, RRMmut, RGG1mut, or RGG2mut), as well as 10 nM hnRNPG siRNA (SI00700077, Qiagen), were transfected into HEK293T cells using Lipofectamine 2000 (11668019, Thermo), and the cells were collected for chromatin or RNA extraction 68 hours after transfection. For Figure 1F, 20 nM control siRNA (1027281, Qiagen) or METTL3 siRNA (SI04317096, Qiagen) was transfected into HEK293T cells using Lipofectamine RNAiMAX (13778150, Thermo), and the cells were collected for chromatin extraction 60 hours after transfection. For Figure S1A, 20 nM control siRNA (1027281, Qiagen) or hnRNPG siRNA (G1: SI00700077, Qiagen; G2: SI00700084, Qiagen) was transfected into HEK293T cells using Lipofectamine RNAiMAX, and the cells were collected for chromatin extraction 62 hours after transfection.
Method Details
Cloning and purification of hnRNPG
Repeated attempts by us to overexpress and purify full-length hnRNPG protein in E. coli using multiple different plasmid constructs and expression strategies were unsuccessful, likely due to protease cleavage of the low-complexity hnRNPG protein in cells. We therefore resorted to overexpress the full-length protein from baculovirus expression system where the full-length protein was secreted to avoid proteolysis.
The sequence encoding full-length human hnRNPG protein was amplified from human HeLa cDNA libraries (637203, Clontech) and subcloned into the pGEX-6p-1 vector using BamHI and XhoI restriction sites. Plasmids encoding the hnRNPG mutants RRMmut, RGG1mut, and RGG2mut were prepared by QuikChange mutagenesis (200524, Agilent) and Gibson assembly (E2611L, New England BioLabs), with the following mutations in the encoded proteins: K9A, F11A, R49A, F51A, and F53A in RRMmut; R110A, R113A, R120A, and R125A in RGG1mut; R369A, R373A, and R377A in RGG2mut. The mutant hnRNPG sequences were cloned into pCMV3-Flag-RBMX (HG16560-NF, Sino Biological) by Gibson assembly for expression in human cells. The wild-type and mutant hnRNPG sequences were cloned into the pAcGP67a vector using BamHI and NotI restriction sites for expression in insect cells. A His8 tag was added to the N-terminus for affinity purification. A fast-folding variant of protein G, NuG2b (DTYKLVIVLNGTTFTYTTEAVDAATAEKVFKQYANDAGVDGEWTYDAATKTFTVTE (Lindorff-Larsen et al., 2011; Skinner et al., 2014)), was added to the N-terminus to increase protein stability.
A baculovirus expression system was used for expression of proteins in High Five insect cells as previously described (Langmead and Salzberg, 2012). The secreted proteins were purified using nickel nitrilotriacetic agarose (Ni-NTA) resin (30230, Qiagen). The resin was washed with 10 mM Tris-Cl (pH 7.4), 1 M NaCl, 2.5 mM MgCl2, 10% v/v glycerol buffer. The hnRNPG protein was released from the resin by cleavage C-terminal to the His8–NuG2b tag with His-tagged Pre-Scission Protease (Z03092, GenScript) in storage buffer (10 mM Tris-Cl (pH 7.4), 500 mM NaCl, 2.5 mM MgCl2, 10% v/v glycerol) at 4 °C overnight, and the protein was concentrated with a 30 kDa centrifugal filter (UFC803024) and either stored at 4 °C or flash-frozen in liquid nitrogen and stored at −80 °C. Immediately before use, hnRNPG protein stocks were spun at 21 K × g at 4 °C for 10 minutes, and the supernatant was used as the new hnRNPG stock. The concentrations of hnRNPG stocks were measured by Bradford assay (23236, Thermo).
Immunofluorescence
HEK293T cells were grown in tissue-culture-treated 8-well slides (80826, ibidi), fixed with 4% w/v formaldehyde, permeabilized with phosphate-buffered saline (PBS) (10× solution: SH30258.01, HyClone) containing 0.2% v/v Triton X-100, and blocked overnight at 4 °C in blocking buffer (PBS with 2% w/v bovine serum albumin (A7030, Sigma)). After blocking, the cells were incubated with 365 ng/mL rabbit anti-hnRNPG antibody (ab190352, Abcam) in blocking buffer for 1 hour at room temperature, incubated with 1 μg/mL goat anti-rabbit IgG Alexa Fluor 647 antibody (A-31573, Thermo) in blocking buffer for 1 hour, stained with PBS containing 0.1 μg/mL 4′,6-diamidino-2-phenylindole (DAPI) (D1306, Thermo) for 2 minutes, and covered with ibidi mounting medium (50001, ibidi). Between steps, the cells were washed 2–3 times with PBS for 5 minutes per wash. The slides were imaged on an Olympus DSU spinning disk confocal microscope at the University of Chicago Integrated Light Microscopy Core Facility.
Preparation of cell extracts
HEK293T cells were washed and detached from the cell culture plate with PBS, and then pelleted at 500 × g for 3 minutes. For extraction of whole cell lysate, the cells were resuspended in whole cell lysis buffer: 300 mM NaCl, 100 mM Tris-Cl (pH 8), 0.2 mM ethylenediaminetetraacetic acid (EDTA), 0.1% v/v Triton X-100, and 10% v/v glycerol supplemented with freshly added 1% v/v protease inhibitor (25955–11, Nacalai USA) and 1% v/v phosphatase inhibitor (07575–51, Nacalai USA). After rotating at 4 °C for 30 minutes, cell debris was pelleted at 16 K × g at 4 °C for 5 minutes, and the supernatant whole cell lysate was collected and stored at −20 °C.
Cell fractionation and chromatin extraction were performed based on published protocols (Ferrer et al., 2018; Groisman et al., 2003; Okada and Fukagawa, 2006). HEK293T cells were resuspended in cytoplasmic extraction buffer: 10 mM Tris-Cl (pH 7.4), 10 mM KCl, and 0.1% v/v Triton X-100 supplemented with freshly added 1% v/v protease and phosphatase inhibitors. After incubating on ice for 20 minutes, nuclei were pelleted at 12 K × g at 4 °C for 10 minutes, and the supernatant was collected as the cytoplasmic extract. The pellet was washed once with cytoplasmic extraction buffer. The nuclei were resuspended with nuclear extraction buffer: 10 mM Tris-Cl (pH 7.4), 0.2 mM MgCl2, and 1% v/v Triton X-100 supplemented with freshly added 1% v/v protease and phosphatase inhibitors. After incubating on ice for 15 minutes, chromatin was pelleted at 12 K × g at 4 °C for 10 minutes, and the supernatant was collected as the nucleoplasmic extract. The chromatin pellets were resuspended in 5 U/mL micrococcal nuclease (N3755, Sigma), 20 mM Tris-Cl (pH 7.4), 100 mM KCl, 2 mM MgCl2, 1–3 mM CaCl2, 0.3 M sucrose, and 0.1% v/v Triton X-100 supplemented with freshly added 1% v/v protease and phosphatase inhibitors. After rotating at 4 °C for 1 hour, the digestion reaction was stopped by adding 5 mM EDTA. After centrifuging at 2 K × g at 4 °C for 5 minutes, the supernatant was collected as the chromatin extract.
Immunoprecipitation
For immunoprecipitation, HEK293T whole cell lysate or chromatin extract was combined with 28 μg/mL rabbit anti-DDDDK antibody (ab1162, Abcam), 20 μg/mL rabbit anti-hnRNPG antibody (Ab #1 or not specified: ab190352, Abcam), 1/20 v/v rabbit anti-hnRNPG antibody (Ab #2: 14794, Cell Signaling Technology; Ab #3: NBP2–34152, Novus Biologicals), or 20 μg/mL rabbit isotype control antibody (ab199376, Abcam) in a total volume of 90–100 μL per 100-mm plate of cells. After rotating at 4 °C overnight, 1.5 mg of protein A or protein G Dynabeads (10002D or 10004D, Thermo) were added. After rotating at 4 °C for 2 hours, the tubes were placed on a magnetic separation rack, and the supernatant unbound fraction was collected and stored at −20 °C. The beads were washed four times with 200 μL of wash buffer (300 mM NaCl, 100 mM Tris-Cl (pH 8), 0.2 mM EDTA, and 0.1% v/v Triton X-100). Finally, 30 μL of 4× LDS sample buffer (NP0008, Thermo) were added, and the tubes were incubated at 95 °C for 5 minutes and then placed on a magnetic rack. The supernatant immunoprecipitate (IP) was collected and stored at −20 °C. The concentrations of the input and unbound fractions were measured by Bradford assay. For Western blotting, 5 μg of input (whole cell lysate or chromatin extract) or unbound fraction was combined with 1× LDS and 250 mM dithiothreitol (DTT), and 5 μL (one sixth) of the IP fraction was combined with 250 mM DTT.
GST–CTD pull-down
To phosphorylate the GST–CTD, 500 ng of recombinant GST-tagged human RNAPII CTD (SRP2120, Sigma) were combined with 240 ng of CDK7–Cyclin H–MNAT1 (PV3868, Thermo) or CDK9–Cyclin T1 (14–685, Sigma) in 20 μL of 8 mM 3-(N-morpholino)propanesulfonic acid (MOPS) (pH 7), 0.2 mM EDTA, and 1 mM MgCl2 supplemented with freshly added 0.1 mM ATP and 0.25 mM DTT, and then incubated at 30 °C for 1 hour. Control reactions without GST–CTD, without kinase, or without ATP were incubated under the same conditions. For the GST–CTD pull-down and immunoprecipitation assays, this 20-μL reaction was combined with 60 μL of wash buffer and 100 pmol of hnRNPG in 20 μL of storage buffer (10 mM Tris-Cl (pH 7.4), 500 mM NaCl, 2.5 mM MgCl2, 10% v/v glycerol), and then rotated at 4 °C overnight in a total volume of 100 μL. One tenth (10 μL) of the binding mixture was taken as the input. A 20-μL volume of glutathione magnetic agarose beads (78601, Thermo) for the pull-down (Figs. 2A and 2C), or GST mouse monoclonal antibody magnetic bead conjugate (11847, Cell Signaling Technology) for the immunoprecipitation (Figure 2B), was blocked in 100 μL of 1 mg/mL BSA in wash buffer at 4 °C for 1 hour, resuspended in 20 μL of wash buffer, and added to the remaining 90 μL of the binding mixture. After rotating at 4 °C for 2 hours, the tubes were placed on a magnetic rack, and the supernatant unbound fraction was collected. The beads were washed four times with 200 μL of wash buffer. For elution, the beads were resuspended in 30 μL of 50 mM reduced glutathione in wash buffer and incubated at 22 °C, 300 rpm for 20 minutes for the pull-down, or resuspended in 30 μL of 4× LDS and boiled at 95 °C for 5 minutes for the immunoprecipitation. The tubes were placed on a magnetic rack, and the supernatant eluate was collected and stored at −20 °C. For blotting, 10 μL of the input fraction (one tenth of total input) or 10 μL of the eluate (one third) were prepared in solutions with final concentrations of 1–2× LDS and 250 mM DTT. The pull-down samples were visualized by Western blotting for hnRNPG (below), while the immunoprecipitation samples were visualized by Sypro Ruby protein blot staining (S-11791, Thermo) according to the manufacturer’s instructions. Both the pull-down and immunoprecipitation samples were also visualized by Western blotting for GST (below).
Western blotting
All samples were incubated at 95 °C for 10 minutes, separated on a 4–12% polyacrylamide Bis-Tris protein gel (NP0336BOX, Thermo), and transferred to polyvinylidene fluoride membranes (IPVH00010, Millipore). The membranes were blocked in 5% w/v milk (170–6404, Bio-Rad), 20 mM Tris-Cl (pH 7.6), 150 mM NaCl, and 0.1% v/v Triton X-100. The blots were probed with 0.7 μg/mL anti-RNAPII S5P antibody (ab5131, Abcam), 1 μg/mL anti-RNAPII S2P H5 antibody (920204, BioLegend), 0.365 μg/mL anti-hnRNPG antibody (ab190352, Abcam), 1 μg/mL anti-DDDDK (anti-FLAG) antibody (ab1162, Abcam), 0.23 μg/mL anti-METTL3 antibody (15073–1-AP, Proteintech), 1/1000 v/v anti-GST antibody (2624, Cell Signaling Technology), 1/3000 v/v anti-SNRP70 antibody (ab83306, Abcam), 1/5000 v/v anti-H3K4me3 (ab8580, Abcam), or 0.05 μg/mL anti-GAPDH antibody (A00192–40, Genscript), followed by 0.5 μg/mL mouse anti-rabbit light chain (ab99697, Abcam), 0.03 μg/mL goat anti-rabbit IgG (ab97051, Abcam), 1/2000 v/v rat anti-mouse light chain (ab99632, Abcam), or 0.05 μg/mL goat anti-mouse IgG antibody conjugated to horseradish peroxidase (ab97023, Abcam).
Cell proliferation
After transfecting HEK293T cells with WT or RGG2mut plasmid (24 ng/ml final) and RBMX siRNA (10 nM final) for 68 hours as described above, cells were counted (Countess II Automated Cell Counter, Thermo Fisher) and seeded onto 96-well plates (3000 cells per well, n = 8 for each cell type and time point). Cell proliferation was measured using MTT colorimetric assay (CytoSelect MTT Cell Proliferation Assay, Cell Biolabs Inc) at 0, 48, 72, and 96 hours according to the manufacturer’s instructions. After incubation with MTT reagent (3.5 hours, 37 °C, 5% CO 2), the Detergent Solution was added to each well to dissolve formazan crystals (16 hours, room temperature). The absorbance at 560 nm was measured using a Synergy Neo Plate Reader (BioTek). At each time point, the absorbance of the media was subtracted from each measurement.
Oligonucleotides
The following RNA oligonucleotides were synthesized and purified by high-performance liquid chromatography and/or denaturing polyacrylamide gel electrophoresis, as previously described (Dai et al., 2007; Liu et al., 2017).
| Reagent or Resource | Source | Identifier |
|---|---|---|
| 2515-A RNA: 5’-AAUGUGAAGGACUUUCGUAACGGAAGUAAUUCAA | Liu et al., 2017 | N/A |
| 2515-m6A RNA: 5’-AAUGUGAAGGm6ACUUUCGUAACGGAAGUAAUUCAA | Liu et al., 2017 | N/A |
| 2515-A-Biotin RNA: 5’-AAUGUGAAGGACUUUCGUAACGGAAGUAAUUCAA-Biotin | Liu et al., 2017 | N/A |
| 2515-m6A-Biotin RNA: 5’-AAUGUGAAGGm6ACUUUCGUAACGGAAGUAAUUCAA-Biotin | Liu et al., 2017 | N/A |
The following DNA oligonucleotides were ordered from Integrated DNA Technologies, purified by denaturing polyacrylamide gel electrophoresis, annealed in 50 mM Tris-Cl (pH 7.5), 500 mM KCl at 94 °C for 1 minute, and incubated at room temperature for 3–5 minutes. The resulting DNA templates were used for in vitro transcription of the SMNexon7 and WEc RNAs with T7 RNA polymerase (M0251, New England BioLabs), and the RNA transcripts were precipitated and purified by denaturing gel electrophoresis.
| Reagent or Resource | Source | Identifier |
|---|---|---|
| SMNexon7-Fw DNA: 5’-TAATACGACTCACTATAGGTTTTAGACAAAATCAAAAAGAAGGAAGGTGCTCACATTCCTTAAATTAAGGA | Integrated DNA Technologies | N/A |
| SMNexon7-Rv DNA: 5’-TCCTTAATTTAAGGAATGTGAGCACCTTCCTTCTTTTTGATTTTGTCTAAAACCTATAGTGAGTCGTATTA | Integrated DNA Technologies | N/A |
| WEc-Fw DNA: 5’-TAATACGACTCACTATAGGGTACGACGGATATCGTGGGGGGGGAAATTGCTTTCGGTTCCGACTCTG | Integrated DNA Technologies | N/A |
| WEc-Rv DNA: 5’-CAGAGTCGGAACCGAAAGCAATTTCCCCCCCCACGATATCCGTCGTACCCTATAGTGAGTCGTATTA | Integrated DNA Technologies | N/A |
The following DNA oligonucleotides were ordered from Integrated DNA Technologies, purified by denaturing polyacrylamide gel electrophoresis, and used for RT–PCR validation of splicing changes and for RT–qPCR validation of transcript abundance changes detected by mRNA sequencing:
| Reagent or Resource | Source | Identifier |
| BRCA1_Fw DNA: 5’-GTGGTCAATGGAAGAAACCACC | Integrated DNA Technologies | N/A |
| BRCA1_Rv DNA: 5’-CCTTCACCACAGAAGCACCAC | Integrated DNA Technologies | N/A |
| DNAH10_Fw DNA: 5’-AACAGGACTCTCCCCCACTT | Integrated DNA Technologies | N/A |
| DNAH10_Rv DNA: 5’-GAGACTTCGTCATCCGGACC | Integrated DNA Technologies | N/A |
| TNN_Fw DNA: 5’-AATTGCGTCCATAGAGCTGC | Integrated DNA Technologies | N/A |
| TNN_Rv DNA: 5’-GGTGGGCATGAATGGGAGTT | Integrated DNA Technologies | N/A |
| TAF7L_Fw DNA: 5’-TGCACGTTTTTGTCCCTTCAG | Integrated DNA Technologies | N/A |
| TAF7L_Rv DNA: 5’-CATGGTCGAGTGGGGTCTTT | Integrated DNA Technologies | N/A |
| GYS2_Fw DNA: 5’-GCATGAGGAGGAGCACTCATT | Integrated DNA Technologies | N/A |
| GYS2_Rv DNA: 5’-GTGGGGTAGAGAAGCTGCAT | Integrated DNA Technologies | N/A |
| LINC00926_Fw DNA: 5’-GGTATCTTGGCCCTTCTGGG | Integrated DNA Technologies | N/A |
| LINC00926 Rv DNA: 5’-CCCACCTCTGAAAAGCCCAT | Integrated DNA Technologies | N/A |
| CYP2E1_Fw DNA: 5’-AATTGACAGGGTGATTGGGC | Integrated DNA Technologies | N/A |
| CYP2E1 Rv DNA: 5’-TCATGCACCACAGCATCCAT | Integrated DNA Technologies | N/A |
| KRTAP19–1_Fw DNA: 5’-GGAGGATACGGATTCTCTGGC | Integrated DNA Technologies | N/A |
| KRTAP19–1_Rv DNA: 5’-TGGAATGAAAGCACGGGACA | Integrated DNA Technologies | N/A |
| ACTB_Fw DNA: 5’-AGGACTTTGATTGCACATTGTT | Integrated DNA Technologies | N/A |
| ACTB_Rv DNA: 5’-TGGGGTGGCTTTTAGGATGG | Integrated DNA Technologies | N/A |
Surface plasmon resonance
Surface plasmon resonance data were collected on a BioRad ProteOn XPR36 instrument at the University of Chicago BioPhysics Core Facility. The RNA oligonucleotides 2515-A-Biotin and 2515-m6A-Biotin were immobilized on separate lanes of an NLC sensor chip (1765021 Bio-Rad). Recombinant hnRNPG protein was flowed over the chip at a concentration of 3 μM with 0–12 μM S5P peptide (ab18488, Abcam) in filtered and degassed 10 mM 4-(2-hydroxyethyl)piperazine-1-ethanesulfonic acid (HEPES) (pH 8.6), 500 mM NaCl, 3 mM EDTA, and 0.05% v/v Polysorbate 20 buffer.
Limited proteolysis
The RNA was diluted to a concentration of 25 μM in 30 mM Tris-Cl (pH 7.4) and incubated at 90 °C for 1 minute, and then at room temperature for 3–5 minutes. For limited proteolysis, 200 pmol of wild-type or mutant hnRNPG were combined 200 pmol of RNA in 14 mM Tris-Cl (pH 7.4), 400 mM NaCl, 2 mM MgCl2, and 8% v/v glycerol in a total volume of 40 μL, and the mixture was incubated for 10 minutes at room temperature, and then placed on ice. Proteinase K (EO0491, Thermo) was added for a ratio of 1:700 w/w proteinase:hnRNPG, and the reaction was incubated on ice. Time points were taken at 5, 15, 30, and 60 minutes by combining 9.21 μL of the reaction with stop solution for a final concentration of 1× LDS, 1% v/v protease inhibitor, and incubating at 95 °C for 5 minutes before placing on dry ice. The 0-minute time point was prepared by preparing 1.7 μg of hnRNPG in 1× LDS, 1% v/v protease inhibitor. Immediately after the 60-minute time point was collected, all of the samples were incubated at 95 °C for 5 minutes, separated on a 4–12% polyacrylamide Bis-Tris gel, and stained with PageBlue Protein Staining Solution (24620, Thermo) according to the manufacturer’s instructions.
Dynamic light scattering
For Figure S2C, 9 μM wild-type or mutant hnRNPG protein was prepared in 14 mM Tris-Cl (pH 7.4), 400 mM NaCl, 2 mM MgCl2, and 8% v/v glycerol, with or without 7.2 μM RNA, for a total volume of 40 μL. For Figure S2E, 9 μM wild-type hnRNPG protein was prepared in storage buffer (10 mM Tris-Cl (pH 7.4), 500 mM NaCl, 2.5 mM MgCl2, 10% v/v glycerol) with or without 36 μM S5P or S2P peptide (ab18488 and ab12793, Abcam), for a total volume of 40 μL. The mixture was incubated for 10 minutes at room temperature, and then placed on ice. Light scattering measurements were collected at 4 °C on a Wyatt DynaPro NanoStar instrument and analyzed using the DYNAMICS software at the University of Chicago BioPhysics Core Facility. Each measurement was the average of ten 20-second acquisitions. Each acquisition was fit to an auto-correlation curve using the regularization algorithm, with upper and lower cut-offs of 107 μs and 1.5 μs. Acquisitions with an auto-correlation curve baseline outside the 0.99–1.01 range or error sum-of-squares >100 were filtered out before averaging.
HnRNPG spin-down assay for RNA binding
32P-labeled RNA was pre-mixed ± hnRNPG protein at 0.5 M NaCl, then transferred to 0.15 M NaCl followed by centrifugation. Pellets were dissolved with 0.5 M NaCl buffer in the same volume as supernatant, spotted in μl indicated, and followed by phosphorimaging.
20 pmol of MALAT1 hairpin containing A (2515-A) or m6A (2515-m6A) were 5’ 32P-labeled using T4 PNK and purified by denaturing gel electrophoresis and stored in water. 8 μl of 32P-RNA was mixed with 2 μl 100 mM TrisHCl (pH 7.4) and renatured by heating at 85°C for 2 minutes, then placed at room temperature for 5 minutes. 10 l 2X Buffer A (40 mM Tris-Cl (pH 7.4), 1 M NaCl, 5 mM MgCl2, 0.4 mM EDTA) was then added, and this mixture was split into 5× 3.5 μl samples. 1.8 μl 9.2 μM hnRNPG protein in storage buffer (10 mM TrisHCl (pH 7.4), 500 mM NaCl, 2.5 mM MgCl2, 10% v/v glycerol) and 4.7 μl Buffer A (20 mM TrisHCl (pH 7.4), 500 mM NaCl, 2.5 mM MgCl2, 0.2 mM EDTA) was then added. The final concentration for 32P-RNA was less than 0.1 μM. For samples with unlabeled RNA (2515-A or 2515-m6A), RNAPII CTD phosphor-S5 peptide (ab18488, abcam), or RNAPII CTD phosphor-S2 peptide (ab12793, abcam), they were diluted to the appropriate concentration in Buffer A and then added in lieu of Buffer A. Control reactions without hnRNPG substituted storage buffer (10 mM Tris-Cl (pH 7.4), 500 mM NaCl, 2.5 mM MgCl2, 10% v/v glycerol) for hnRNPG. The binding mixtures were rotated at 4 °C overnight in a total volume of 10 μl.
HnRNPG protein precipitation was initiated by diluting the above binding mixture to a final NaCl concentration of150 mM by adding 23.3 μl Buffer B (20 mM TrisHCl (pH 7.4), 0 mM NaCl, 2.5 mM MgCl2, 0.2 mM EDTA) and rotated at 4 °C for 1 hour. The mixtures were then centrifuged for 30 minutes at 17,000 g and 4 °C to pellet. Supernatant was separated from the pellet, and the pellet was resuspended in 33.3 μl Buffer A. 1, 2.5, and 6.25 μl of each sample was blotted onto filter paper. This blot was exposed on a phosphorimager plate and imaged using a BioRad Personal Molecular Imager. The resulting image was quantified using the Quantity One software.
HnRNPG spin-down assay for CTD binding
HnRNPG protein ± GST–CTD ± phosphorylation by CDK7 or CDK9 were pre-mixed at 0.5 M NaCl, then transferred to 0.15 M or 0.25 M NaCl followed by centrifugation.
To phosphorylate the GST–CTD, 0.75 ng of recombinant GST-tagged human RNAPII CTD (SRP2120, Sigma) were combined with 0.36 ng of CDK7–Cyclin H–MNAT1 (PV3868, Thermo) or CDK9–Cyclin T1 (14–685, Sigma) in 25 μL of 8 mM 3-(N-morpholino)propanesulfonic acid (MOPS) (pH 7), 0.2 mM EDTA, and 1 mM MgCl2 supplemented with freshly added 0.1 mM ATP and 0.25 mM DTT, and then incubated at 30 °C for 1 hour. Control reactions without ATP were incubated under the same condition. Binding mixtures using 2x GST-CTD instead utilized 1.5 ng of recombinant GST-tagged human RNAPII CTD and 0.72 ng of CDK7 or CDK9.
Initial binding mixtures were generated by adding 2.45 μl of the above phosphorylation reaction to 1.1 μl of either 9.2 or 18.4 μM hnRNPG in storage buffer (10 mM TrisHCl (pH 7.4), 500 mM NaCl, 2.5 mM MgCl2, 10% v/v glycerol) and 2.45 μl of 2x Buffer A (40 mM TrisHCl (pH 7.4), 1 M NaCl, 5 mM MgCl2, 0.4 mM EDTA). For binding mixtures with RNA, 1.63 μl of 3X Buffer A (60 mM TrisHCl (pH 7.4), 1.5 M NaCl, 7.5 mM MgCl2, 0.6 mM EDTA) and 0.82 μl of 25 or 50 μM 2515-A or 2515-m6A was added instead. The binding mixtures were rotated overnight at 4 °C overnight in a total volume of 6 μl.
Protein precipitation was initiated by diluting binding mixtures to either final 150 or 250 mM NaCl by adding either 14 μL Buffer B (20 mM Tris-Cl (pH 7.4), 0 mM NaCl, 2.5 mM MgCl2, 0.2 mM EDTA) or 2 μl 2X Buffer A and 12 μL Buffer B, respectively. These diluted binding mixtures were rotated for 1 hour at 4 °C in a total volume of 20 μl. The binding mixtures were then centrifuged for 1 hour at 17,000 g and 4 °C to pellet. Supernatant was separated from the pellet, and the pellet was resuspended in 20 μL Buffer B. 20 μL of 2x LDS (NP0008, Thermo), 50 mM EDTA was then added to each sample, and they were then incubated at 95 °C for 10 min. 20 μL of each sample was then loaded onto 12-well 4–12% polyacrylamide Bis-Tris gels (NP03322, Invitrogen) alongside a Novex™ Sharp Pre-stained Protein Standard (LC5800, Thermo) and ran at 150V for 1 hour. The gels were then silver stained using the Pierce™ Silver Stain Kit (24612, Thermo). Gels were imaged using a UVP BioDoc-It™ Imaging System. The intensities of each band were quantified using Image Studio software.
mRNA sequencing
HEK293T cells were transfected with hnRNPG siRNA and pCMV3-Flag (NCV) or pCMV3-Flag-RBMX (WT, RRMmut, RGG1mut, or RGG2mut) as described above, with three 100-mm-plate biological replicates for each of the five different plasmid transfections. Total RNA was extracted from HEK293T cells by Trizol (15596026, Thermo) extraction followed by an additional chloroform extraction. Libraries were prepared using the Tru-Seq Stranded mRNA LT Sample Prep Kit (RS-122–9005DOC, Illumina). The libraries were sequenced twice, and each time the 15 libraries were sequenced in two lanes of one flow cell by Illumina HiSeq 4000 with paired-end 100-bp reads at the University of Chicago Genomics Facility. The reads from both sequencing runs were combined for the analysis.
Chromatin PAR-CLIP
Three plates of HEK293T cells per biological replicate were fed with 200 μM 4-Thiouridine (T4905, Sigma) for 14 hours before collection. For each plate of cells, the media was aspirated, cells were washed twice with 5 mL ice-cold DPBS, and crosslinked twice on ice by 0.15 J/cm2 365 nm Ultraviolet light (CL-1000 Ultraviolent Crosslinker, UVP). The cells were then collected in ice-cold DPBS, collected by cell lifter, and pelleted at 500 × g for 5 minutes at 4 °C.
Chromatin extraction was performed based on a published protocol (Brugiolo et al., 2017). Briefly, the cell pellet was flicked to resuspend in 1.8 mL ice-cold NP-40 lysis buffer (10 mM Tris-HCl [pH 7.5], 0.05% NP40, 150 mM NaCl, 1% protease and phosphatase inhibitor (78440, Thermo)) and incubate on ice for 5 min. To separate the nuclei, the cell lysate was gently pipetted over 2.5 volumes of chilled sucrose cushion (NP-40 lysis buffer in 24% w/v sucrose) and centrifuged for at 15 K × g for 10 minutes at 4 °C. After removal of supernatant cytoplasmic extracts, the nuclei pellet was washed gently with 1 mL ice-cold 1X PBS/1 mM EDTA. The nuclei pellet was flicked to resuspend in 900 μL of pre-chilled glycerol buffer (20 mM Tris-HCl [pH 8.0], 75 mM NaCl, 0.5 mM EDTA, 0.85 mM DTT, 1% protease and phosphatase inhibitor, 50% glycerol) before mixed with 3.6 mL of nuclei lysis buffer (10 mM Tris-HCl [pH 7.5], 1 mM DTT, 7.5 mM MgCl2, 0.2 mM EDTA, 0.3 M NaCl, 1 M Urea, 1% NP-40, 1% protease and phosphatase inhibitor). After a 5-second vortex and a 10-min incubation on ice, the lysate was centrifuged at 15 K × g for 10 minutes at 4 °C to pellet the chromatin. Finally, the chromatin pellet was rinse with PBS and then digested in 900 μL chromatin extraction buffer (20 mM Tris-Cl [pH 7.5], 100 mM KCl, 2 mM MgCl2, 2.5 mM CaCl2, 0.3 M sucrose, and 0.1% v/v Triton X-100, 1% protease and phosphatase inhibitor) with 5 U/mL Micrococcal Nuclease (N3755, Sigma) by shaking at 4 °C for 2 hours. 5 mM of EDTA was added to quench the reaction, and the chromatin lysate was cleared at 2 K × g for 10 minutes at 4 °C.
For immunoprecipitation, the chromatin exact was combined with 5 μg of rabbit anti-hnRNPG antibody (Ab190352, abcam) and rotated overnight at 4 °C. 100 μL pre-washed Protein A beads (10002D, Thermo) was added to the reaction and rotated for another 4 hours at 4 °C. The beads were then separated by being placed on a magnetic rack and washed with 1 mL IP wash buffer × 2 (50 mM Tris-HCl [pH 7.5], 300 mM NaCl, 0.1% v/v Triton X-100), 1 mL High-salt wash buffer × 2 (50 mM Tris-HCl [pH 7.5], 500 mM NaCl, 0.1% v/v Triton X-100), and 1 mL PNK buffer × 2 (50 mM Tris-Cl [pH 7.5], 50 mM NaCl, 10 mM MgCl2). Co-immunoprecipitated RNA fragments were end-repaired on-beads by (1) 1 U/μL T4 PNK (EK0031, Thermo) in 100 μL 1× PNK buffer A (Thermo) at 37 °C for 20 min with vigorous shaking; and then (2) 1 mM ATP (final concentration) with extra 0.5 U/μL T4 PNK at 37 °C for another 20 min. After another two washes with PNK buffer, the beads were resuspended in 80 μL 2 × Laemmli sample buffer and boiled at 95 °C for 5 min.
The hnRNPG-RNA complex was size-selected by SDS-PAGE (45–70 kDa). To extract the RNA, the gel slices were mashed and digested with 2 mg/ml protease K (25530049, Thermo) at 55°C for 1 hour. Then gel particles were filter out, and the RNA was purified by Acid-Phenol:Chloroform extraction and overnight ethanol precipitation. RNA libraries were generated using NEBNext multiplex small RNA library preparation kit (NEB, E7300S) and sequenced on NextSeq500 with single end 84-bp read length.
ChIP-seq
We followed the protocol of ChIP-IT® Express kit (53008, Active motif) with Spike-in normalization strategy. One 15 cm of HEK293T cells were collected 48 hours after transfection with 20 nM control siRNA (1027281, Qiagen) or hnRNPG siRNA (G1: SI00700077, Qiagen; G2: SI00700084, Qiagen). The cells were fixed on plates with 1% w/v formaldehyde (28906, Thermo) in the culture media for 10 min at room temperature with gently shaking. After quenching the crosslinking reaction by 125 mM glycine for 5 min, the cells were rinsed with ice-cold PBS twice, scraped by a cell lifter, and pelleted at 500 × g for 5 minutes at 4 °C.
The chromatin was sheared according to the kit’s manual. Briefly, the cell pellet was resuspended in 1 mL ice-cold “Lysis Buffer” and incubated on ice for 30 min. After homogenization with 30 strokes on ice in the dounce homogenizer, the nuclei were pelleted at 2.4 K × g for 10 minutes at 4 °C. The nuclei pellet was then resuspended in 350 μL “Shearing Buffer”, made into aliquots of 100 μL in 0.65 ml microtubes (C30010011, Diagenode), and sonicated with Bioruptor® Pico sonicator (20 sec on, 30 sec off, 10 cycles) to 200 to 500 bp in size. The sheared chromatin samples were cleared by centrifuge at 18 K × g for 10 minutes at 4 °C. 10 μL of the chromatin was heat-recrosslinked, treated with RNase A and Protease K to determine chromatin yield. The rest of the chromatin samples were adjusted to a concentration of 0.2 μg/μL in the “Shearing Buffer”.
The Spike-in chromatin (53083, Active motif) was added to final concentration of 0.1 ng/μL. 10 μL of the chromatin with Spike-in was aliquoted and saved as “Input”. For each of the siControl, sihnRNPG-3, and sihnRNPG-4 samples, a ~200 μL immunoprecipitation (IP) reaction was set up with the following components: 101 μL chromatin with Spike-in, 25 μL “Protein G Magnetic Beads”, 20 μL “ChIP Buffer 1”, 2 μL “Protease Inhibitor Cocktail”, 1 μL Spike-in antibody (61686, Active Motif), 46 μL H2O, and 5 μg of the respective following antibodies: anti-Pol II (664912, BioLegend), anti-Pol II S2P (MABI0602, MBL life science), and anti-Pol II S5P (ab5131, abcam). The IP reactions were rotated overnight at 4 °C before washed once with 800 μL “ChIP Buffer 1” and twice with 800 μL “ChIP Buffer 2”. The “IP” chromatin was eluted, reverse cross-linked, and treated with RNase A and Protease K in parallel with “Input” according to the kit’s manual. DNA was purified with DNA Clean & Concentrator-5 (D4013, Zymo research). DNA libraries were generated with the KAPA Hyper Prep Kit (KK8502, KapaBiosystems) and sequenced on NextSeq500 with single end 84-bp read length.
RT–qPCR and RT–PCR
Total RNA, collected for mRNA sequencing as described above, was reverse transcribed using the SuperScript III First-Strand Synthesis System (18080–051, Thermo). For validation of changes in transcript abundance, reverse transcription was followed by quantitative PCR using Power SYBR Green PCR Master Mix (4367659, Thermo Scientific) under the following conditions: 95 °C for 10 minutes; 40 cycles of [95 °C for 15 seconds, 60 °C for 1 minute]. For validation of splicing changes, the cDNA was amplified using Taq DNA Polymerase (EP0401, Thermo) under the following conditions: 95 °C for 3 minutes, 30 cycles of [95 °C for 30 seconds, 50 °C for 30 seconds, 72 °C for 1 minute], and 72 °C for 10 minutes. The RT–PCR products were resolved on a 10% polyacrylamide Novex TBE gel (EC62762BOX, Thermo) and stained with SYBR Gold Nucleic Acid Gel Stain (S11494, Thermo).
Quantification and Statistical Analysis
Western blot quantification
For quantification of co-immunoprecipitation, Western blot bands were quantified using ImageLab software, and RNAPII bands were normalized to hnRNPG bands and to input as follows: (RNAPIIIP / hnRNPGIP) / (RNAPIIinput / hnRNPGinput), where XY is the intensity of band X in lane Y.
Gel quantification
For limited proteolysis, bands on denaturing protein gels were quantified using ImageJ, and the fractions of full-length hnRNPG in each lane were calculated and fit to a single exponential function to derive the half-life (t1/2).
For RT–PCR validation of splicing, bands on native acrylamide gels were quantified using ImageJ and used to calculate the ratio of exon inclusion to exon exclusion.
mRNA sequencing analysis
The mRNA sequencing data from this study (NCV, WT, RRMmut, RGG1mut, RGG2mut) and from two previous studies were aligned to the human genome version hg19 using the STAR computer program version 2.5.3a (Dobin et al., 2013) with soft-clipping, yielding approximately 266 million (this study, Table S1) and 132 million (Liu et al., 2017) mapped reads per sample. Gene and exon boundaries from RefSeq (O’Leary et al., 2016) were extracted from the University of California Santa Cruz (UCSC) table browser (Karolchik et al., 2004) for human genome version hg19. Differential expression levels of exons and genes in RefSeq were analyzed using featureCounts (Liao et al., 2014) followed by DEseq2 (Love et al., 2014). The fold change (FC) in gene and exon expression levels was calculated as log2(Counts[NCV or mut] / CountsWT) for NCV, RRMmut, RGG1mut, and RGG2mut, or as log2(CountsKD / CountsControl) for hnRNPG, METTL3, and METTL14 knockdowns (KD). Biological relevance (fold change) and statistical significance were considered simultaneously via the π value = −log2(FC) log10(p-value) (Xiao et al., 2014). Differentially expressed genes and exons were selected using the threshold | π value | ≥ 0.4292, which corresponds to significance level α = 0.1 under assumption of independence between fold change and p-value (volcano plots show broad range of p-values for a given fold change, and a broad range in fold change for a given p-value). Co-down- or co -up-regulated exons were exons that were differentially expressed, with log2(FC) < 0 or log2(FC) > 0, respectively, both upon hnRNPG KD and upon either METTL3 KD or METTL14 KD. Differentially spliced exons were identified as differentially expressed exons (DEE) for which log2(FCDEE) – log2(FCnonDEE) > 0.9 log2(FCDEE) for some non-differentially expressed exon (nonDEE) in the same gene. Based on this analysis, the majority of differentially expressed exons were also differentially spliced exons, and differentially spliced exons showed the same patterns of down- versus up-regulation as differentially expressed exons: RRMmut sequencing yielded 3191 down-regulated and 894 up-regulated differentially spliced exons, RGG1mut yielded 503 down- and 433 up-regulated differentially spliced exons, and RGG2mut yielded 3574 down- and 944 up-regulated differentially spliced exons relative to WT. For correlation plots comparing changes in gene or exon expression in different samples, genes or exons that were differentially expressed in either NCV, RRMmut, RGG1mut, or RGG2mut based on the | π value | ≥ 0.4292 threshold were combined. The union of differentially expressed genes or exons was plotted to compare the log2(FC) in two different sequencing samples relative to WT. The Pearson correlation coefficient r, and the associated p-value based on the Fisher transformation, were calculated using R statistical software. Model II major axis linear regression was performed using lmodel2 in R statistical software. Gene ontology (GO) analysis was performed using the enrichment analysis tool provided by the Gene Ontology Consortium (Ashburner et al., 2000; Mi et al., 2017; The Gene Ontology Consortium, 2017).
Analysis of hnRNPG-bound m6A site distribution
Reads from previously published photoactivatable ribonucleoside-enhanced crosslinking and immunoprecipitation (PAR-CLIP) followed by methylated RNA immunoprecipitation (MeRIP) sequencing data (Liu et al., 2017) were aligned to the human genome version hg19 using the STAR computer program version 2.5.3a (Dobin et al., 2013) with soft-clipping, yielding approximately 17.7 million reads (standard deviation: 15.2 million) for each sample. The hnRNPG-bound m6A sites were identified based on two criteria. First, hnRNPG binding sites were identified based on PAR-CLIP T-to-C mutation profiles uncovered using PARalyzer version 1.1 (Corcoran et al., 2011). Second, hnRNPG-bound m6A sites were identified within hnRNPG binding sites based on positive enrichment of m6A-immunoprecipitated fragment counts relative to input at RRACH sites. Positive enrichment was defined using the threshold π value = −log2(FC) log10(p-value) ≥ 0.4292, where log2(FC) is the winscore defined by (Dominissini et al., 2012) at RRACH sites found in hg19 reference chromosomal sequences (direct search for RRACH sequence motif for sites on + strand, and direct search for DGTYY motif for sites on − strand). For the analysis of the distribution of hnRNPG-bound m6A sites around the splice sites of differentially regulated exons, we identified all the hnRNPG-bound m6A sites with position x relative to the splice site (defined as position 0) such that −300 ≤ x ≤ +300 nucleotides, for either the 3′ or 5′ splice sites of any of the differentially regulated exons in the selected category. For instance, for the red curve in Figure 4D, we identified all hnRNPG-bound m6A sites that occurred within 300 nucleotides of the 3′ splice site of any of the exons co-down-regulated upon hnRNPG KD and either METTL3 KD or METTL14 KD. For each category of differentially expressed exons, the distribution of hnRNPG-bound m6A sites around each splice site was converted by kernel density estimation using R statistical software. The resulting density at each position was multiplied by the constant n / m, where n is the total number of hnRNPG-bound m6A sites within 300 nucleotides of the splice site, and m is the total number of differentially expressed exons in the selected category. The resulting value at each position corresponds to the mean number of hnRNPG-bound m6A sites per exon at that position, among all differentially expressed exons in the selected category. These values (sites/exon) were plotted at each position x, with −250 ≤ x ≤ +250, in Figs. 3C, 4E, and S6C. Rapid identification of overlapping genomic features was made possible by BEDTools intersect function version 2.17.0 (Quinlan and Hall, 2010).
ChIP-seq data Analysis
Pol ll, Pol ll S2P and Pol ll S5P ChIP-seq reads were send to trim-galore to remove adapter contamination and low-quality sequences, trimmed sequences were mapped with Bowtie (v2.2.6) using default parameters. Duplicate reads were removed by samtools rmdup -s. Unique and monoclonal mapped reads were extended to 150 bp based on the average sonicated chromatin DNA length. Spike-in reads were mapped to drosophila genome(dm6) using same parameters. Pol ll, Pol ll S2P and Pol ll S5P peaks were called using MACS2 with broad peak mode and default settings(qvalue=0.01). genomeCoverageBed (bedtools) was used to transfer bed files to bedGraph files, then Spike-in read numbers were used as a normalization factor that equalizes the signal across samples. We used deeptools to do the Pol ll, Pol ll S2P and Pol ll S5P distribution analysis on 5’ and 3’ splice sites regions (−250bp - 250bp). (ComputeMatrix reference-point --referencePoint center -R hnRNPG_regulated_exon.5/3splicesite.bed -S siC-Pol2.bigWig sihnG1-Pol2.bigWig sihnG2-Pol2.bigWig -b 250 -a 250 --skipZeros --binSize 1 --samplesLabel siC sihnG1 sihnG2 --missingDataAsZero -p 30 -o Pol2_on_hnRNPG_regulated_exon.5/3splicesite.matrix.mat.gz &; plotProfile -m Pol2_on_hnRNPG_regulated_exon.5/3splicesite.matrix.mat.gz --plotHeight 7 --plotWidth 9 --samplesLabel siC sihnG-1 sihnG-2 --colors red blue green --perGroup -out Pol2_on_hnRNPG_regulated_exon.5/3splicesite_Profile.png &).
Data and Software Availability
The sequencing data have been deposited to the National Center for Biotechnology Information Gene Expression Omnibus database under accession number GSE114311. Mendeley data are available at http://dx.doi.org/10.17632/5hrrjww3xc.1. Additional processed data are available from the authors upon request.
Supplementary Material
Highlights.
The m6A reader protein hnRNPG interacts with RNA polymerase II using an RGG region.
HnRNPG binds to nascent m6A-modified pre-mRNA and regulates alternative splicing.
M6A is enriched in exonic regions near splice sites of hnRNPG-regulated exons.
HnRNPG affects RNA polymerase II occupancy around hnRNPG-regulated exons.
Acknowledgements
We thank all members of the Pan lab and Dr. Jingyi Fei for helpful discussion. We thank Dr. Qing Dai for chemical synthesis of RNA oligonucleotides, and Drs. Gabriel Salzman and Demet Araç-Özkan for guidance with protein purification. We thank the University of Chicago BioPhysics Core Facility, Integrated Light Microscopy Core Facility, and Genomics Facility for assistance with biophysics, microscopy, and sequencing experiments. This work was supported by the National Institutes of Health (R01GM113194, RM1HG008935 to T.P.; F30GM120917 to K.I.Z.), the National Institutes of Health Medical Scientist Training Program grant (T32GM007281), and the University of Chicago Biological Sciences Division and Frank Family Endowment (K.I.Z.).
Footnotes
Publisher's Disclaimer: This is a PDF file of an unedited manuscript that has been accepted for publication. As a service to our customers we are providing this early version of the manuscript. The manuscript will undergo copyediting, typesetting, and review of the resulting proof before it is published in its final citable form. Please note that during the production process errors may be discovered which could affect the content, and all legal disclaimers that apply to the journal pertain.
Declaration of Interests
The authors declare no competing interests.
References
- Alarcón CR, Goodarzi H, Lee H, Liu X, Tavazoie S, and Tavazoie SF (2015). HNRNPA2B1 Is a Mediator of m6A-Dependent Nuclear RNA Processing Events. Cell 162, 1299–1308. [DOI] [PMC free article] [PubMed] [Google Scholar]
- Araç D, Boucard AA, Bolliger MF, Nguyen J, Soltis SM, Südhof TC, and Brunger AT (2012). A novel evolutionarily conserved domain of cell-adhesion GPCRs mediates autoproteolysis. EMBO J 31, 1364–1378. [DOI] [PMC free article] [PubMed] [Google Scholar]
- Ashburner M, Ball CA, Blake JA, Botstein D, Butler H, Cherry JM, Davis AP, Dolinski K, Dwight SS, Eppig JT, et al. (2000). Gene ontology: tool for the unification of biology. The Gene Ontology Consortium. Nat. Genet 25, 25–29. [DOI] [PMC free article] [PubMed] [Google Scholar]
- Barbieri I, Tzelepis K, Pandolfini L, Shi J, Millán-Zambrano G, Robson SC, Aspris D, Migliori V, Bannister AJ, Han N, et al. (2017). Promoter-bound METTL3 maintains myeloid leukaemia by m6A-dependent translation control. Nature 552, 126–131. [DOI] [PMC free article] [PubMed] [Google Scholar]
- Bartosovic M, Molares HC, Gregorova P, Hrossova D, Kudla G, and Vanacova S (2017). N6-methyladenosine demethylase FTO targets pre-mRNAs and regulates alternative splicing and 3’-end processing. Nucleic Acids Res 45, 11356–11370. [DOI] [PMC free article] [PubMed] [Google Scholar]
- Bentley DL (2014). Coupling mRNA processing with transcription in time and space. Nat. Rev. Genet 15, 163–175. [DOI] [PMC free article] [PubMed] [Google Scholar]
- Borsos BN, Huliák I, Majoros H, Ujfaludi Z, Gyenis Á, Pukler P, Boros IM, and Pankotai T (2017). Human p53 interacts with the elongating RNAPII complex and is required for the release of actinomycin D induced transcription blockage. Sci Rep 7, 40960. [DOI] [PMC free article] [PubMed] [Google Scholar]
- Brugiolo M, Botti V, Liu N, Muller-McNicoll M, and Neugebauer KM (2017). Fractionation iCLIP detects persistent SR protein binding to conserved, retained introns in chromatin, nucleoplasm and cytoplasm. Nucleic Acids Research 45, 10452–10465. [DOI] [PMC free article] [PubMed] [Google Scholar]
- Burke KA, Janke AM, Rhine CL, and Fawzi NL (2015). Residue-by-Residue View of In Vitro FUS Granules that Bind the C-Terminal Domain of RNA Polymerase II. Mol. Cell 60, 231–241. [DOI] [PMC free article] [PubMed] [Google Scholar]
- Corcoran DL, Georgiev S, Mukherjee N, Gottwein E, Skalsky RL, Keene JD, and Ohler U (2011). PARalyzer: definition of RNA binding sites from PAR-CLIP short-read sequence data. Genome Biol 12, R79. [DOI] [PMC free article] [PubMed] [Google Scholar]
- Dai Q, Fong R, Saikia M, Stephenson D, Yu Y. -t., Pan T, and Piccirilli JA (2007). Identification of recognition residues for ligation-based detection and quantitation of pseudouridine and N6-methyladenosine. Nucleic Acids Research 35, 6322–6329. [DOI] [PMC free article] [PubMed] [Google Scholar]
- Dichmann DS, Fletcher RB, and Harland RM (2008). Expression cloning in Xenopus identifies RNA-binding proteins as regulators of embryogenesis and Rbmx as necessary for neural and muscle development. Dev. Dyn 237, 1755–1766. [DOI] [PMC free article] [PubMed] [Google Scholar]
- Dobin A, Davis CA, Schlesinger F, Drenkow J, Zaleski C, Jha S, Batut P, Chaisson M, and Gingeras TR (2013). STAR: ultrafast universal RNA-seq aligner. Bioinformatics 29, 15–21. [DOI] [PMC free article] [PubMed] [Google Scholar]
- Dominissini D, Moshitch-Moshkovitz S, Schwartz S, Salmon-Divon M, Ungar L, Osenberg S, Cesarkas K, Jacob-Hirsch J, Amariglio N, Kupiec M, et al. (2012). Topology of the human and mouse m6A RNA methylomes revealed by m6A-seq. Nature 485, 201–206. [DOI] [PubMed] [Google Scholar]
- Dosztányi Z, Csizmok V, Tompa P, and Simon I (2005a). IUPred: web server for the prediction of intrinsically unstructured regions of proteins based on estimated energy content. Bioinformatics 21, 3433–3434. [DOI] [PubMed] [Google Scholar]
- Dosztányi Z, Csizmók V, Tompa P, and Simon I (2005b). The pairwise energy content estimated from amino acid composition discriminates between folded and intrinsically unstructured proteins. J. Mol. Biol 347, 827–839. [DOI] [PubMed] [Google Scholar]
- Egan B, Yuan C-C, Craske ML, Labhart P, Guler GD, Arnott D, Maile TM, Busby J, Henry C, Kelly TK, et al. (2016). An Alternative Approach to ChIP-Seq Normalization Enables Detection of Genome-Wide Changes in Histone H3 Lysine 27 Trimethylation upon EZH2 Inhibition. PLoS ONE 11, e0166438. [DOI] [PMC free article] [PubMed] [Google Scholar]
- Ferrer CM, Alders M, Postma AV, Park S, Klein MA, Cetinbas M, Pajkrt E, Glas A, van Koningsbruggen S, Christoffels VM, et al. (2018). An inactivating mutation in the histone deacetylase SIRT6 causes human perinatal lethality. Genes Dev 32, 373–388. [DOI] [PMC free article] [PubMed] [Google Scholar]
- Fu X-D, and Ares M (2014). Context-dependent control of alternative splicing by RNA-binding proteins. Nature Reviews Genetics 15, 689–701. [DOI] [PMC free article] [PubMed] [Google Scholar]
- Gerstberger S, Hafner M, and Tuschl T (2014). A census of human RNA-binding proteins. Nat. Rev. Genet 15, 829–845. [DOI] [PMC free article] [PubMed] [Google Scholar]
- Groisman R, Polanowska J, Kuraoka I, Sawada J, Saijo M, Drapkin R, Kisselev AF, Tanaka K, and Nakatani Y (2003). The ubiquitin ligase activity in the DDB2 and CSA complexes is differentially regulated by the COP9 signalosome in response to DNA damage. Cell 113, 357–367. [DOI] [PubMed] [Google Scholar]
- Harlen KM, and Churchman LS (2017). The code and beyond: transcription regulation by the RNA polymerase II carboxy-terminal domain. Nat. Rev. Mol. Cell Biol 18, 263–273. [DOI] [PubMed] [Google Scholar]
- Hnisz D, Shrinivas K, Young RA, Chakraborty AK, and Sharp PA (2017). A Phase Separation Model for Transcriptional Control. Cell 169, 13–23. [DOI] [PMC free article] [PubMed] [Google Scholar]
- Hofmann Y, and Wirth B (2002). hnRNP-G promotes exon 7 inclusion of survival motor neuron (SMN) via direct interaction with Htra2-β1. Human Molecular Genetics 11, 2037–2049. [DOI] [PubMed] [Google Scholar]
- Hsin J-P, and Manley JL (2012). The RNA polymerase II CTD coordinates transcription and RNA processing. Genes Dev 26, 2119–2137. [DOI] [PMC free article] [PubMed] [Google Scholar]
- Huang H, Weng H, Zhou K, Wu T, Zhao BS, Sun M, Chen Z, Deng X, Xiao G, Auer F, et al. (2019). Histone H3 trimethylation at lysine 36 guides m6A RNA modification co-transcriptionally. Nature 567, 414–419. [DOI] [PMC free article] [PubMed] [Google Scholar]
- Ip JY, Schmidt D, Pan Q, Ramani AK, Fraser AG, Odom DT, and Blencowe BJ (2011). Global impact of RNA polymerase II elongation inhibition on alternative splicing regulation. Genome Res 21, 390–401. [DOI] [PMC free article] [PubMed] [Google Scholar]
- Jia G, Fu Y, Zhao X, Dai Q, Zheng G, Yang Y, Yi C, Lindahl T, Pan T, Yang Y-G, et al. (2011). N6-Methyladenosine in nuclear RNA is a major substrate of the obesity-associated FTO. Nature Chemical Biology 7, 885–887. [DOI] [PMC free article] [PubMed] [Google Scholar]
- Kanhoush R, Beenders B, Perrin C, Moreau J, Bellini M, and Penrad-Mobayed M (2010). Novel domains in the hnRNP G/RBMX protein with distinct roles in RNA binding and targeting nascent transcripts. Nucleus 1, 109–122. [DOI] [PMC free article] [PubMed] [Google Scholar]
- Karolchik D, Hinrichs AS, Furey TS, Roskin KM, Sugnet CW, Haussler D, and Kent WJ (2004). The UCSC Table Browser data retrieval tool. Nucleic Acids Res 32, D493–496. [DOI] [PMC free article] [PubMed] [Google Scholar]
- Kasowitz SD, Ma J, Anderson SJ, Leu NA, Xu Y, Gregory BD, Schultz RM, and Wang PJ (2018). Nuclear m6A reader YTHDC1 regulates alternative polyadenylation and splicing during mouse oocyte development. PLoS Genet 14, e1007412. [DOI] [PMC free article] [PubMed] [Google Scholar]
- Ke S, Pandya-Jones A, Saito Y, Fak JJ, Vågbø CB, Geula S, Hanna JH, Black DL, Darnell JE, and Darnell RB (2017). m6A mRNA modifications are deposited in nascent pre-mRNA and are not required for splicing but do specify cytoplasmic turnover. Genes Dev 31, 990–1006. [DOI] [PMC free article] [PubMed] [Google Scholar]
- Kent WJ, Zweig AS, Barber G, Hinrichs AS, and Karolchik D (2010). BigWig and BigBed: enabling browsing of large distributed datasets. Bioinformatics 26, 2204–2207. [DOI] [PMC free article] [PubMed] [Google Scholar]
- Knuckles P, Carl SH, Musheev M, Niehrs C, Wenger A, and Bühler M (2017). RNA fate determination through cotranscriptional adenosine methylation and microprocessor binding. Nat. Struct. Mol. Biol 24, 561–569. [DOI] [PubMed] [Google Scholar]
- Kornblihtt AR, Schor IE, Alló M, Dujardin G, Petrillo E, and Muñoz MJ (2013). Alternative splicing: a pivotal step between eukaryotic transcription and translation. Nat. Rev. Mol. Cell Biol 14, 153–165. [DOI] [PubMed] [Google Scholar]
- Kwon I, Kato M, Xiang S, Wu L, Theodoropoulos P, Mirzaei H, Han T, Xie S, Corden JL, and McKnight SL (2013). Phosphorylation-Regulated Binding of RNA Polymerase II to Fibrous Polymers of Low-Complexity Domains. Cell 155, 1049–1060. [DOI] [PMC free article] [PubMed] [Google Scholar]
- Langmead B, and Salzberg SL (2012). Fast gapped-read alignment with Bowtie 2. Nat. Methods 9, 357–359. [DOI] [PMC free article] [PubMed] [Google Scholar]
- Li H, Handsaker B, Wysoker A, Fennell T, Ruan J, Homer N, Marth G, Abecasis G, Durbin R, and 1000 Genome Project Data Processing Subgroup (2009). The Sequence Alignment/Map format and SAMtools. Bioinformatics 25, 2078–2079. [DOI] [PMC free article] [PubMed] [Google Scholar]
- Liao Y, Smyth GK, and Shi W (2014). featureCounts: an efficient general purpose program for assigning sequence reads to genomic features. Bioinformatics 30, 923–930. [DOI] [PubMed] [Google Scholar]
- Lindorff-Larsen K, Piana S, Dror RO, and Shaw DE (2011). How fast-folding proteins fold. Science 334, 517–520. [DOI] [PubMed] [Google Scholar]
- Liu J, Yue Y, Han D, Wang X, Fu Y, Zhang L, Jia G, Yu M, Lu Z, Deng X, et al. (2014). A METTL3-METTL14 complex mediates mammalian nuclear RNA N6-adenosine methylation. Nat Chem Biol 10, 93–95. [DOI] [PMC free article] [PubMed] [Google Scholar]
- Liu N, Dai Q, Zheng G, He C, Parisien M, and Pan T (2015). N6-methyladenosine-dependent RNA structural switches regulate RNA–protein interactions. Nature 518, 560–564. [DOI] [PMC free article] [PubMed] [Google Scholar]
- Liu N, Zhou KI, Parisien M, Dai Q, Diatchenko L, and Pan T (2017). N6-methyladenosine alters RNA structure to regulate binding of a low-complexity protein. Nucleic Acids Res 45, 6051–6063. [DOI] [PMC free article] [PubMed] [Google Scholar]
- Ljungman M, and Hanawalt PC (1996). The anti-cancer drug camptothecin inhibits elongation but stimulates initiation of RNA polymerase II transcription. Carcinogenesis 17, 31–35. [DOI] [PubMed] [Google Scholar]
- Louloupi A, Ntini E, Conrad T, and Ørom UAV (2018). Transient N-6-Methyladenosine Transcriptome Sequencing Reveals a Regulatory Role of m6A in Splicing Efficiency. Cell Rep 23, 3429–3437. [DOI] [PubMed] [Google Scholar]
- Love MI, Huber W, and Anders S (2014). Moderated estimation of fold change and dispersion for RNA-seq data with DESeq2. Genome Biol 15, 550. [DOI] [PMC free article] [PubMed] [Google Scholar]
- Mayer A, di Iulio J, Maleri S, Eser U, Vierstra J, Reynolds A, Sandstrom R, Stamatoyannopoulos JA, and Churchman LS (2015). Native elongating transcript sequencing reveals human transcriptional activity at nucleotide resolution. Cell 161, 541–554. [DOI] [PMC free article] [PubMed] [Google Scholar]
- Mayer A, Landry HM, and Churchman LS (2017). Pause & go: from the discovery of RNA polymerase pausing to its functional implications. Current Opinion in Cell Biology 46, 72–80. [DOI] [PMC free article] [PubMed] [Google Scholar]
- Meyer KD, Saletore Y, Zumbo P, Elemento O, Mason CE, and Jaffrey SR (2012). Comprehensive Analysis of mRNA Methylation Reveals Enrichment in 3′ UTRs and near Stop Codons. Cell 149, 1635–1646. [DOI] [PMC free article] [PubMed] [Google Scholar]
- Mi H, Huang X, Muruganujan A, Tang H, Mills C, Kang D, and Thomas PD (2017). PANTHER version 11: expanded annotation data from Gene Ontology and Reactome pathways, and data analysis tool enhancements. Nucleic Acids Res 45, D183–D189. [DOI] [PMC free article] [PubMed] [Google Scholar]
- Moursy A, Allain FH-T, and Clery A (2014). Characterization of the RNA recognition mode of hnRNP G extends its role in SMN2 splicing regulation. Nucleic Acids Research 42, 6659–6672. [DOI] [PMC free article] [PubMed] [Google Scholar]
- Muñoz MJ, de la Mata M, and Kornblihtt AR (2010). The carboxy terminal domain of RNA polymerase II and alternative splicing. Trends Biochem. Sci 35, 497–504. [DOI] [PubMed] [Google Scholar]
- Nojima T, Gomes T, Grosso ARF, Kimura H, Dye MJ, Dhir S, Carmo-Fonseca M, and Proudfoot NJ (2015). Mammalian NET-Seq Reveals Genome-wide Nascent Transcription Coupled to RNA Processing. Cell 161, 526–540. [DOI] [PMC free article] [PubMed] [Google Scholar]
- Nojima T, Rebelo K, Gomes T, Grosso AR, Proudfoot NJ, and Carmo-Fonseca M (2018). RNA Polymerase II Phosphorylated on CTD Serine 5 Interacts with the Spliceosome during Co-transcriptional Splicing. Mol. Cell 72, 369–379.e4. [DOI] [PMC free article] [PubMed] [Google Scholar]
- Okada M, and Fukagawa T (2006). Purification of a protein complex that associates with chromatin. Protocol Exchange DOI: 10.1038/nprot.2006.417. [DOI] [Google Scholar]
- O’Leary NA, Wright MW, Brister JR, Ciufo S, Haddad D, McVeigh R, Rajput B, Robbertse B, Smith-White B, Ako-Adjei D, et al. (2016). Reference sequence (RefSeq) database at NCBI: current status, taxonomic expansion, and functional annotation. Nucleic Acids Res 44, D733–745. [DOI] [PMC free article] [PubMed] [Google Scholar]
- Ozdilek BA, Thompson VF, Ahmed NS, White CI, Batey RT, and Schwartz JC (2017). Intrinsically disordered RGG/RG domains mediate degenerate specificity in RNA binding. Nucleic Acids Res 45, 7984–7996. [DOI] [PMC free article] [PubMed] [Google Scholar]
- Patil DP, Chen C-K, Pickering BF, Chow A, Jackson C, Guttman M, and Jaffrey SR (2016). m(6)A RNA methylation promotes XIST-mediated transcriptional repression. Nature 537, 369–373. [DOI] [PMC free article] [PubMed] [Google Scholar]
- Ping X-L, Sun B-F, Wang L, Xiao W, Yang X, Wang W-J, Adhikari S, Shi Y, Lv Y, Chen Y-S, et al. (2014). Mammalian WTAP is a regulatory subunit of the RNA N6-methyladenosine methyltransferase. Cell Res 24, 177–189. [DOI] [PMC free article] [PubMed] [Google Scholar]
- Qiao Y, Zhou B, Zhang M, Liu W, Han Z, Song C, Yu W, Yang Q, Wang R, Wang S, et al. (2016). A Novel Inhibitor of the Obesity-Related Protein FTO. Biochemistry 55, 1516–1522. [DOI] [PubMed] [Google Scholar]
- Quinlan AR, and Hall IM (2010). BEDTools: a flexible suite of utilities for comparing genomic features. Bioinformatics 26, 841–842. [DOI] [PMC free article] [PubMed] [Google Scholar]
- Ramírez F, Dündar F, Diehl S, Grüning BA, and Manke T (2014). deepTools: a flexible platform for exploring deep-sequencing data. Nucleic Acids Res 42, W187–191. [DOI] [PMC free article] [PubMed] [Google Scholar]
- Roignant J-Y, and Soller M (2017). m6A in mRNA: An Ancient Mechanism for Fine-Tuning Gene Expression. Trends Genet 33, 380–390. [DOI] [PubMed] [Google Scholar]
- Roundtree IA, Evans ME, Pan T, and He C (2017). Dynamic RNA Modifications in Gene Expression Regulation. Cell 169, 1187–1200. [DOI] [PMC free article] [PubMed] [Google Scholar]
- Schwartz JC, Wang X, Podell ER, and Cech TR (2013). RNA Seeds Higher-Order Assembly of FUS Protein. Cell Reports 5, 918–925. [DOI] [PMC free article] [PubMed] [Google Scholar]
- Shashi V, Xie P, Schoch K, Goldstein DB, Howard TD, Berry MN, Schwartz CE, Cronin K, Sliwa S, Allen A, et al. (2015). The RBMX gene as a candidate for the Shashi X-linked intellectual disability syndrome: RBMX gene for SMRXS. Clinical Genetics 88, 386–390. [DOI] [PubMed] [Google Scholar]
- Shukla S, Kavak E, Gregory M, Imashimizu M, Shutinoski B, Kashlev M, Oberdoerffer P, Sandberg R, and Oberdoerffer S (2011). CTCF-promoted RNA polymerase II pausing links DNA methylation to splicing. Nature 479, 74–79. [DOI] [PMC free article] [PubMed] [Google Scholar]
- Skinner JJ, Yu W, Gichana EK, Baxa MC, Hinshaw JR, Freed KF, and Sosnick TR (2014). Benchmarking all-atom simulations using hydrogen exchange. Proc. Natl. Acad. Sci. U.S.A 111, 15975–15980. [DOI] [PMC free article] [PubMed] [Google Scholar]
- Slobodin B, Han R, Calderone V, Vrielink JAFO, Loayza-Puch F, Elkon R, and Agami R (2017). Transcription Impacts the Efficiency of mRNA Translation via Co-transcriptional N6-adenosine Methylation. Cell 169, 326–337.e12. [DOI] [PMC free article] [PubMed] [Google Scholar]
- Sordet O, Larochelle S, Nicolas E, Stevens EV, Zhang C, Shokat KM, Fisher RP, and Pommier Y (2008). Hyperphosphorylation of RNA polymerase II in response to topoisomerase I cleavage complexes and its association with transcription- and BRCA1-dependent degradation of topoisomerase I. J. Mol. Biol 381, 540–549. [DOI] [PMC free article] [PubMed] [Google Scholar]
- Tang C, Klukovich R, Peng H, Wang Z, Yu T, Zhang Y, Zheng H, Klungland A, and Yan W (2018). ALKBH5-dependent m6A demethylation controls splicing and stability of long 3’-UTR mRNAs in male germ cells. Proc. Natl. Acad. Sci. U.S.A 115, E325–E333. [DOI] [PMC free article] [PubMed] [Google Scholar]
- Thandapani P, O’Connor TR, Bailey TL, and Richard S (2013). Defining the RGG/RG Motif. Molecular Cell 50, 613–623. [DOI] [PubMed] [Google Scholar]
- The Gene Ontology Consortium (2017). Expansion of the Gene Ontology knowledgebase and resources. Nucleic Acids Res 45, D331–D338. [DOI] [PMC free article] [PubMed] [Google Scholar]
- Tsend-Ayush E, O’Sullivan LA, Grützner FS, Onnebo SMN, Lewis RS, Delbridge ML, Marshall Graves JA, and Ward AC (2005). RBMX gene is essential for brain development in zebrafish. Developmental Dynamics 234, 682–688. [DOI] [PubMed] [Google Scholar]
- Wang Y, Li Y, Toth JI, Petroski MD, Zhang Z, and Zhao JC (2014). N6-methyladenosine modification destabilizes developmental regulators in embryonic stem cells. Nature Cell Biology 16, 191–198. [DOI] [PMC free article] [PubMed] [Google Scholar]
- Xiang Y, Laurent B, Hsu C-H, Nachtergaele S, Lu Z, Sheng W, Xu C, Chen H, Ouyang J, Wang S, et al. (2017). RNA m(6)A methylation regulates the ultraviolet-induced DNA damage response. Nature 543, 573–576. [DOI] [PMC free article] [PubMed] [Google Scholar]
- Xiao W, Adhikari S, Dahal U, Chen Y-S, Hao Y-J, Sun B-F, Sun H-Y, Li A, Ping X-L, Lai W-Y, et al. (2016). Nuclear m6A Reader YTHDC1 Regulates mRNA Splicing. Molecular Cell 61, 507–519. [DOI] [PubMed] [Google Scholar]
- Xiao Y, Hsiao T-H, Suresh U, Chen H-IH, Wu X, Wolf SE, and Chen Y (2014). A novel significance score for gene selection and ranking. Bioinformatics 30, 801–807. [DOI] [PMC free article] [PubMed] [Google Scholar]
- Yoon K-J, Ringeling FR, Vissers C, Jacob F, Pokrass M, Jimenez-Cyrus D, Su Y, Kim N-S, Zhu Y, Zheng L, et al. (2017). Temporal Control of Mammalian Cortical Neurogenesis by m6A Methylation. Cell 171, 877–889.e17. [DOI] [PMC free article] [PubMed] [Google Scholar]
- Zhang Y, Liu T, Meyer CA, Eeckhoute J, Johnson DS, Bernstein BE, Nusbaum C, Myers RM, Brown M, Li W, et al. (2008). Model-based analysis of ChIP-Seq (MACS). Genome Biol 9, R137. [DOI] [PMC free article] [PubMed] [Google Scholar]
- Zhao X, Yang Y, Sun B-F, Shi Y, Yang X, Xiao W, Hao Y-J, Ping X-L, Chen Y-S, Wang W-J, et al. (2014). FTO-dependent demethylation of N6-methyladenosine regulates mRNA splicing and is required for adipogenesis. Cell Res 24, 1403–1419. [DOI] [PMC free article] [PubMed] [Google Scholar]
- Zheng G, Dahl JA, Niu Y, Fedorcsak P, Huang C-M, Li CJ, Vågbø CB, Shi Y, Wang W-L, Song S-H, et al. (2013). ALKBH5 Is a Mammalian RNA Demethylase that Impacts RNA Metabolism and Mouse Fertility. Molecular Cell 49, 18–29. [DOI] [PMC free article] [PubMed] [Google Scholar]
Associated Data
This section collects any data citations, data availability statements, or supplementary materials included in this article.
Supplementary Materials
Data Availability Statement
The sequencing data have been deposited to the National Center for Biotechnology Information Gene Expression Omnibus database under accession number GSE114311. Mendeley data are available at http://dx.doi.org/10.17632/5hrrjww3xc.1. Additional processed data are available from the authors upon request.