

Abstract
Objective:
To assess cumulative radiation doses from computed tomography (CT), patient characteristics, and clinical indications for CT in a population-based sample.
Patients and Methods:
A cohort study using medical record linkage through the Rochester Epidemiology Project was conducted to ascertain all CT examinations in Olmsted County, Minnesota in 2004–2013 among all adults who were alive for ≥3 years after end of follow up (to exclude exposures preceding death). Ten-year cumulative effective ionizing radiation doses were estimated based on typical doses per CT modality. Among patients with high doses (≥100 mSv/10 years), CTs were reviewed for clinical setting, indications, and results.
Results:
Of 54,447 adults with a median age of 44.0 years at inclusion, 26,377 (48.4%) underwent at least one CT. Ten-year radiation doses from CT were 0.1–9.9 mSv in 15.8% of the population, 10–24.9 mSv in 16.9%, 25–99.9 mSv in 13.8%, and ≥100 mSv in 1.9%. CT of abdomen and pelvis accounted for 67% of the estimated dose. In multivariable models, doses differed 1.21-fold to 2.16-fold between extreme categories of age, body mass index, education level, smoking status, and by race. Of 600 CTs in 200 patients with high doses, 70% were obtained for restaging of solid cancers and lymphoma, abdominal pain, infection, kidney stones, follow up of nodules or masses, and chest pain/evaluation for pulmonary embolism.
Conclusions:
Exposure to ionizing radiation from CT occurred disproportionally in specific subgroups of the population. A limited number of clinical indications contributed the majority of radiation among adults with high doses.
Computed tomography (CT) has revolutionized how medical diagnoses are made. Increased use of CT over time has made it the main modifiable source of ionizing radiation exposure in medicine1, 2 and has raised concerns about radiation-induced cancers.3 Ionizing radiation contributed to cancer incidence and mortality among atomic bomb survivors.4, 5 Whether repeated low-dose exposures from medical radiation are associated with proportional risks is subject to debate. Under the most widely accepted “linear–no threshold model,” even small doses of ionizing radiation would contribute to cancer risk.3, 6–10 Guidelines recommend reducing radiation from CT.11, 12
The exposure of the U.S. population to ionizing radiation from CT is incompletely understood. Previous studies provided ecologic measures of dose in adults with specific insurance status, without being able to study individual patient factors or clinical indications.1, 2, 13, 14 Others were performed in referral populations, capturing only subsets of the population selected by their healthcare use.9, 15, 16
In this population-based study of a geographically defined part of the United States population, we estimated exposure to ionizing radiation from CT among adults, which parts of the population were most affected, and for what clinical indications CTs were obtained.
Methods
Study population and measures
The Rochester Epidemiology Project (REP) is a medical record linkage system that has been capturing virtually the entire population of Olmsted County, Minnesota since 1966.17–19 All local health care providers share information with the REP; an exception during parts of the study period was incompletely captured dental and ophthalmologic care.19 Computed tomography (CT) is performed at Mayo Clinic, Olmsted Medical Center, and affiliated hospitals. The institutional review boards of Mayo Clinic and Olmsted Medical Center approved the study.
Within the REP, a closed cohort was defined that included all adults (≥18 years) who were residents of Olmsted County both on January 1, 2004 and on December 31, 2013 who were alive, irrespective of in-county residency status, after additional three years of follow up on December 31, 2016 (Figure 1, Supplemental Figure 1). In-county residency was defined as medical contact with an Olmsted County address, with up to three (women) or four years (men) in between contacts and up to six months after the last contact, according to the validated REP Census.18, 20 Anyone who had declined use of one or more medical records for research (10.8% of the total population) was excluded.18, 21
Figure 1.
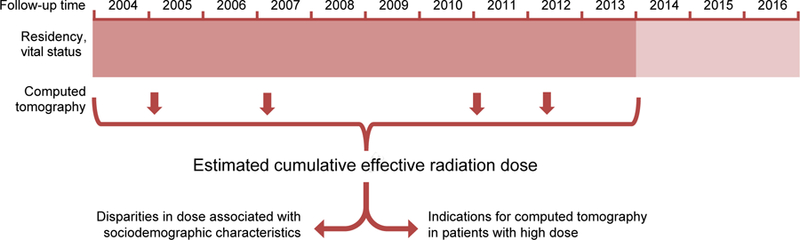
Overview of the study design. The study included residents of Olmsted County for one decade who were alive, irrespective of their residency, for an additional three years. Their cumulative effective radiation dose from computed tomography was estimated to assess for participant characteristics associated with higher doses and to assess what indications computed tomography had been obtained for among those with high doses.
Because the closed cohort might have selected a less mobile and sicker population, a sensitivity analysis used a cohort with flexible contributions of person-time, irrespective of in-county residency status on December 31, 2013. The fraction of time of in-county residency in ten years was the denominator for calculating estimated ten-year doses.
Age at inclusion, gender, race, Hispanic ethnicity, self-reported highest education level at the end of follow up, zip code, first recorded body mass index (BMI), and most frequently reported tobacco use status were retrieved from electronic health records as pre-defined predictors of radiation dose. Median household income per zip code served as a proxy for socioeconomic status.22
To calculate the radiation dose from CT, Current Procedural Terminology codes for all types of CT were retrieved from billing data. Estimated effective doses per examination per body area were based on prior literature (Supplemental Table 1).7, 9, 23–26 When different typical doses were reported, the lowest dose was used, without adjustments for gender, height, or weight. Other radiation sources such as conventional plain radiography, angiography/fluoroscopy, positron-emission tomography, or single-photon emission CT were not included, given that they contribute significantly less to radiation exposure or are performed in specialized clinical settings.2 To calculate the cumulative effective dose per person, doses per modality were multiplied with counts of CT modalities per person over the study period. Because the literature-derived typical doses might underestimate true doses in people with higher BMI, in a sensitivity analysis, doses were modeled to increase by a factor of two between BMIs of 20 and 40 kg/m2.27
Medical record review
Characterizing patients with high doses (≥100 mSv/10 years), a random subset of 200 patients with stratification by deciles of dose was sampled for medical record review. Diagnoses listed in medical histories and active problem lists in two-year time periods around inclusion (2004) and end of follow up for CT (2013) were abstracted, based on common multimorbid conditions.28
Three CTs per patient were sampled, and clinical setting, main indication, and results were abstracted from radiology reports, orders, and clinical notes. Based on a pilot review of 100 CTs, repeatedly occurring indications were defined. Radiology reports were scored for positive results (related to the main indication, or major findings necessitating timely changes in plan of care), other changes (compared to prior CTs), chronic findings, and incidental findings (unrelated to the indication, but generally requiring further follow up or for which the radiologist recommended follow up). One CT could fulfill more than one criterion.
Statistical analysis
The cumulative dose distribution was analyzed both on a relative scale and on an absolute scale. Models accounted for persons without any CT (zero inflation) and the wide spread of doses among persons with high doses (right skew). On the relative scale, two-stage modeling developed for healthcare cost estimation was employed.29 First, logistic regression was used to assess predictors of receiving any radiation dose over follow up. Second, among those with any dose, relative differences in dose were calculated. Because of the right-skewed dose distribution, a standard linear regression approach (ordinary least squares regression) would have overestimated differences in dose. Instead, the natural logarithm of the dose was modelled using robust linear regression with Huber weights,30 and standard errors were calculated using heteroskedasticity-consistent type 3 robust estimators31 to further reduce undue influence of outliers. This model choice was guided by split-sample model comparisons and regression diagnostics. In a pre-defined subgroup analysis, multiplicative effect measure modification by gender was assessed, with Pinteraction < .05 from two-sided global Wald tests considered statistically significant. For plotting unadjusted absolute doses, age and BMI were modelled using restricted cubic splines with five knots given their non-linear relationships with dose.32 Adjusted absolute differences were obtained from multivariable quantile regression for the median.33
Missing data were reported as a separate category. In the main analysis, regression models excluded persons with missing values (overall, 17.3%). In a sensitivity analysis, 20 datasets from multiple imputation by chained equations were pooled.34
Associations of calendar year and numbers of annual CTs were assessed in univariable linear regression models. Binomial proportions were reported with Wilson confidence intervals.35 Count data for settings and indications were analyzed using negative binomial regression. The association of indications and results was analyzed using mixed-effects logistic regression, accounting for clustering of three CTs per person.
Results
Study population and overall exposure to CT
54,447 adults were residents of Olmsted County for one decade from 2004 to 2013 and alive in 2016 (Supplemental Figure 1). Median age was 44.0 years at inclusion. 54.4% were women, 90.0% were white, 45.6% had a four-year college degree or higher education, 35.1% were overweight, and 35.9% were obese (Table 1).
Table 1.
Participant characteristics and categories of cumulative 10-year effective radiation dose.
| Radiation dose | ||||||||||||
|---|---|---|---|---|---|---|---|---|---|---|---|---|
| Overall | None | <10 mSv | 10–24.9 mSv | 25–99.9 mSv | ^100 mSv | |||||||
| N | (%) | N | (%) | N | (%) | N | (%) | N | (%) | N | (%) | |
| All | 54447 |
(100.0) |
28116 |
(51.6) |
8593 |
(15.8) |
9205 |
(16.9) |
7492 |
(13.8) |
1041 |
(1.9) |
| Gender | ||||||||||||
| Women | 29640 | (54.4) | 14953 | (50.4) | 4826 | (16.3) | 5155 | (17.4) | 4142 | (14.0) | 564 | (1.9) |
| Men | 24807 | (45.6) | 13163 | (53.1) | 3767 | (15.2) | 4050 | (16.3) | 3350 | (13.5) | 477 | (1.9) |
| Age | ||||||||||||
| 18–29 years | 10562 | (19.4) | 6597 | (62.5) | 1638 | (15.5) | 1359 | (12.9) | 860 | (8.1) | 108 | (1.0) |
| 30–39 years | 10830 | (19.9) | 6434 | (59.4) | 1606 | (14.8) | 1620 | (15.0) | 1061 | (9.8) | 109 | (1.0) |
| 40–49 years | 14362 | (26.4) | 7827 | (54.5) | 2223 | (15.5) | 2412 | (16.8) | 1702 | (11–9) | 198 | (1.4) |
| 50–59 years | 9808 | (18.0) | 4480 | (45.7) | 1683 | (17.2) | 1861 | (19.0) | 1562 | (15.9) | 222 | (2.3) |
| 60–69 years | 5844 | (10.7) | 2038 | (34.9) | 928 | (15.9) | 1275 | (21.8) | 1350 | (23.1) | 253 | (4.3) |
| 70–79 years | 2651 | (4.9) | 639 | (24.1) | 450 | (17.0) | 589 | (22.2) | 842 | (31.8) | 131 | (4.9) |
| 80+ years | 390 | (0.7) | 101 | (25.9) | 65 | (16.7) | 89 | (22.8) | 115 | (29.5) | 20 | (5.1) |
| Race | ||||||||||||
| (Missing) | 248 | (0.5) | 168 | (67.7) | 34 | (13.7) | 30 | (12.1) | 15 | (6.0) | 1 | (0.4) |
| Black | 1500 | (2.8) | 676 | (45.1) | 277 | (18.5) | 271 | (18.1) | 244 | (16.3) | 32 | (2.1) |
| Asian | 2026 | (3.7) | 1151 | (56.8) | 322 | (15.9) | 323 | (15.9) | 206 | (10.2) | 24 | (1.2) |
| Other/Mixed | 1691 | (3.1) | 852 | (50.4) | 304 | (18.0) | 264 | (15.6) | 237 | (14.0) | 34 | (2.0) |
| White | 48982 | (90.0) | 25269 | (51.6) | 7656 | (15.6) | 8317 | (17.0) | 6790 | (13.9) | 950 | (1.9) |
| Hispanic | ||||||||||||
| Not Hispanic | 52283 | (96.0) | 26908 | (51.5) | 8258 | (15.8) | 8875 | (17.0) | 7234 | (13.8) | 1008 | (1.9) |
| Hispanic | 2164 | (4.0) | 1208 | (55.8) | 335 | (15.5) | 330 | (15.2) | 258 | (11–9) | 33 | (1.5) |
| Education level | ||||||||||||
| (Missing) | 5482 | (10.1) | 4191 | (76.5) | 662 | (12.1) | 484 | (8.8) | 144 | (2.6) | 1 | (0.0) |
| Less than high school | 1733 | (3.2) | 664 | (38.3) | 305 | (17.6) | 322 | (18.6) | 382 | (22.0) | 60 | (3.5) |
| High school or equivalent | 9129 | (16.8) | 3877 | (42.5) | 1561 | (17.1) | 1736 | (19.0) | 1705 | (18.7) | 250 | (2.7) |
| Two-year college | 15765 | (29.0) | 7420 | (47.1) | 2596 | (16.5) | 2869 | (18.2) | 2533 | (16.1) | 347 | (2.2) |
| Four-year college | 8807 | (16.2) | 4972 | (56.5) | 1335 | (15.2) | 1414 | (16.1) | 955 | (10.8) | 131 | (1.5) |
| Postgraduate studies | 13531 | (24.9) | 6992 | (51.7) | 2134 | (15.8) | 2380 | (17.6) | 1773 | (13.1) | 252 | (1.9) |
| Socioeconomic status | ||||||||||||
| (Missing) | 1869 | (3.4) | 994 | (53.2) | 303 | (16.2) | 280 | (15.0) | 257 | (13.8) | 35 | (1.9) |
| Low | 12871 | (23.6) | 6487 | (50.4) | 2105 | (16.4) | 2180 | (16.9) | 1851 | (14.4) | 248 | (1.9) |
| Middle | 21785 | (40.0) | 11498 | (52.8) | 3357 | (15.4) | 3627 | (16.6) | 2877 | (13.2) | 426 | (2.0) |
| High | 17922 | (32.9) | 9137 | (51.0) | 2828 | (15.8) | 3118 | (17.4) | 2507 | (14.0) | 332 | (1.9) |
| Body mass index (kg/m2) | ||||||||||||
| (Missing) | 1043 | (1.9) | 796 | (76.3) | 113 | (10.8) | 84 | (8.1) | 45 | (4.3) | 5 | (0.5) |
| <18.5 | 532 | (1.0) | 253 | (47.6) | 79 | (14.8) | 86 | (16.2) | 94 | (17.7) | 20 | (3.8) |
| 18.5–24.9 | 14948 | (27.5) | 8255 | (55.2) | 2344 | (15.7) | 2359 | (15.8) | 1756 | (11.7) | 234 | (1.6) |
| 25–29.9 | 18732 | (34.4) | 9705 | (51.8) | 2977 | (15.9) | 3159 | (16.9) | 2537 | (13.5) | 354 | (1.9) |
| 30–34.9 | 11093 | (20.4) | 5404 | (48.7) | 1818 | (16.4) | 1978 | (17.8) | 1666 | (15.0) | 227 | (2.0) |
| 35–39.9 | 4789 | (8.8) | 2274 | (47.5) | 768 | (16.0) | 880 | (18.4) | 763 | (15.9) | 104 | (2.2) |
| 40+ | 3310 | (6.1) | 1429 | (43.2) | 494 | (14.9) | 659 | (19.9) | 631 | (19.1) | 97 | (2.9) |
| Tobacco use | ||||||||||||
| (Missing) | 4225 | (7.8) | 3379 | (80.0) | 449 | (10.6) | 315 | (7.5) | 82 | (1.9) | 0 | |
| Never | 28422 | (52.2) | 14982 | (52.7) | 4508 | (15.9) | 4879 | (17.2) | 3607 | (12.7) | 446 | (1.6) |
| Former | 12235 | (22.5) | 5177 | (42.3) | 1996 | (16.3) | 2370 | (19.4) | 2303 | (18.8) | 389 | (3.2) |
| Current | 9565 | (17.6) | 4578 | (47.9) | 1640 | (17.1) | 1641 | (17.2) | 1500 | (15.7) | 206 | (2.2) |
Over one decade, 107,961 CTs were performed in 26,377 patients (48.4% of the cohort). Of patients who underwent CT, 7833 (29.7%) had one CT, 11,630 (44.2%) had 2–4, 4596 (17.5%) had 5–10, and 2318 (8.8%) had ≥10 CTs.
The most frequently performed modalities were CT of the abdomen, pelvis, head, and chest (Supplemental Table 2). During follow up, the number of CTs increased by 5.8% annually (95% CI, 4.6 to 9.4%). Annual increases were 4.9% (95% CI, 3.7 to 6.1%) for abdominal CT, 4.8% (95% CI, 3.2 to 6.3%) for pelvic CT, 3.1% (95% CI, 1.5 to 4.8%) for chest CT with and without contrast medium, and 9.6% (95% CI, 7.4 to 11.7%) for other CT modalities.
Cumulative effective radiation doses from CT were 0 mSv in 51.6% of the population, 0.1–9.9 mSv in 15.8%, 10–24.9 mSv in 16.9%, 25–99.9 mSv in 13.8%, and ≥100 mSv in 1.9% (Table 1). The median dose among those with any CT was 14.0 mSv. CT of the abdomen and pelvis accounted for 67.2% of the dose, while 19.9% were due to CT of the chest with and without contrast medium. Doses increased by 6.5% per calendar year (95% CI, 5.3 to 7.8%). The increase in dose per one-year increase in baseline age was 1.58% (95% CI, 1.47 to 1.68%).
In a sensitivity analysis, a cohort defined with flexible person-time, including all 82,090 persons who were residents in 2004 irrespective of residency status after 10 years, yielded slightly higher dose estimates in a similar distribution (Supplemental Tables 3–5).
Doses in subgroups of the population
The dose differed markedly according to baseline characteristics (Table 1, Supplemental Table 6). In multivariable models, all were independent predictors of receiving any CT, except for Hispanic ethnicity (Table 2). The strongest predictor of higher dose among those with any CT was older age, followed by extremes of BMI and current tobacco use. Additionally, educational levels lower and higher than four-year college degrees and black race were associated with higher doses. Absolute dose differences according to baseline characteristics were considerably more pronounced with higher doses, such as at the 75th and 90th percentile, than at the median (Figure 2, Supplemental Figure 2).
Table 2.
Risks of receiving any radiation dose and relative cumulative 10-year effective radiation dose among those with any dose, from multivariable models.a
| Any CT | Relative dose | |||
|---|---|---|---|---|
| Characteristic | ORb | 95% CI | Ratioc | 95% CI |
| Gender | ||||
| Women | 1.00 | Reference | 1.00 | Reference |
| Men | 0.93 | 0.89–0.97 | 1.03 | 0.99–1.06 |
| Age (years) | ||||
| 18–29 | 1.00 | Reference | 1.00 | Reference |
| 30–39 | 1.17 | 1.10–1.24 | 1.17 | 1.10–1.25 |
| 40–49 | 1.36 | 1.29–1.24 | 1.27 | 1.20–1.35 |
| 50–59 | 1.90 | 1.78–2.02 | 1.44 | 1.35–1.53 |
| 60–69 | 2.82 | 2.62–3.05 | 1.89 | 1.77–2.02 |
| 70–79 | 4.75 | 4.27–5.29 | 2.16 | 2.00–2.33 |
| 80+ | 4.07 | 3.19–5.20 | 2.17 | 1.77–2.51 |
| Race | ||||
| Black | 1.53 | 1.35–1.74 | 1.21 | 1.10–1.33 |
| Asian | 0.99 | 0.89–1.10 | 0.96 | 0.87–1.05 |
| Other/Mixed | 1.29 | 1.14–1.46 | 1.03 | 0.92–1.15 |
| White | 1.00 | Reference | 1.00 | Reference |
| Hispanic ethnicity | ||||
| Not Hispanic | 1.00 | Reference | 1.00 | Reference |
| Hispanic | 0.91 | 0.82–1.01 | 0.96 | 0.87–1.07 |
| Education level | ||||
| Less than high school | 1.68 | 1.48–1.91 | 1.23 | 1.12–1.36 |
| High school | 1.34 | 1.25–1.43 | 1.11 | 1.05–1.18 |
| Two-year college | 1.30 | 1.23–1.37 | 1.12 | 1.06–1.18 |
| Four-year college | 1.00 | Reference | 1.00 | Reference |
| Postgraduate studies | 1.14 | 1.08–1.21 | 1.07 | 1.01–1.13 |
| Socioeconomic status | ||||
| Low | 1.06 | 1.01–1.12 | 0.99 | 0.95–1.03 |
| Middle | 1.00 | Reference | 1.00 | Reference |
| High | 1.03 | 0.98–1.07 | 0.96 | 0.92–0.99 |
| Body mass index (kg/m2) | ||||
| <18.5 | 1.32 | 1.09–1.61 | 1.38 | 1.16–1.63 |
| 18.5–24.9 | 1.00 | Reference | 1.00 | Reference |
| 25–29.9 | 1.07 | 1.01–1.12 | 1.01 | 0.96–1.05 |
| 30–34.9 | 1.20 | 1.14–1.27 | 1.04 | 0.99–1.10 |
| 35–39.9 | 1.30 | 1.21–1.40 | 1.12 | 1.05–1.19 |
| 40+ | 1.62 | 1.48–1.76 | 1.33 | 1.25–1.43 |
| Tobacco use | ||||
| Never | 1.00 | Reference | 1.00 | Reference |
| Former | 1.24 | 1.18–1.30 | 1.15 | 1.10–1.19 |
| Current | 1.32 | 1.25–1.40 | 1.22 | 1.16–1.28 |
Mutually adjusted for gender, age, race, Hispanic ethnicity, education level, socioeconomic status, body mass index, tobacco use (as categorized above).
Odds ratio for receiving any radiation dose from computed tomography.
Ratio between doses.
Figure 2.
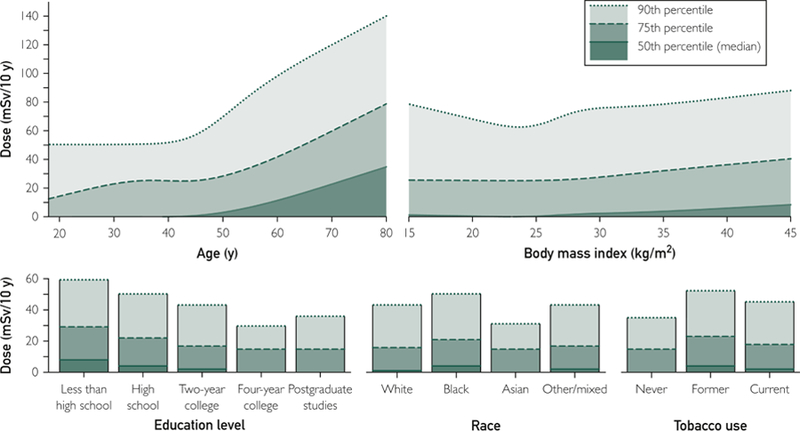
Unadjusted cumulative effective radiation doses in the entire study population according to key sociodemographic characteristics. The upper two panels show non-linear relationships of age and body mass index with dose from restricted cubic spline models; the lower panels show how education level, race, and tobacco use are associated with dose. Lines indicate the 50th percentile (or median; solid line), the 75th percentile (dashed), and the 90th percentile (dotted). For example, the 90th percentile indicates that 90% of the population have doses at or below the indicated value while 10% have doses higher than the indicated value.
Men were less likely to receive any CT (odds ratio, 0.93; 95% CI, 0.89 to 0.97), but gender was not associated with dose overall (Table 2). The associations of BMI (Pinteraction < .001), age (Pinteraction = .001), and tobacco use (Pinteraction = .002) with dose differed by gender (Supplemental Tables 7, 8, Supplemental Figure 3). Women had more pronounced higher doses with higher BMI, with those with BMI ≥ 40 kg/m2 having 1.40-fold (95% CI, 1.28 to 1.52) higher average doses than normal-weight women, while in men, doses were 1.20-fold (95% CI, 1.07 to 1.33) higher. Doses in current tobacco users were higher than in never-users among women (by 1.28-fold; 95% CI, 1.20 to 1.37); among men, the difference was only 1.15-fold (95% CI, 1.07 to 1.23). 70–79-year-old women compared to 18–29-year-olds had 2.03-fold (95% CI, 1.84 to 2.23) higher doses, compared to a difference of 2.40-fold (95% CI, 2.12 to 2.71) between these age groups among men.
In a sensitivity analysis, when doses were assumed to increase with higher BMI, the proportion of people with high absolute doses ≥100 mSv increased from 1.9% to 4.1% (Supplemental Figure 4). Nevertheless, how risk factors other than BMI were associated with dose was similar in this sensitivity analysis (Supplemental Table 9). Estimates were also similar when missing covariates were imputed (Supplemental Table 10).
Clinical indications for CT among patients with high doses
In a random sample of 200 patients with 10-year doses of at least 100 mSv (median, 141.2 mSv; interquartile range, 112.6 to 191.7 mSv), the ten most common conditions at the end of follow up were hypertension, prior history of cancer, depression, gastroesophageal reflux disease and dyspepsia, painful conditions, coronary artery disease, history of bowel resection, diabetes mellitus, anxiety disorder, and nephrolithiasis (Supplemental Table 11).
The CT was requested in primary care in 17.5% (95% CI, 14.2 to 20.9%) of the CTs, while 47.7% (95% CI, 42.2 to 53.3%) were requested by subspecialists, 27.7% (95% CI, 23.5 to 31.9%) in the emergency department, and 7.0% (95% CI, 4.9 to 9.1%) in hospital. CT modalities among patients with high doses were similar to the overall cohort (data not shown). The seven most common indications accounted for 70% of CTs (Table 3).
Table 3.
Indications for 600 CTs among 200 patients with high estimated cumulative radiation exposure (≥100 mSv/10 years).
|
Proportion of CTs |
Positive resulta |
|||||||
|---|---|---|---|---|---|---|---|---|
| n | % | (95% CI) | n | % | OR | (95% CI) | ||
| 1 | Restaging of solid cancer | 110 | 18.3% | (14.9 – 21.8%) | 20 | 18.2% | 0.34 | (0.17–0.65) |
| 2 | Abdominal pain | 103 | 17.2% | (13.8 – 20.5%) | 33 | 32.0% | 0.79 | (0.44–1.43) |
| 3 | Lymphoma restaging | 73 | 12.2% | (9.4 – 15.0%) | 11 | 15.1% | 0.24 | (0.10–0.56) |
| 4 | Infection | 42 | 7.0% | (4.9 – 9.1%) | 22 | 52.4% | 2.06 | (0.94–4.51) |
| 5 | All otherb | 36 | 6.0% | (4.0 – 8.0%) | 12 | 33.3% | Referencec | |
| 6 | Nephrolithiasis workup | 34 | 5.7% | (3.8 – 7.6%) | 17 | 50.0% | 1.59 | (0.68–3.72) |
| 7 | Nodule/mass follow up | 31 | 5.2% | (3.3 – 7.0%) | 8 | 22.6% | 0.50 | (0.18–1.39) |
| 8 | Chest pain/pulmonary embolism rule-out | 30 | 5.0% | (3.2 – 6.8%) | 2 | 6.7% | 0.10 | (0.02–0.47) |
| 9 | Initial workup for/of cancer | 23 | 3.8% | (2.3 – 5.4%) | 15 | 65.2% | Referencec | |
| 10 | Vascular restaging | 23 | 3.8% | (2.3 – 5.4%) | 9 | 39.1% | |
|
| 11 | Motor vehicle accident | 16 | 2.7% | (1.4 – 4.0%) | 5 | 31.3% | ||
| 12 | Headache | 13 | 2.2% | (1.0 – 3.3%) | 1 | 7.7% | ||
| 13 | Fall | 12 | 2.0% | (0.9 – 3.1%) | 2 | 16.7% | ||
| 14 | Trauma (other than motor vehicle accident, fall) | 12 | 2.0% | (0.9 – 3.1%) | 6 | 50.0% | ||
| 15 | Activity of inflammatory bowel disease | 10 | 1.7% | (0.6 – 2.7%) | 5 | 50.0% | ||
| 16 | Painless hematuria | 9 | 1.5% | (0.5 – 2.5%) | 5 | 55.6% | ||
| 17 | Stroke | 7 | 1.2% | (0.3 – 2.0%) | 2 | 28.6% | ||
| 18 | Altered mental status | 5 | 0.8% | (0.1 – 1.6%) | 0 | 0% | ||
| 19 | Back pain, nontraumatic | 4 | 0.7% | (0.0 – 1.3%) | 1 | 25.0% | ||
| 20 | Hemorrhage (other than hematuria, stroke) | 4 | 0.7% | (0.0 – 1.3%) | 2 | 50.0% | ||
| 21 | Pain (other than headache, chest, abdominal) | 2 | 0.3% | (0.0 – 0.8%) | 1 | 50.0% | Referencec | |
| 22 | Unclear (unable to tell from medical record) | 1 | 0.2% | (0.0 – 0.5%) | Unknown | Unknown | ||
| 600 | 100% | 178 | 29.7% | |||||
Positive results are defined as results related to the main indication, or major findings that would necessitate timely changes in plan of care. Odds ratios assess how common positive results are among specific “top” indications compared to the remainder of the indications, accounting for within-patient correlation between the three CTs per patient.
The category “all other” contains all indications not described by the 21 listed indications.
Indications with fewer than 30 CTs (ranks 9–22) and “All other” served as the reference category for comparisons of positivity.
CTs were positive for the indication or showed acute major findings in 29.7% (95% CI, 26.2 to 33.5%). Other changes compared to prior CTs were present in 24.7% (95% CI, 21.4 to 28.3%). Incidental findings were found in 10.7% (95% CI, 8.5 to 13.4%). Whether CTs had a positive result varied by indication (Table 3).
Discussion
In this study, we found a wide variation in estimated cumulative effective ionizing radiation doses from CT within a geographically defined part of the U.S. population. Doses were considerably higher in older patients, underweight and obese patients, smokers, black patients, and patients with lower educational status. Among patients receiving high doses, 70% of CTs were obtained for restaging of solid cancers and lymphomas, abdominal and chest pain, workup of infection, kidney stones, and the follow up of nodules or masses. 93% were obtained in the outpatient setting or emergency department. These results are important for setting a benchmark and developing population-level diagnostic guidelines that account for potential risks of CT while retaining their clinical benefit and for studies of CT exposure and cancer risk.
CT use was common. 13.8% of the population received 10-year-doses of 25–100 mSv and 1.9% received more than 100 mSv. These estimates could be compared to natural background radiation, which varies by geographic location, averaging at 3 mSv/year in the United States.24, 25 At least five years of lag time between radiation exposure and incident cancer are generally assumed.10 The design of our cohort allowed us to quantify radiation exposure among patients with sufficient remaining life expectancy such that potential cancer risks from ionizing radiation could be relevant.
Patients who underwent repeated CTs had specific characteristics. The identified sociodemographic characteristics should not be interpreted as direct etiologic factors. Instead, they are likely drivers of higher disease burden and healthcare utilization, while highlighting differences that need to be better understood. These differences were particularly pronounced among patients with high absolute doses (Figure 2). Most of these factors are positively associated with cancer risk, suggesting that potential risks of radiation exposure would be particularly relevant to patients with higher absolute risks of cancer incidence or mortality. These factors are also important to consider as confounders of an association of CT exposure and cancer risk.
Our data confirmed that radiation exposure from CT increases with age and as a secular trend during the study period from 2004 to 2013.1, 2, 14 In contrast to prior studies of commercially insured patients with limited person-level data,1, 14 we were unable to corroborate that women generally incur higher doses. Instead, women were more likely to ever undergo a CT. Higher doses among women who ever had a CT were largely confined to smokers and obese patients. Among men, doses increased more steeply with age than among women.
A limited number of clinical indications drove CT use. Patients who accumulated high doses generally had several comorbidities, yet the top indications (Table 3) stood for the vast majority of CTs. The restriction of our cohort to non-terminally ill patients likely partly accounts for the fact that many CTs obtained for indications such as cancer restaging had negative results. Ruling out differential diagnoses with a negative CT can be valuable, yet incidental findings were common in our study (11% of CTs among patients with high doses).36
Potential strategies to reduce radiation exposure include interventions that address the number of imaging tests ordered.37 For example, the value of scheduled surveillance CTs for diffuse large B-cell and Hodgkin lymphoma survivors is at best very limited.38, 39 Other dose-reduction strategies decrease doses per exam,40 address variations in dose between institutions,41 and substitute CT with other imaging modalities. In a randomized-controlled trial, evaluation for nephrolithiasis by ultrasound instead of CT reduced radiation exposure without apparent negative clinical consequences.42
Notable strengths of our study are a geographically defined study population without selection by insurance status, the relatively long follow up, completeness of data on clinical covariates and locally obtained CTs, and the linkage to complete medical records. The 10-year-residency requirement for the closed cohort definition might have selected sicker, less mobile patients. However, cumulative doses were actually lower than in our sensitivity analysis with flexible person-time, with little impact on risk factor associations. We can only speculate that selection bias from exclusion of the 10.8% of the population without research authorization potentially affected estimates in specific subgroups. In an older study, patients declining research authorization were more likely to be younger, women, and to have mental and infectious disorders.21
Effective ionizing radiation doses were only estimated based on average doses per CT modality without regard to body composition, scan protocol, or additional body areas imaged in the same session. Technical improvements led to reductions in absolute doses per CT over time.40 This would not alter which subgroups of the population are exposed to the highest doses (Table 2). Overall, our study likely underestimated absolute doses (Figure 2) and how these reflect the United States population. First, overweight and obese patients (70% of our study population) incur significantly higher doses per CT.27 When modeling doses to increase with higher BMI, absolute doses in the population increased, but associations with sociodemographic factors beyond BMI were unaltered. Second, CTs at the end of life were excluded. This population as well as children and adolescents would need to be studied separately. Third, CTs obtained during seasonal migration or travel were not captured. Fourth, the local health care market has little fragmentation, likely decreasing duplicative CTs at different providers. Fifth, while Mayo Clinic is also an international tertiary referral center, patients included in our study were not a referral population. Diagnostic testing intensity in the Rochester area is 17.7% lower than the national average.43 Finally, some factors associated with higher doses, such as lower educational levels and non-White/Asian race, were relatively uncommon in our population compared to national averages.
Conclusions
In this population-based cohort with long-term assessment of CT use in non-terminally ill adults, exposure to ionizing radiation from CT disproportionally occurred in specific subgroups that have a higher baseline risk of cancer. Studies of CT use and cancer incidence and mortality need to consider potential confounders described here. Estimates should be validated with direct dose measures and in populations with greater ethnic diversity and socioeconomic disparities. Our population-level results should not be used in risk-benefit considerations for single CTs in individual patients.44 As the majority of radiation dose among people with high cumulative doses stems from few clinical indications in the outpatient setting and emergency department, our results might help prudent tailoring of when CT is recommended in frequently used diagnostic algorithms.
Supplementary Material
Acknowledgments
We would like to thank Dr. Jennifer St. Sauver, Barbara Abbott, and Mircea Baias for supporting this REP-based study.
Funding: This study was made possible using the resources of the Rochester Epidemiology Project, which is supported by the National Institute on Aging of the National Institutes of Health under Award Number R01AG034676. The content is solely the responsibility of the authors and does not necessarily represent the official views of the National Institutes of Health.
Footnotes
Publisher's Disclaimer: This is a PDF file of an unedited manuscript that has been accepted for publication. As a service to our customers we are providing this early version of the manuscript. The manuscript will undergo copyediting, typesetting, and review of the resulting proof before it is published in its final citable form. Please note that during the production process errors may be discovered which could affect the content, and all legal disclaimers that apply to the journal pertain.
Conflicts of interest: The authors declare no conflict of interest.
Contributor Information
Konrad H. Stopsack, Department of Internal Medicine, Mayo Clinic, Rochester, MN; Department of Health Sciences Research, Mayo Clinic, Rochester, MN.
James R. Cerhan, Department of Health Sciences Research, Mayo Clinic, Rochester, MN.
References
- 1.Fazel R, Krumholz HM, Wang Y, et al. Exposure to low-dose ionizing radiation from medical imaging procedures. N Engl J Med 2009;361:849–857. [DOI] [PMC free article] [PubMed] [Google Scholar]
- 2.Smith-Bindman R, Miglioretti DL, Johnson E, et al. Use of diagnostic imaging studies and associated radiation exposure for patients enrolled in large integrated health care systems, 1996–2010. JAMA 2012;307:2400–2409. [DOI] [PMC free article] [PubMed] [Google Scholar]
- 3.Brenner DJ, Hall EJ. Computed tomography--an increasing source of radiation exposure. N Engl J Med 2007;357:2277–2284. [DOI] [PubMed] [Google Scholar]
- 4.Grant EJ, Brenner A, Sugiyama H, et al. Solid Cancer Incidence among the Life Span Study of Atomic Bomb Survivors: 1958–2009. Radiat Res 2017;187:513–537. [DOI] [PMC free article] [PubMed] [Google Scholar]
- 5.Ozasa K, Shimizu Y, Suyama A, et al. Studies of the mortality of atomic bomb survivors, Report 14, 1950–2003: an overview of cancer and noncancer diseases. Radiat Res 2012;177:229–243. [DOI] [PubMed] [Google Scholar]
- 6.McCollough CH, Bushberg JT, Fletcher JG, Eckel LJ. Answers to Common Questions About the Use and Safety of CT Scans. Mayo Clin Proc 2015;90:1380–1392. [DOI] [PubMed] [Google Scholar]
- 7.Lin EC. Radiation risk from medical imaging. Mayo Clin Proc 2010;85:1142–1146; quiz 1146. [DOI] [PMC free article] [PubMed] [Google Scholar]
- 8.Linet MS, Slovis TL, Miller DL, et al. Cancer risks associated with external radiation from diagnostic imaging procedures. CA Cancer J Clin 2012;62:75–100. [DOI] [PMC free article] [PubMed] [Google Scholar]
- 9.Smith-Bindman R, Lipson J, Marcus R, et al. Radiation dose associated with common computed tomography examinations and the associated lifetime attributable risk of cancer. Arch Intern Med 2009;169:2078–2086. [DOI] [PMC free article] [PubMed] [Google Scholar]
- 10.BEIR VII. Health Risks From Exposure to Low Levels of Ionizing Radiation: BEIR VII—Phase 2 In: Committee to Assess Health Risks from Exposure to Low Levels of Ionizing Radiation/National Research Council, ed. Washington, DC: 2005. [Google Scholar]
- 11.Amis ES Jr., Butler PF, Applegate KE, et al. American College of Radiology white paper on radiation dose in medicine. J Am Coll Radiol 2007;4:272–284. [DOI] [PubMed] [Google Scholar]
- 12.Fazel R, Gerber TC, Balter S, et al. Approaches to enhancing radiation safety in cardiovascular imaging: a scientific statement from the American Heart Association. Circulation 2014;130:1730–1748. [DOI] [PubMed] [Google Scholar]
- 13.Bhargavan M, Sunshine JH. Utilization of radiology services in the United States: levels and trends in modalities, regions, and populations. Radiology 2005;234:824–832. [DOI] [PubMed] [Google Scholar]
- 14.Berrington de Gonzalez A, Mahesh M, Kim KP, et al. Projected cancer risks from computed tomographic scans performed in the United States in 2007. Arch Intern Med 2009;169:2071–2077. [DOI] [PMC free article] [PubMed] [Google Scholar]
- 15.Sodickson A, Baeyens PF, Andriole KP, et al. Recurrent CT, cumulative radiation exposure, and associated radiation-induced cancer risks from CT of adults. Radiology 2009;251:175–184. [DOI] [PubMed] [Google Scholar]
- 16.Stein EG, Haramati LB, Bellin E, et al. Radiation exposure from medical imaging in patients with chronic and recurrent conditions. J Am Coll Radiol 2010;7:351–359. [DOI] [PubMed] [Google Scholar]
- 17.Sauver JL St, Grossardt BR, Yawn BP, et al. Data resource profile: the Rochester Epidemiology Project (REP) medical records-linkage system. Int J Epidemiol 2012;41:1614–1624. [DOI] [PMC free article] [PubMed] [Google Scholar]
- 18.Sauver JL St, Grossardt BR, Yawn BP, Melton LJ 3rd, Rocca WA. Use of a medical records linkage system to enumerate a dynamic population over time: the Rochester epidemiology project. Am J Epidemiol 2011;173:1059–1068. [DOI] [PMC free article] [PubMed] [Google Scholar]
- 19.Rocca WA, Yawn BP, Sauver JL St, Grossardt BR, Melton LJ 3rd. History of the Rochester Epidemiology Project: half a century of medical records linkage in a US population. Mayo Clin Proc 2012;87:1202–1213. [DOI] [PMC free article] [PubMed] [Google Scholar]
- 20.Sauver JL St, Grossardt BR, Leibson CL, Yawn BP, Melton LJ 3rd, Rocca WA. Generalizability of epidemiological findings and public health decisions: an illustration from the Rochester Epidemiology Project. Mayo Clin Proc 2012;87:151–160. [DOI] [PMC free article] [PubMed] [Google Scholar]
- 21.Jacobsen SJ, Xia Z, Campion ME, et al. Potential effect of authorization bias on medical record research. Mayo Clin Proc 1999;74:330–338. [DOI] [PubMed] [Google Scholar]
- 22.U.S. Census Bureau. American Community Survey 5-Year Estimates2011–2015.
- 23.Conference of Radiation Control Program Directors Inc., Food and Drug Administration, American College of Radiology. Tabulation and Graphical Summary of 2005–2006 Survey of Computed Tomography. Nationwide Evaluation of X-Ray Trends (NEXT) Frankfort, KY: 2015. [Google Scholar]
- 24.Mettler FA Jr., Huda W, Yoshizumi TT, Mahesh M. Effective doses in radiology and diagnostic nuclear medicine: a catalog. Radiology 2008;248:254–263. [DOI] [PubMed] [Google Scholar]
- 25.Bolus NE. NCRP report 160 and what it means for medical imaging and nuclear medicine. J Nucl Med Technol 2013;41:255–260. [DOI] [PubMed] [Google Scholar]
- 26.Nijhof WH, Baltussen EJ, Kant IM, Jager GJ, Slump CH, Rutten MJ. Low-dose CT angiography of the abdominal aorta and reduced contrast medium volume: Assessment of image quality and radiation dose. Clin Radiol 2016;71:64–73. [DOI] [PubMed] [Google Scholar]
- 27.Israel GM, Cicchiello L, Brink J, Huda W. Patient size and radiation exposure in thoracic, pelvic, and abdominal CT examinations performed with automatic exposure control. AJR Am J Roentgenol 2010;195:1342–1346. [DOI] [PubMed] [Google Scholar]
- 28.Barnett K, Mercer SW, Norbury M, Watt G, Wyke S, Guthrie B. Epidemiology of multimorbidity and implications for health care, research, and medical education: a cross-sectional study. The Lancet 2012;380:37–43. [DOI] [PubMed] [Google Scholar]
- 29.Duan N, Manning WG Jr., Morris CN, Newhouse JP. A comparison of alternative models for the demand for medical care. J Bus Econ Stat 1983;1:115–126. [Google Scholar]
- 30.Huber RJ. Robust statistics: Wiley; 1981. [Google Scholar]
- 31.Zeileis A Econometric Computing with HC and HAC Covariance Matrix Estimators. J Stat Softw 2004;11:1–17. [Google Scholar]
- 32.Greenland S. Dose-response and trend analysis in epidemiology: alternatives to categorical analysis. Epidemiology 1995;6:356–365. [DOI] [PubMed] [Google Scholar]
- 33.Koenker RW. Quantile regression: Cambridge University Press; 2005. [Google Scholar]
- 34.van Buuren S, Groothuis-Oudshoorn K. mice: Multivariate Imputation by Chained Equations in R. J Stat Softw 2011;45:1–68. [Google Scholar]
- 35.Brown LD, Cai TT, DasGupta A. Interval Estimation for a Binomial Proportion. Statistical Science 2001;16:101–117. [Google Scholar]
- 36.Smith-Bindman R Use of Advanced Imaging Tests and the Not-So-Incidental Harms of Incidental Findings. JAMA Intern Med 2018;178:227–228. [DOI] [PubMed] [Google Scholar]
- 37.Hussey PS, Timbie JW, Burgette LF, Wenger NS, Nyweide DJ, Kahn KL. Appropriateness of advanced diagnostic imaging ordering before and after implementation of clinical decision support systems. JAMA 2015;313:2181–2182. [DOI] [PubMed] [Google Scholar]
- 38.Thompson CA, Ghesquieres H, Maurer MJ, et al. Utility of routine post-therapy surveillance imaging in diffuse large B-cell lymphoma. J Clin Oncol 2014;32:3506–3512. [DOI] [PMC free article] [PubMed] [Google Scholar]
- 39.Cohen JB, Behera M, Thompson CA, Flowers CR. Evaluating surveillance imaging for diffuse large B-cell lymphoma and Hodgkin lymphoma. Blood 2017;129:561–564. [DOI] [PMC free article] [PubMed] [Google Scholar]
- 40.McCollough CH. Computed Tomography Technology-and Dose-in the 21st Century. Health Phys 2019;116:157–162. [DOI] [PubMed] [Google Scholar]
- 41.Demb J, Chu P, Nelson T, et al. Optimizing Radiation Doses for Computed Tomography Across Institutions: Dose Auditing and Best Practices. JAMA Intern Med 2017;177:810–817. [DOI] [PMC free article] [PubMed] [Google Scholar]
- 42.Smith-Bindman R, Aubin C, Bailitz J, et al. Ultrasonography versus computed tomography for suspected nephrolithiasis. N Engl J Med 2014;371:1100–1110. [DOI] [PubMed] [Google Scholar]
- 43.Finkelstein A, Gentzkow M, Hull P, Williams H. Adjusting Risk Adjustment - Accounting for Variation in Diagnostic Intensity. N Engl J Med 2017;376:608–610. [DOI] [PMC free article] [PubMed] [Google Scholar]
- 44.Durand DJ. A rational approach to the clinical use of cumulative effective dose estimates. AJR Am J Roentgenol 2011;197:160–162. [DOI] [PubMed] [Google Scholar]
Associated Data
This section collects any data citations, data availability statements, or supplementary materials included in this article.