Abstract
Apatinib, an antiangiogenic agent, shows efficient antitumor activity in a broad range of malignancies. Considering tumor is a type of metabolic disease, we investigated the metabolomics changes in serum and tumor after apatinib treatment and the molecular mechanism of characteristic changes associated with its antitumor efficacy. Molecules in serum and tumor tissue were extracted and analyzed by a gas chromatography‐mass spectrometry metabolic platform. Apatinib significantly inhibited e tumor growth and alleviated metabolic rearrangement in both serum and tumor of A549 xenograft mice. Among these endogenous metabolites, 3‐hydroxybutyric acid (3‐HB) was significantly increased in serum, tumor and liver after apatinib treatment. Interestingly, giving exogenous 3‐HB also inhibited tumor growth. Gene expression, dual luciferase reporter gene assay and molecular docking analysis all indicated that apatinib could induce 3‐HB production through the dependent activation of peroxisome proliferator‐activated receptor α (PPARα) and promotion of fatty acid utilization in the liver. Therefore, increased content of 3‐HB induced by PPARα activation in the liver partially contributed to the antitumor effect of apatinib. It may provide clues to another potential mechanism underlying the antitumor effect of apatinib besides its antiangiogenic effect through inhibiting vascular endothelial growth factor receptor 2.
Keywords: 3‐hydroxybutyric acid, apatinib, GC‐MS, metabolomics, PPARα
1. INTRODUCTION
Lung cancer is one of the leading causes of cancer death worldwide. Non‐small cell lung cancer (NSCLC) accounts for nearly 80% of lung cancer.1, 2 Angiogenesis plays a key role in the progression of tumor development and metastasis.3 Activated vascular endothelial growth factor/vascular endothelial growth factor receptor (VEGF/VEGFR) pathway has been found in most tumors including NSCLC, and most effects of VEGF are mediated by binding to VEGFR2 which results in microvascular permeability, migration, and invasion.4, 5 Apatinib, a highly selective small molecule tyrosinase inhibitor of VEGFR2, can effectively inhibit endothelial cell proliferation and migration induced by VEGF to achieve an antitumor effect.6 Moreover, a previous study showed that apatinib inhibited the PI3K‐AKT‐mTOR signaling pathway by blocking the interaction of VEGF‐VEGFR2.7 mTOR is considered a primary nutrient and energy sensor that regulates targeted downstream metabolic processes including de novo lipogenesis and glycolysis.8 However, other than functioning as an anti‐angiogenic agent, whether apatinib can modulate metabolism remains unknown.
Metabolomics is a rising ‘omics’ science studying the endogenous small molecule metabolites of cells, tissues or biofluid under different biological conditions, revealing overall pathology, disease, toxicity or efficacy of drugs. Recent evidence suggests that cancer is a type of metabolic disease.9, 10 Recent metabolomics studies in oncology found that various types of cancer or different stages of cancer development show different metabolic phenotypes such as aerobic glycolysis (the Warburg effect), one‐carbon metabolism and glutaminolysis.11, 12, 13 Several biomarkers have been identified in earlier diagnosis, distinguishing various stages of tumor occurrence and progression, as well as biomarkers for treatment response of anticancer drugs. De Petris et al14 identified different biomarkers of squamous and non‐squamous tumors using plasma metabolomics.
We investigated the metabolic regulation of apatinib on serum and tumor of A549 xenograft mice based on the gas chromatography‐mass spectrometry (GC‐MS) metabolomics platform, and speculate whether the antitumor activity of apatinib may partly be due to the regulation of metabolism in addition to its anti‐angiogenesis effect.
2. MATERIALS AND METHODS
2.1. Reagents and chemicals
Methanol was HPLC grade and obtained from Merck. Apatinib was obtained from Jiangsu Hengrui Medicine Co. Purified water was produced by a Milli‐Q system (Millipore). [1,2‐13C2] Myristic acid, methoxyamine hydrochloride (purity 98%), alkane solution (C8‐C40), and pyridine (99.8% GC) were purchased from Sigma‐Aldrich. MSTFA (N‐methyl‐N‐trimethylsilyltrifluoroacetamide) and 1% TMCS (trimethylchlorosilane) were obtained from Pierce Chemical Company.
2.2. Cell culture
Human hepatocellular carcinoma HepG2 cell line was purchased from the ATCC and cultured at 37°C in DMEM medium containing 100 U/mL penicillin, 0.1 mg/mL streptomycin and 10% FBS (Hyclone Laboratories Inc.) with 5% CO2.
2.3. Animals and treatments
Male BALB/c nude mice aged 4‐6 weeks and weighing 18‐22 g were used for s.c. xenograft models, and were obtained from Shanghai SLAC Laboratory Animal Co., Ltd. All mice were cared for in line with the Animal Facility Guidelines of the China Pharmaceutical University. All mice were kept in a specific pathogen‐free (SPF) grade room with humidity of 65% ± 5%, 12‐h light‐dark cycle, temperature of 24 ± 2°C and had free access to food and water. Dosing solution of apatinib was prepared by suspension in 0.5% carboxymethylcellulose sodium salt for intragastric treatment. Tumor‐free nude mice were considered the control group. To study the effects of apatinib on tumor growth and endogenous metabolism, mice bearing A549 tumor of approximately 100 mm3 in volume were randomly divided into two groups (n = 6 per group): (i) vehicle (CMC‐Na, every day for 14 days, p.o.); and (ii) apatinib (150 mg/kg, every day for 14 days, p.o.). To study antitumor efficacy of 3‐hydroxybutyric acid (3‐HB), mice bearing A549 tumor approximately 100 mm3 in volume were randomized into two groups (n = 5 per group): (i) vehicle (saline, every day for 13 days, i.p.); (ii) 3‐HB (500 mg/kg, every day for 13 days, i.p.). Body weights of mice and long diameter (a) and short diameter (b) of the tumor were recorded every day. Tumor volume (V) was calculated using the following equation: a/2 × b × b.
2.4. Quantitative real‐time PCR
Total RNAs of livers of mice and HepG2 cells were extracted using the RNAiso Plus reagent according to the manufacturer's protocol. Total RNA (500 ng) was reverse transcribed using SuperScript II Reverse Transcriptase to obtain complementary DNA. PCR was carried out with SYBR green PCR Master Mix following standard protocols. Quantitative real‐time PCR analysis was done on a MyiQ real‐time PCR cycler (BioRad). β‐Actin was used as the internal control. Detailed sequences of primers are shown in Appendix S1.
2.5. Sample preparation and GC‐MS analysis
Sample preparation for GC‐MS analysis was conducted as reported previously with a few modifications.15, 16 In order to precipitate the protein and extract the metabolites, 200 μL solvent (methanol) and 400 μL solvent (methanol: water = 4:1 v/v) containing [1, 2‐13C2] myristic acid (5 μg/mL) was added to 50 μL serum sample and 20 mg liver tissue, respectively. After centrifugation, the supernatant was transferred to a GC vial and dried. The sample was followed by methoxymation and trimethylsilylation reaction. Finally, heptane including methyl myristate was added, and the samples were vortexed prior to analysis. Aliquot (0.5 μL) was analyzed on an Agilent 6890 GC system with a capillary column. Detailed sample preparation and GC‐MS setup parameters are shown in Appendix S1.
2.6. Sample preparation and liquid chromatography mass spectrometry quadrupole time‐of‐flight analysis
Mice liver tissue was homogenized in ultrapure water (1:10 w/v). Liver homogenate (100 μL) was extracted by adding 500 μL methanol containing IS (13C‐gutamine). The samples were then centrifuged, dried and reconstituted prior to analysis on liquid chromatography mass spectrometry quadrupole time‐of‐flight (LCMS‐Q‐TOF). Finally, 20 μL aliquot was injected into LCMS‐Q‐TOF for analysis. HPLC separation was conducted by a Waters Amide XBridge HPLC column (4.6 × 100 mm, 3.5 μm; Waters) maintained at 30°C. The mass spectrometer was detected in negative electrospray ionization (ESI) mode by a TripleTOF system. More detailed sample preparation and LCMS‐Q‐TOF setup is shown in Appendix S1.
2.7. Determination of 3‐HB
HepG2 cells were seeded in 12‐well plates and treated with apatinib (0, 1, 3 and 9 μmol/L) for 24 hours. Concentration of 3‐HB in the serum of mice and HepG2 cells was determined using beta hydroxybutyrate assay kit (Abcam) according to the manufacturer's instructions. The prepared sample was mixed with 50 μL reaction mix and incubated at room temperature for 30 min protected from light. Absorbance was detected at a wavelength of 450 nm.
2.8. RNA interference
HepG2 cells were seeded in 12‐well plates at a density of 2.0 × 10⁵ cells/well and transfected with peroxisome proliferator‐activated receptor α (PPARα) small interference RNA (si‐PPARα) or a random sequence siRNA as a control (si‐Cont) using Lipofectamine 3000 (Invitrogen). Cells were further incubated in fresh medium for 48 hours.
2.9. Reporter gene assay
HepG2 cells were cultured in 24‐well plates in DMEM medium and allowed to reach 70%‐80% confluence. Cells were transiently transfected with PPARα luciferase reporter construct using Lipofectamine 3000 (Invitrogen). Fenofibrate, an agonist of PPARα, was used as a positive control. Then, the transfected cells were treated with apatinib (0, 1, 3 and 9 μmol/L) or fenofibrate (50 μmol/L) for another 24 hours after 24 hours of transfection. Subsequently, cells were washed with PBS three times and lysed using Cell Lysis Buffer (Beyotime). Finally, the cell lysates were collected and luciferase activities were measured according to the suppliers’ specifications.
2.10. Molecular docking
The docking model was carried out to evaluate whether apatinib could bind with PPARα based on Discovery Studio (Accelrys; Biovia). The structure of apatinib was built by molecule builder in molecular operating environment (MOE). The chemical structure of fenofibrate was obtained in terms of a reported study.17 Crystal structure of human PPARα binding ligand with BMS‐631707 was downloaded from Protein Data Bank (ID: 2REW). Receptor‐ligand affinity and reasonable binding model were carried out using Discovery Studio. Further analysis of the interaction of protein‐ligand was carried out based on the optimal conformation according to population size and binding energy.
2.11. Data processing and analysis
Relative quantitative peak areas were normalized to IS. Partial least squares discriminant analysis (PLS‐DA), orthogonal partial least squares discriminant analysis (OPLS‐DA) and shared‐and‐unique‐structures plots (SUS‐plots) were carried out by SIMCA‐P software (Umetrics). In addition, the relevant R 2 and Q 2 was used to evaluate the quality of the models.
2.12. Statistical analysis
All values are shown as mean ± SEM. Statistical analysis was analyzed by one‐way ANOVA. In addition, P < .05 was considered to be statistically significant.
3. RESULTS
3.1. Antitumor effect of apatinib in A549 xenograft mice
A significant inhibition of tumor growth was found after treatment with apatinib at a therapeutic dose of 150 mg/kg for 14 days. Mean tumor volume of the vehicle group was increased from 64.40 ± 5.32 to 322.16 ± 18.72 mm3, during the 14‐day treatment; however, the tumor volume of the apatinib group did not increase significantly and stabilized at approximately 120 mm3 (Figure 1A). Tumor volume inhibition ratio was up to 73.89 ± 2.82% in the apatinib‐treated group on the last day (Figure 1C and D). Additionally, no effect on body weight after long‐term dosing of apatinib for 14 days was observed (Figure 1B). These data confirmed a significant inhibitory effect of apatinib on tumor growth in mice bearing A549 xenografts.
Figure 1.
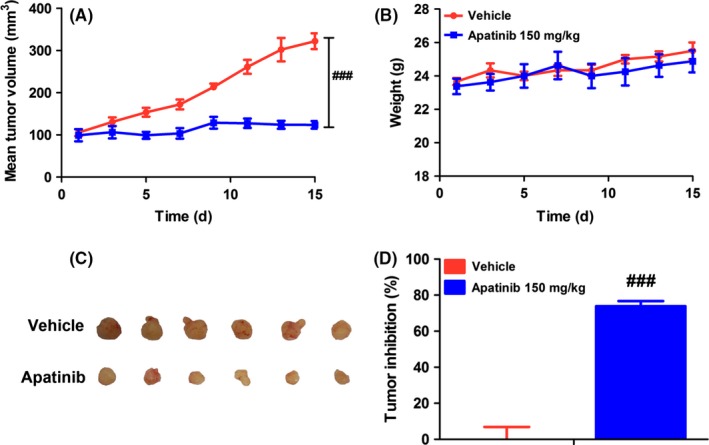
Antitumor activity of apatinib on A549 xenografts. (A) Changes of mean tumor volume with time. (B) Changes of body weight with time. (C) Tumor size. The picture was taken on day 15 after 14‐d treatment. (D) Inhibitory rate of tumor growth. The various dosages were as follows: vehicle (vehicle alone), apatinib (150 mg/kg, every day for 14 d, p.o.). ### P < .001 vs vehicle
3.2. Regulation of endogenous metabolites in serum and tumor by apatinib
As metabolic disturbance is one of the important features during tumor development, metabolic analysis of endogenous small molecules in serum and tumor was carried out by using GC/MS‐based metabolomics platform to reflect the systematic response to apatinib and to discover the specific mechanisms of action of apatinib. As shown in Figure 2A, data of serum samples were categorized into three groups: control (normal mice), vehicle (tumor‐burdened mice) and apatinib (tumor‐burdened mice with apatinib treatment) based on a PLS‐DA mathematical model. The scores plot showed that samples of different groups tended to scatter to different extents; however, samples of the same group clustered closely. There was a remarkable variation between the dots of normal nude mice and that of tumor‐burdened nude mice, whereas data points in the apatinib group moved towards the normal mice group. Impact analysis of metabolite pathway enrichment was done by using the metabolites identified to be significantly modulated by apatinib in serum. It was found that several metabolite pathways were affected by apatinib including alanine, aspartate and glutamate metabolism, histidine metabolism, citric acid cycle (TCA cycle), glutathione metabolism, pyruvate metabolism, nicotinate, and nicotinamide metabolism (Figure 2B).
Figure 2.
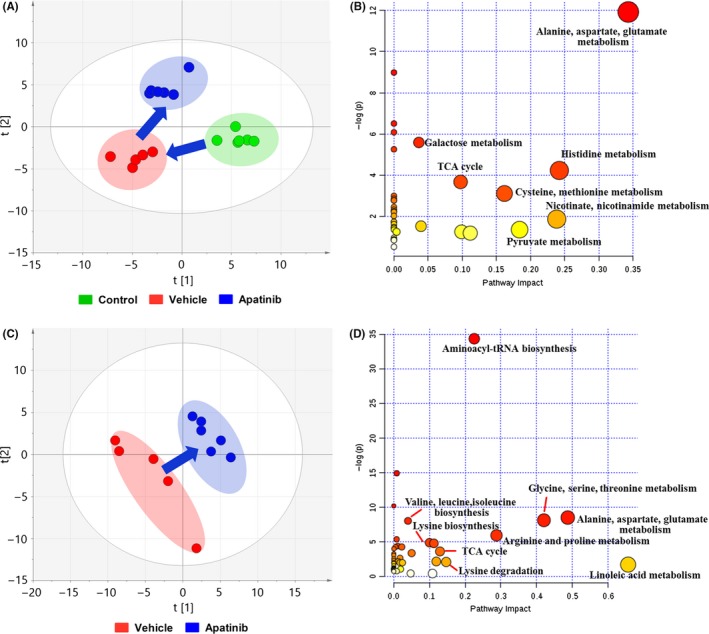
Metabolic changes of serum and tumor. (A) Partial least squares discriminant analysis (PLS‐DA) of metabolite changes in serum. (B) Impact analysis of serum metabolic sets modulated by apatinib relative to vehicle group. (C) PLS‐DA of metabolite changes in tumor. (D) Impact analysis of tumor metabolic sets modulated by giving apatinib. TCA, tricarboxylic acid
Similarly, the metabolic differences of tumor tissues were analyzed based on a PLS‐DA model. The score plot showed distinct differences between vehicle and apatinib groups (Figure 2C). Moreover, alanine, aspartate and glutamate metabolism, glycine, serine and threonine metabolism, arginine and proline metabolism, and aminoacyl‐tRNA biosynthesis were regulated by apatinib in tumor (Figure 2D).
We next focused on the significantly changed metabolites in the serum and tumor tissues. OPLS‐DA models were carried out by comparison of two groups. Subsequently, SUS‐plots were created by comparison of three groups by the p (corr) values according to the two models of OPLS‐DA.18 A positive correlation between the variables in the two models: apatinib group vs vehicle group (x‐axis) and control group vs vehicle group (y‐axis) is shown in the SUS‐plot (Figure 3A). Compared with the vehicle group, similar metabolites in both the control and apatinib groups clustered along the diagonal (red boxes). However, compared to the vehicle group, metabolites that changed only in the control group, but not in the apatinib group, are located along the y‐axis (green boxes). In addition, metabolites that changed only in the apatinib group, but not in the control group, are located along the x‐axis (blue boxes). Metabolites in the red boxes represent reversed regulation of apatinib from disrupted tumor‐bearing status to normal status. Heat map of amino acids and intermediates related to the TCA cycle is shown in Figure 3B. In addition, key molecules including five molecules in glycolysis and the TCA cycle and five molecules of amino acid in serum were chosen for phase diagram and a radar chart analysis. The phase diagram shows that apatinib markedly normalized metabolism disturbance induced by tumor (Figure 3C). S‐plot analysis showed differences between vehicle and apatinib groups (Figure 3D). The metabolites of variable importance in projection (VIP) value >1 are labeled in red in Figure 3D. Significantly changed metabolites involved in carbohydrate metabolism and amino acid metabolism are shown in Figure 3E. Changed metabolites in serum and tumor are listed in Tables S1 and S2, respectively. Among these metabolites, 3‐HB was significantly increased in the apatinib treatment group not only in the serum (2.3 times vs vehicle group) but also in the tumor (2.84 times vs vehicle group; Figure 3F).
Figure 3.
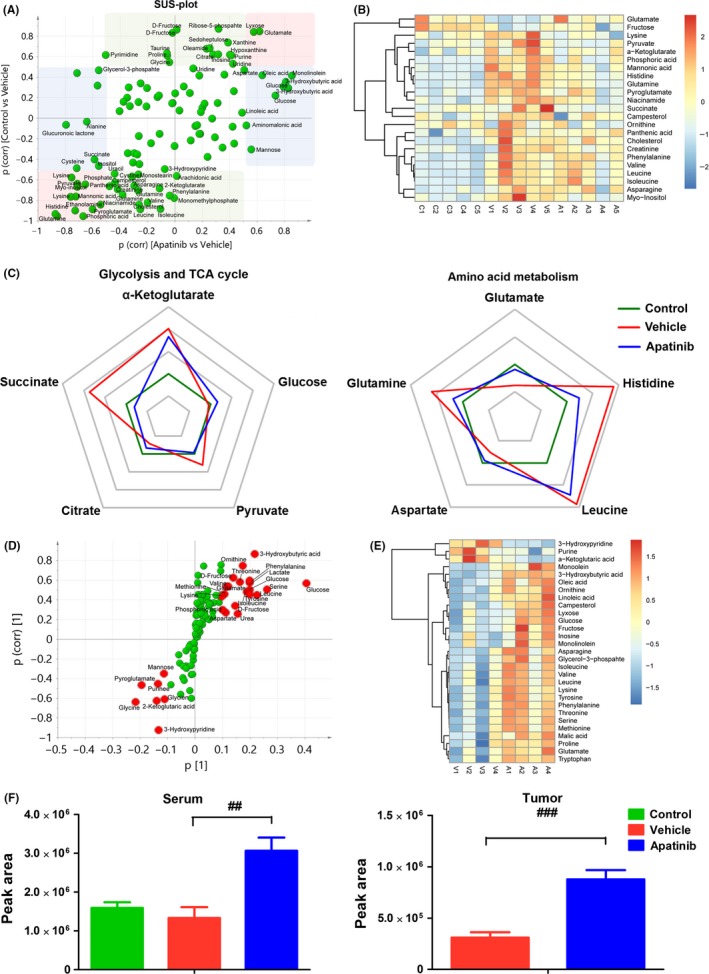
Changes in key metabolites in serum and tumor. (A) Shared‐and‐unique‐structures plot (SUS‐plot) of serum correlating orthogonal partial least squares discriminant analysis (OPLS‐DA) models of apatinib vs vehicle (x‐axis) and control vs vehicle (y‐axis). Accordingly, the variables in the lower left corners are compounds that showed the reverse effect of apatinib on A549 xenografts (red box). However, metabolites located along the axes are specifically altered in the vehicle group (green boxes) and in the apatinib group (blue boxes). (B) Heat map of serum metabolites disrupted by s.c. inoculated tumor and normalization of this change by apatinib. Red indicates upregulated metabolites whereas blue indicates downregulated metabolites. (C) Phase diagram of the 10 key metabolites in serum involved in glycolysis, the TCA cycle and amino acid metabolism. (D) S‐plot analysis of metabolites in tumor between vehicle and apatinib‐treated groups. Metabolite ions with variable importance in projection (VIP) value > 1 are marked in red. (E) Heat map of regulated metabolites in tumor after treatment with apatinib compared with vehicle group. Red indicates upregulated metabolites whereas blue indicates downregulated metabolites. (F) Peak area of 3‐hydroxybutyric acid (3‐HB) in serum and tumor based on metabolite detection by gas chromatography‐mass spectrometry. ## P < .01, ### P < .001 vs vehicle
3.3. Antitumor effect of 3‐HB in A549 xenograft mice
A previous study showed that ketone supplementation could significantly inhibit metastatic cancer in vitro and in vivo.19 Therefore, we next investigated whether giving exogenous 3‐HB could have a positive inhibitory effect on tumor progression. Tumor growth was significantly inhibited by treatment with 3‐HB (Figure 4A and C). As shown in Figure 4D, tumor inhibition ratio in the 3‐HB group was up to 43.58 ± 4.76%. Body weights of tumor‐bearing mice were not influenced by treatment of 3‐HB for 13 days (Figure 4B). Histopathological examination of tumor tissue showed that tumor necrosis was induced by 3‐HB treatment, and histopathological abnormality did not appear in heart, liver, kidney, lung and intestine tissues after long‐term dosage with 3‐HB (Figure 4E). In addition, we measured 3‐HB levels in serum at 0.25, 0.5, 1, 4 hours after i.p. dosage of 3‐HB (Figure S1A) and the concentrations of 3‐HB were similar at 1 hour after treatment with apatinib or 3‐HB compared to vehicle group (Figure S1B).
Figure 4.
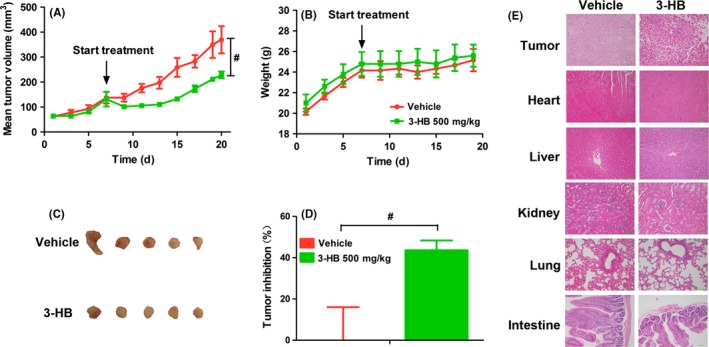
Antitumor activity of 3‐hydroxybutyric acid (3‐HB) on A549 xenografts. (A) Changes of mean tumor volume with time. (B) Changes of body weight with time. (C) Tumor size. The picture was taken on the day 13 after treatment. (D) Inhibitory rate of tumor growth. (E) Representative photographs of HE staining of tissues. Various dosages were as follows: vehicle (vehicle alone), 3‐HB (500 mg/kg, every day for 13 days, i.p.). # P < .05 vs vehicle
3.4. Increase in 3‐HB production by apatinib in liver of A549 xenograft mice
3‐Hydroxybutyrate is a primary ketone and a specific metabolite produced by fatty acid oxidation in the liver for extrahepatic use (Figure 5A).20 Therefore, we investigated change in 3‐HB concentration in the liver. Consistent with the increased trend in serum and tumor tissue, concentration of 3‐HB in liver also increased 1.59‐fold by apatinib compared with the vehicle group (Figure 5B). In addition, relative concentrations of intermediate metabolites of ketogenic reaction including acetyl‐CoA and acetoacetate (AcAc) in liver were determined by LCMS‐Q‐TOF. Concentrations of AcAc in the apatinib group increased 1.55‐fold compared to the vehicle group (Figure 5B). Concentration of acetyl‐CoA showed no significant change in either group (Figure 5B). Gene expression of hydroxymethylglutaryl‐CoA synthase 2 (HMGCS2), a rate‐limiting enzyme of ketogenesis, was significantly increased, as well as hydroxymethylglutaryl CoA lyase (HMGCL) (Figure 5C). However, there was no significant difference in gene expression of β‐hydroxybutyrate dehydrogenase 1 (BDH1) which is responsible for the production of 3‐HB from AcAc (Figure 5C). These results showed that ketogenesis was enhanced after apatinib treatment.
Figure 5.
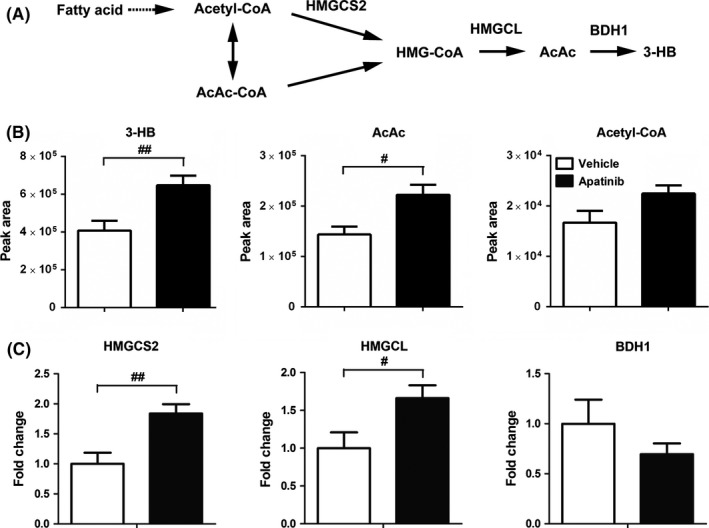
Effect of apatinib on the production of 3‐hydroxybutyric acid (3‐HB) in liver. (A) Simplified diagram of ketone production in liver. AcAc, acetoacetate; AcAc‐CoA, acetoacetyl‐CoA; BDH1, β‐hydroxybutyrate dehydrogenase; HMGCL, hydroxymethylglutaryl CoA lyase; HMG‐CoA, hydroxymethylglutaryl CoA; HMGCS2, hydroxymethylglutaryl CoA synthetase. (B) Peak area of ketone bodies (3‐HB and AcAc) and acetyl‐CoA in liver tissue. (C) Gene expression of key enzymes of ketogenesis in liver. Various dosages were as follows: vehicle (vehicle alone), apatinib (150 mg/kg, every day for 14 d, p.o.). # P < .05, ## P < .01 vs vehicle
3.5. Regulation of apatinib on fatty acid metabolism in liver
Ketogenesis is the specific metabolic process in fatty acid oxidation in liver and a simplified diagram of fatty acid synthesis and fatty acid transport is shown in Figure 6A.21 We assessed the relative abundance of long chain fatty acids (palmitic acid, oleic acid, linoleic acid, and stearic acid) and lipids (monopalmitin, monoolein, monolinolein, and monostearin) in serum and liver by GC‐MS. Peak area ratios of most fatty acids and lipids in liver/serum including palmitic acid, oleic acid, linoleic acid, monoolein, monolinolein and monostearin significantly decreased after giving apatinib; in particular, monolinolein decreased by 58% (Figure 6B). These results suggest that apatinib enhanced the utilization of fatty acids, which was consistent with the elevated content of 3‐HB. mRNA levels of several genes in fatty acid metabolism were investigated by RT‐PCR analysis. Gene expression of fatty acid transport protein 4 (FATP 4), a key enzyme that transports fatty acids into liver cells, was upregulated after treatment with apatinib (Figure 6C). Also, gene expression of long‐chain Acyl‐CoA synthetase (ACSL),22 which is responsible for the acylation of fatty acids, was enhanced (Figure 6C). In addition, gene expression of carnitine palmitoyltransferase 1a (CPT1a) was slightly increased, which might further contribute to the utilization of fatty acids. On the contrary, the mRNA levels of ATP citrate lyase (ACLY) and acetyl CoA carboxylase alpha (ACCα) were both downregulated by apatinib treatment (Figure 6D). Similar to the reduced expression of ACLY and ACCα, mRNA level of fatty acid synthase (FASN), a key enzyme that condenses malonyl coenzyme A and acetyl‐CoA to a long‐chain fatty acid, was also decreased (Figure 6D). Taken together, treatment with apatinib promoted utilization of fatty acids but inhibited the process of fatty acid synthesis in the liver.
Figure 6.
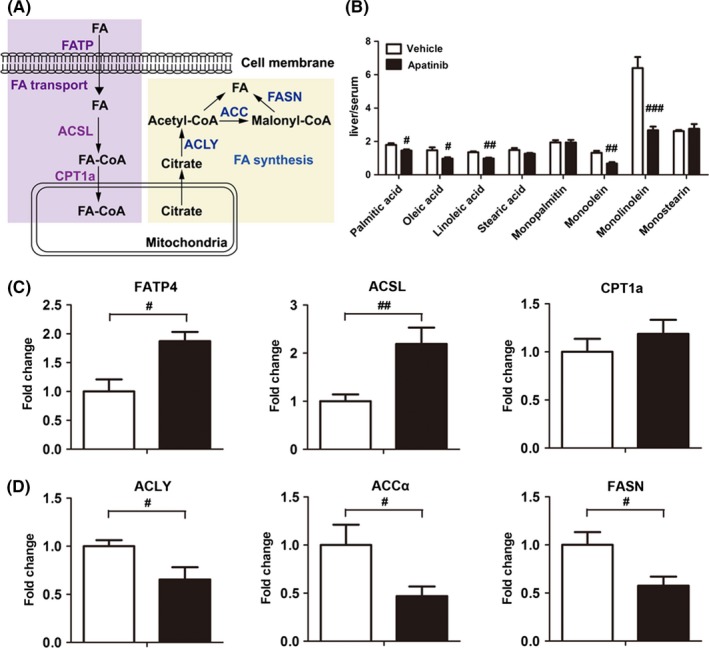
Effect of apatinib on fatty acid transport and fatty acid synthesis in liver. (A) Schematic representation of fatty acid transport and fatty acid synthesis in liver. ACCα, acetyl CoA carboxylase alpha; ACLY, ATP citrate lyase; ACSL, long chain acyl‐CoA synthase; CPT1a, carnitine palmitoyltransferase 1a; FA, fatty acid; FASN, fatty acid synthase; FATP4, fatty acid transport protein 4. (B) Peak area ratio of fatty acids and lipids in liver/serum. Gene expression of enzymes related to fatty acid transport (C) and fatty acid synthesis (D) in liver. # P < .05, ## P < .01, ### P < .001 vs vehicle
3.6. Regulation of apatinib in fatty acid metabolism and ketogenesis is mediated by PPARα activation
As HMGSC2 transcription is heavily regulated by PPARα, and PPARα is the main nuclear receptor regulating the expression of enzymes involved in fatty acid metabolism,23 we speculated that the regulation of metabolism by apatinib resulted from PPARα activation. Previous studies showed that acyl‐CoA oxidase 1 (ACOX1), pyruvate dehydrogenase kinase 4 (PDK4) and uncoupling proteins (including UCP1, UCP2 and UCP3) were downstream target genes of PPARα involved in lipid metabolism.24, 25 We observed significantly upregulated expression of ACOX1, PDK4 and UCP2 in the liver after apatinib treatment (Figure 7A). In addition, apatinib could upregulate gene expression of ACOX1, PDK4 and UCP3 in HepG2 cells, but had no significant effect on the expression of UCP2 (Figure 7B). Furthermore, we carried out a reporter gene assay in HepG2 cells. The results indicated that apatinib treatment induced a significant increase in PPAR‐α‐regulated luciferase activity. Moreover, our data showed that the activation of PPARα induced by apatinib was similar to fenofibrate, a typical PPARα agonist (Figure 7C).26 To further validate the interaction of apatinib with human PPARα, we carried out a molecular docking analysis. Similar to fenofibrate, apatinib could adapt to the ligand binding pocket of human PPARα (Figure 7D). Repeated dockings were carried out to refine the binding energy of the conformer. Additionally, computational docking results indicated that apatinib and fenofibrate bound to the cavity of PPARα by the hydrogen bonds at PHE273 and TYR464, respectively (Figure 7D). LibDockScores of apatinib and fenofibrate were 130.02 and 110.81, respectively, which indicated that apatinib has better binding affinity compared with fenofibrate. We also silenced PPARα to validate whether the production of 3‐HB by apatinib is PPARα‐dependent. Quantitative analysis showed that there was a significant knockdown effect of PPARα between Cont and si‐PPARα groups at the protein level. Silencing efficiency of si‐PPARα was 70.78 ± 4.78% of the si‐Cont group (Figure 7E). Concentration of 3‐HB in HepG2 cells was significantly increased after apatinib treatment, but the level of 3‐HB was not affected by apatinib when PPARα was silenced (Figure 7F). Moreover, mRNA expression of genes related to the 3‐HB production pathway was unaffected by apatinib when PPARα was silenced (Figure 7G). These results indicated that the increased level of 3‐HB in liver by apatinib was mediated by PPARα‐dependent activation.
Figure 7.
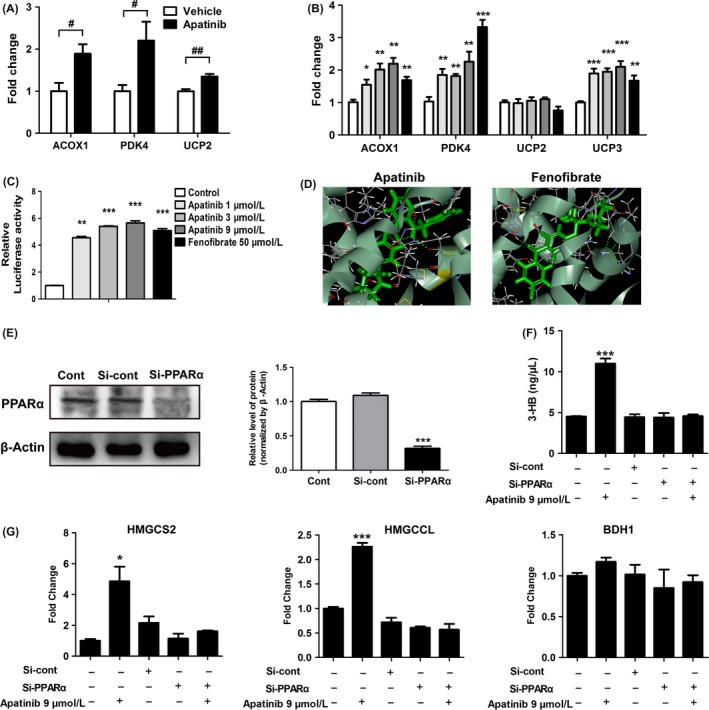
Activation of apatinib on peroxisome proliferator‐activated receptor α (PPARα). (A) Downstream target gene expression of PPARα in liver. ACOX1, acyl‐CoA oxidase 1; PDK4, pyruvate dehydrogenase kinase 4; UCP2, uncoupling protein 2. (B) Downstream target gene expression of PPARα in HepG2 cells treated by apatinib (1, 3 and 9 μmol/L), or fenofibrate (50 μmol/L, positive control) for 24 h. (C) Luciferase activities of PPARα in HepG2 cells treated with apatinib or fenofibrate. HepG2 cells were treated with DMSO (0.1%), apatinib (1, 3 and 9 μmol/L), or fenofibrate (50 μmol/L, positive control) for 24 h. (D) Computational molecular docking of apatinib and fenofibrate to the ligand‐binding domain of human PPARα. Amino acid residues predicted to interact with the ligands are shown in yellow. (E) Levels of PPARα protein in HepG2 cells transfected with si‐Cont or si‐PPARα for 48 h. (F) Concentrations of 3‐HB in HepG2 cells treated with apatinib (9 μmol/L, 24 h) after transfection with si‐Cont or si‐PPARα for 48 h. (G) Gene expression of key enzymes of ketogenesis in HepG2 cells treated with apatinib (9 μmol/L, 24 h) after transfection with si‐Cont or si‐PPARα for 48 h. *P < .05, **P < .01, ***P < .001 vs control. # P < .05, ## P < .01 vs vehicle
4. DISCUSSION
In the present study, we investigated the metabolic regulation of apatinib on serum and tumor tissues of A549 xenograft mice by GC‐MS analysis. 3‐HB was found to be significantly increased after apatinib treatment. It was further confirmed that apatinib promoted the utilization of fatty acids, the production of 3‐HB and inhibited fatty acid synthesis through activation of PPARα. Moreover, giving exogenous 3‐HB could effectively inhibit tumor growth which suggested that the increased level of 3‐HB partially contributes to the antitumor efficacy of apatinib.
In line with previous studies, our results showed significant inhibition of apatinib on tumor growth.6, 27 To the best of our knowledge, this is the first study to evaluate the metabolic modulation of apatinib based on metabolomics data from A549 xenograft nude mice. Serum metabolic profiles indicated a significant metabolic difference in A549 xenograft nude mice compared to control nude mice. The increased concentrations of amino acids including leucine, isoleucine, lysine, and ornithine in the serum of tumor‐bearing mice were in accordance with previous studies which showed the concentrations of lysine, isoleucine, serine, proline, alanine and tyrosine were higher in NSCLC and gastrointestinal cancers.28, 29 Giving apatinib effectively modulated the abnormal serum metabolic pattern of A549 xenograft nude mice toward the normal metabolic status of control nude mice. Our study also showed that the concentrations of endogenous metabolites involved in the glycolysis pathway and in the amino acid metabolic pathway were significantly increased in tumor tissues of the apatinib treatment group compared with the vehicle group, which indicated inhibited glycometabolism and decreased cell proliferation in tumor tissues. Activation of the VEGFR signal pathway can upregulate glycolytic activator PFKFB3 and glucose transporter 1 to enhance glycolysis by activation of PI3K‐AKT‐mTOR signaling in endothelial cells.30, 31 In contrast, suppressing VEGFR2 by certain drugs could inhibit angiogenesis, tumor growth, and metastasis through the MAPK and PI3K/Akt/mTOR signaling pathways.32, 33 Therefore, we inferred that apatinib, as a selective inhibitor of VEGFR2, might inhibit the glycolysis pathway and amino acid metabolism by VEGFR2 suppression through MAPK and PI3K/Akt/mTOR signaling. In accordance with this, a previous study showed that apatinib could inhibit the PI3K‐AKT‐mTOR signaling pathway by blocking the interaction of VEGF‐VEGFR2.7
The prominent increase in levels of 3‐HB in serum, tumor and liver in the apatinib group attracted our attention. In addition, our results confirmed that exogenous 3‐HB effectively delayed tumor growth in A549 xenograft mice which was in agreement with previous studies. For example, a ketogenic diet or ketone supplementation has shown positive antiproliferative and pro‐apoptotic effects in various cancers, such as brain cancer, breast, gastric and colon cancers.34, 35, 36, 37 Histone deacetylases (HDAC) can modify chromatin structure and regulate gene expression involved in tumorigenesis and progression. In many studies, several HDAC inhibitors have been shown to have antitumor activities.38, 39 Moreover, 3‐HB has been found to be a class I HDAC inhibitor which suggests its anticancer effect may partly be due to the inhibitory activity of HADC.40
Ketone bodies, namely acetoacetate, acetone and 3‐HB, are produced in the liver in the process of fatty acid oxidation. HMGCS2 is the rate‐limiting enzyme in the pathway of 3‐HB production in the liver.20, 41 Therefore, the increased expression of HMGCS2 may be responsible for the increased intermediate product AcAc and the subsequent production of 3‐HB. BDH1 is responsible for the conversion of AcAc to 3‐HB. Our data showed that apatinib exerted little effect on BDH1 gene expression in liver tissues of mice bearing A549 tumor or in HepG2 liver cells. As there was a significant increase in AcAc production, this could explain the increased production of 3‐HB even if BDH1 was not upregulated. Moreover, our data showed that upregulated expression of key enzymes involved in lipid metabolism and the decreased ratio of lipids and fatty acids between serum and liver indicated increased utilization of fatty acids and inhibition of fatty acid synthesis in the liver induced by apatinib. PPAR belongs to the nuclear hormone receptor superfamily and are ligand‐dependent transcription factors. In general, PPARα is highly expressed in tissues with abundant mitochondria and higher β oxidative activity, such as liver, kidney, cortex, and heart.42 Activation of PPARα can regulate transcription of numerous genes, including genes involved in fatty acid oxidation and ketone production in mitochondria.43 Fasting induces a switch to fatty acid and ketone use for energy supply in which PPARα plays a pivotal role in the adaptive metabolic response.44, 45 In addition, the upregulated expression of HMGCS2 in liver was found in PPARα wild‐type mice with accompanying hyperketonemia, whereas the effect disappeared in PPARα null mice.46 We checked whether apatinib could regulate the function of PPARα in order to provide further mechanistic understanding. Surprisingly, apatinib treatment induced the activation of PPARα and the production of 3‐HB both in vivo and in vitro. Moreover, we silenced PPARα and found that the ketogenic effect induced by apatinib is PPARα‐dependent. It was shown that apatinib could regulate hepatic fatty acid metabolism and the production of 3‐HB from the perspective of endogenous metabolism, which revealed a new mechanism of the antitumor effect of apatinib besides its anti‐angiogenic effect. Whether any other small molecules identified as tyrosinase inhibitors and with a similar structure to apatinib might have similar activation of PPARα and ketone body production is worthy of further exploration.
The present study, for the first time, showed that apatinib could regulate fatty acid metabolism and 3‐HB production by activation of PPARα in the liver of A549 xenograft mice. Moreover, giving exogenous 3‐HB could significantly inhibit tumor growth. These results indicate that the antitumorigenic properties of apatinib might be mediated in part by an anti‐angiogenic effect through inhibition of VEGFR2 and partly through regulation of both the liver fatty acid metabolism pathway and 3‐HB production (Figure 8).
Figure 8.
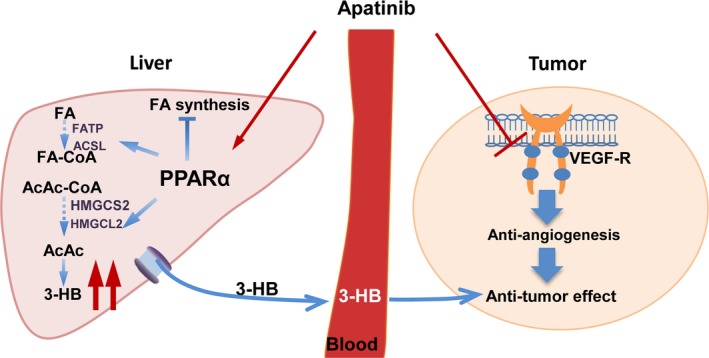
Schematic overview of apatinib action in A549 xenograft mice. In brief, beyond its anti‐angiogenic effects, apatinib can directly activate peroxisome proliferator‐activated receptor α (PPARα) in liver and subsequently affect fatty acid metabolism of liver with increased 3‐hydroxybutyrate (3‐HB) production which may partly contribute to its antitumor effect. AcAc, acetoacetate; AcAc‐CoA, acetoacetyl‐CoA; ACSL, long chain acyl‐CoA synthase; FA, fatty acid; FA‐CoA, fatty acid coenzyme A; FATP, fatty acid transport protein; HMGCL, hydroxymethylglutaryl CoA lyase; HMGCS2, hydroxymethylglutaryl CoA synthetase; VEGF‐R, vascular endothelial growth factor receptor
CONFLICTS OF INTEREST
Authors declare no conflicts of interest for this article.
Supporting information
ACKNOWLEDGMENTS
The work was supported by China National Nature Science Foundation (Nos 81573496, 81773989, 81530098, 81573494); the Major State Basic Research Development Program of China (973 Program, No. 2017YFA0205400); Jiangsu Province Nature Science Foundation (BK20160076); “Double First‐Class” University project (CPU2018GF01); the Foundation for Innovative Research Groups of the National Natural Science Foundation of China (No. 81421005).
Feng S, Wang H, Wang Y, et al. Apatinib induces 3‐hydroxybutyric acid production in the liver of mice by peroxisome proliferator‐activated receptor α activation to aid its antitumor effect. Cancer Sci. 2019;110:3328–3339. 10.1111/cas.14168
Siqi Feng and Huan Wang contributed equally to this work.
Contributor Information
Jiye Aa, Email: jiyea@cpu.edu.cn.
Fang Zhou, Email: zf1113@163.com.
REFERENCES
- 1. Perez‐Moreno P, Brambilla E, Thomas R, Soria JC. Squamous cell carcinoma of the lung: molecular subtypes and therapeutic opportunities. Clin Cancer Res. 2012;18:2443‐2451. [DOI] [PubMed] [Google Scholar]
- 2. Jiang W, Cai G, Hu PC, Wang Y. Personalized medicine in non‐small cell lung cancer: a review from a pharmacogenomics perspective. Acta Pharmaceutica Sinica B. 2018;8:530‐538. [DOI] [PMC free article] [PubMed] [Google Scholar]
- 3. Abe R. Angiogenesis in tumor growth and metastasis. Curr Pharm Des. 2008;14:3779. [DOI] [PubMed] [Google Scholar]
- 4. Eswarappa SM, Fox PL. Antiangiogenic VEGF‐Ax: A new participant in tumor angiogenesis. Cancer Res. 2015;75:2765‐2769. [DOI] [PMC free article] [PubMed] [Google Scholar]
- 5. Jr Roskowski R. Vascular endothelial growth factor (VEGF) and VEGF receptor inhibitors in the treatment of renal cell carcinomas. Pharmacol Res. 2017;120:116‐132. [DOI] [PubMed] [Google Scholar]
- 6. Tian S, Quan H, Xie C, et al. YN968D1 is a novel and selective inhibitor of vascular endothelial growth factor receptor‐2 tyrosine kinase with potent activity in vitro and in vivo. Cancer Sci. 2011;102:1374‐1380. [DOI] [PMC free article] [PubMed] [Google Scholar]
- 7. Peng H, Zhang Q, Li J, et al. Apatinib inhibits VEGF signaling and promotes apoptosis in intrahepatic cholangiocarcinoma. Oncotarget. 2016;7:17220‐17229. [DOI] [PMC free article] [PubMed] [Google Scholar]
- 8. Laplante M, Sabatini DM. mTOR signaling in growth control and disease. Cell. 2012;149:274‐293. [DOI] [PMC free article] [PubMed] [Google Scholar]
- 9. Seyfried TN, Flores RE, Poff AM, D'Agostino DP. Cancer as a metabolic disease: implications for novel therapeutics. Carcinogenesis. 2014;35:515‐527. [DOI] [PMC free article] [PubMed] [Google Scholar]
- 10. Beyoglu D, Idle JR. Metabolomics and its potential in drug development. Biochem Pharmacol. 2013;85:12‐20. [DOI] [PubMed] [Google Scholar]
- 11. Hipp SJ, Steffen‐Smith EA, Patronas N, et al. Molecular imaging of pediatric brain tumors: comparison of tumor metabolism using F‐18‐FDG‐PET and MRSI. J Neuro‐Oncol. 2012;109:521‐527. [DOI] [PMC free article] [PubMed] [Google Scholar]
- 12. Sutinen E, Nurmi M, Roivainen A, et al. Kinetics of [(11)C]choline uptake in prostate cancer: a PET study. Eur J Nucl Med Mol Imaging. 2004;31:317‐324. [DOI] [PubMed] [Google Scholar]
- 13. Zhan H, Ciano K, Dong K, Zucker S. Targeting glutamine metabolism in myeloproliferative neoplasms. Blood Cells Mol Dis. 2015;55:241‐247. [DOI] [PMC free article] [PubMed] [Google Scholar]
- 14. De Petris L, Forshed J, Antti H, et al. Plasma metabolomics in non‐small‐cell lung cancer. Eur J Cancer. 2011;47:S124‐S124. [Google Scholar]
- 15. Jiye A, Huang Q, Wang G, et al. Global analysis of metabolites in rat and human urine based on gas chromatography/time‐of‐flight mass spectrometry. Anal Biochem. 2008;379:20‐26. [DOI] [PubMed] [Google Scholar]
- 16. Aa J, Shao F, Wang G, et al. Gas chromatography time‐of‐flight mass spectrometry based metabolomic approach to evaluating toxicity of triptolide. Metabolomics. 2011;7:217‐225. [Google Scholar]
- 17. Gregus Z, Fekete T, Halaszi E, Gyurasics A, Klaassen CD. Effects of fibrates on the glycine conjugation of benzoic acid in rats. Drug Metab Disposition: The Biological Fate of Chemicals. 1998;26:1082‐1088. [PubMed] [Google Scholar]
- 18. Wiklund S, Johansson E, Sjostrom L, et al. Visualization of GC/TOF‐MS‐based metabolomics data for identification of biochemically interesting compounds using OPLS class models. Anal Chem. 2008;80:115‐122. [DOI] [PubMed] [Google Scholar]
- 19. Poff AM, Ari C, Arnold P, et al. Ketone supplementation decreases tumor cell viability and prolongs survival of mice with metastatic cancer. Int J Cancer. 2014;135:1711‐1720. [DOI] [PMC free article] [PubMed] [Google Scholar]
- 20. Newman JC, Verdin E. Ketone bodies as signaling metabolites. Trends Endocrin Met. 2014;25:42‐52. [DOI] [PMC free article] [PubMed] [Google Scholar]
- 21. Puchalska P, Crawford PA. Multi‐dimensional roles of ketone bodies in fuel metabolism, signaling, and therapeutics. Cell Metab. 2017;25:262‐284. [DOI] [PMC free article] [PubMed] [Google Scholar]
- 22. Smith BK, Jain SS, Rimbaud S, et al. FAT/CD36 is located on the outer mitochondrial membrane, upstream of long‐chain acyl‐CoA synthetase, and regulates palmitate oxidation. Biochem J. 2011;437:125‐134. [DOI] [PubMed] [Google Scholar]
- 23. Burri L, Thoresen GH, Berge RK. The role of PPARalpha activation in liver and muscle. PPAR Research. 2010;2010:542359. [DOI] [PMC free article] [PubMed] [Google Scholar]
- 24. Yoon M. The role of PPARalpha in lipid metabolism and obesity: focusing on the effects of estrogen on PPARalpha actions. Pharmacol Res. 2009;60:151‐159. [DOI] [PubMed] [Google Scholar]
- 25. Rogue A, Anthérieu S, Vluggens A, et al. PPAR agonists reduce steatosis in oleic acid‐overloaded HepaRG cells. Toxicol Appl Pharmacol. 2014;276:73‐81. [DOI] [PubMed] [Google Scholar]
- 26. Ji YY, Liu JT, Liu N, Wang ZD, Liu CH. PPARalpha activator fenofibrate modulates angiotensin II‐induced inflammatory responses in vascular smooth muscle cells via the TLR4‐dependent signaling pathway. Biochem Pharmacol. 2009;78:1186‐1197. [DOI] [PubMed] [Google Scholar]
- 27. Li J, Zhao XM, Chen L, et al. Safety and pharmacokinetics of novel selective vascular endothelial growth factor receptor‐2 inhibitor YN968D1 in patients with advanced malignancies. BMC Cancer. 2010;10:529-536. [DOI] [PMC free article] [PubMed] [Google Scholar]
- 28. Ikeda A, Nishiumi S, Shinohara M, et al. Serum metabolomics as a novel diagnostic approach for gastrointestinal cancer. Biomed Chromatogr. 2012;26:548‐558. [DOI] [PubMed] [Google Scholar]
- 29. Maeda J, Higashiyama M, Imaizumi A, et al. Possibility of multivariate function composed of plasma amino acid profiles as a novel screening index for non‐small cell lung cancer: a case control study. BMC Cancer. 2010;10:690-697. [DOI] [PMC free article] [PubMed] [Google Scholar]
- 30. Schoors S, De Bock K, Cantelmo AR, et al. Partial and transient reduction of glycolysis by PFKFB3 blockade reduces pathological angiogenesis. Cell Metab. 2014;19:37‐48. [DOI] [PubMed] [Google Scholar]
- 31. Yeh WL, Lin CJ, Fu WM. Enhancement of glucose transporter expression of brain endothelial cells by vascular endothelial growth factor derived from glioma exposed to hypoxia. Mol Pharmacol. 2008;73:170‐177. [DOI] [PubMed] [Google Scholar]
- 32. Kim GD. Kaempferol inhibits angiogenesis by suppressing HIF‐1α and VEGFR2 activation via ERK/p38 MAPK and PI3K/Akt/mTOR signaling pathways in endothelial cells. Prev Nutr Food Sci. 2017;22:320‐326. [DOI] [PMC free article] [PubMed] [Google Scholar]
- 33. Sadremomtaz A, Mansouri K, Alemzadeh G, Safa M, Rastaghi AE, Asghari SM. Dual blockade of VEGFR1 and VEGFR2 by a novel peptide abrogates VEGF‐driven angiogenesis, tumor growth, and metastasis through PI3K/AKT and MAPK/ERK1/2 pathway. Biochimica et Biophysica Acta (BBA) ‐ General Subject. 2018;1862:2688‐2700. [DOI] [PubMed] [Google Scholar]
- 34. Lin BQ, Zeng ZY, Yang SS, Zhuang CW. Dietary restriction suppresses tumor growth, reduces angiogenesis, and improves tumor microenvironment in human non‐small‐cell lung cancer xenografts. Lung Cancer. 2013;79:111‐117. [DOI] [PubMed] [Google Scholar]
- 35. Sivananthan AP. Effects of a ketogenic diet on tumor progression in breast cancer. Dissertations & Theses ‐ Gradworks; 2013.
- 36. Hans V, Rainer W, Nadja P, et al. Growth of human gastric cancer cells in nude mice is delayed by a ketogenic diet supplemented with omega‐3 fatty acids and medium‐chain triglycerides. BMC Cancer. 2008;8:1‐12. [DOI] [PMC free article] [PubMed] [Google Scholar]
- 37. Hao GW, Chen YS, He DM, Wang HY, Wu GH, Zhang B. Growth of human colon cancer cells in nude mice is delayed by ketogenic diet with or without omega‐3 fatty acids and medium‐chain triglycerides. Asian Pac J Cancer Prev. 2015;16:2061. [DOI] [PubMed] [Google Scholar]
- 38. Bolden JE, Peart MJ, Johnstone RW. Anticancer activities of histone deacetylase inhibitors. Nat Rev Drug Discov. 2006;5:769‐784. [DOI] [PubMed] [Google Scholar]
- 39. West AC, Johnstone RW. New and emerging HDAC inhibitors for cancer treatment. J Clin Invest. 2014;124:30‐39. [DOI] [PMC free article] [PubMed] [Google Scholar]
- 40. Shimazu T, Hirschey MD, Newman J, et al. Suppression of oxidative stress by beta‐hydroxybutyrate, an endogenous histone deacetylase inhibitor. Science. 2013;339:211‐214. [DOI] [PMC free article] [PubMed] [Google Scholar]
- 41. Kostiuk MA, Keller BO, Berthiaume LG. Palmitoylation of ketogenic enzyme HMGCS2 enhances its interaction with PPAR alpha and transcription at the Hmgcs2 PPRE. FASEB J. 2010;24:1914‐1924. [DOI] [PMC free article] [PubMed] [Google Scholar]
- 42. Grabacka M, Pierzchalska M, Dean M, Reiss K. Regulation of Ketone Body Metabolism and the Role of PPARalpha. Int J Mol Sci. 2016;17:2093-2116. [DOI] [PMC free article] [PubMed] [Google Scholar]
- 43. Rakhshandehroo M, Knoch B, Muller M, et al. Peroxisome proliferator‐activated receptor alpha target genes. PPAR Research. 2010;2010:612089. [DOI] [PMC free article] [PubMed] [Google Scholar]
- 44. Leone TC, Weinheimer CJ, Kelly DP. A critical role for the peroxisome proliferator‐activated receptor alpha (PPARalpha) in the cellular fasting response: the PPARalpha‐null mouse as a model of fatty acid oxidation disorders. Proc Natl Acad Sci USA. 1999;96:7473‐7478. [DOI] [PMC free article] [PubMed] [Google Scholar]
- 45. Galman C, Lundasen T, Kharitonenkov A, et al. The circulating metabolic regulator FGF21 is induced by prolonged fasting and PPAR alpha activation in man. Cell Metab. 2008;8:169‐174. [DOI] [PubMed] [Google Scholar]
- 46. Le May C, Pineau T, Bigot K, Kohl C, Girard J, Pegorier JP. Reduced hepatic fatty acid oxidation in fasting PPAR alpha null mice is due to impaired mitochondrial hydroxymethylglutaryl‐CoA synthase gene expression. FEBS Lett. 2000;475:163‐166. [DOI] [PubMed] [Google Scholar]
Associated Data
This section collects any data citations, data availability statements, or supplementary materials included in this article.
Supplementary Materials


