

Abstract
Tissue factor (TF) is known to be overexpressed in various cancers including pancreatic cancer. The upregulation of TF expression has been observed not only in tumor cells, but also in tumor stromal cells. Because of the potential of TF as a delivery target, several studies investigated the effectiveness of Ab‐drug conjugates (ADCs) against TF for cancer therapy. However, it is still unclear whether anti‐TF ADC can exert toxicity against both tumor cells and tumor stromal cells. Here, we prepared ADC using a rat anti‐mouse TF mAb (clone.1157) and 2 types of in vivo murine pancreatic cancer models, one s.c. and other orthotopic with an abundant tumor stroma. We also compared the feasibility of bis‐alkylating conjugation (bisAlk) with that of conventional maleimide‐based conjugation (MC). In the s.c. models, anti‐TF ADC showed greater antitumor effects than control ADC. The results also indicated that the bisAlk linker might be more suitable than the MC linker for cancer treatments. In the orthotopic model, anti‐TF ADC showed greater in vivo efficacy and more extended survival time control ADC. Treatment with anti‐TF ADC (20 mg/kg, three times a week) did not affect mouse body weight changes in any in vivo experiment. Furthermore, immunofluorescence staining indicated that anti‐TF ADC delivered agents not only to TF‐positive tumor cells, but also to TF‐positive tumor vascular endothelial cells and other tumor stromal cells. We conclude that anti‐TF ADC should be a selective and potent drug for pancreatic cancer therapy.
Keywords: antibody‐drug conjugate, antitumor effect, orthotopic model, pancreatic cancer, tissue factor
1. INTRODUCTION
Pancreatic cancer has one of the worst prognoses of any malignancy. Despite recent advancements in oncological treatment, patients with pancreatic cancer have only an 8% chance of 5‐year survival.1 Thus, there is an urgent need for improved therapies for this cancer. The most common type of pancreatic cancer is pancreatic ductal adenocarcinoma (PDAC), characterized by an abundant stroma and few tumor vessels. In PDAC tissues, tumor vessels are surrounded by abundant tumor stromal components (eg, ECM, fibroblasts, and immune cells), and the majority of tumor cells are located far from tumor vessels.2 These histological features impede efficient drug delivery to pancreatic cancer cells, resulting in high resistance to current chemotherapies. Cancer stromal targeting therapy is a promising strategy to achieve the sufficient accumulation of anticancer drugs in PDAC tissues.3
Tissue factor (TF), a 47‐kDa transmembrane glycoprotein, is well known as an initiation factor of the extrinsic blood coagulation pathway. For decades, studies have reported the correlation between blood coagulation and cancer.4, 5, 6 In particular, TF expression has been observed in many types of cancer, including pancreatic cancer, glioma, colorectal cancer, non‐small‐cell lung cancer, ovarian cancer, prostate cancer, and breast cancer.7 Tissue factor expression is also upregulated in tumor stromal cells, including vascular endothelial cells, fibroblasts, and monocytes, due to exposure to pro‐inflammatory cytokines (eg, interleukin‐1β, tumor necrosis factor‐α, and lipopolysaccharide).8, 9, 10 Furthermore, several studies revealed that TF expression contributes to tumor growth, angiogenesis, and metastasis.7, 8, 11, 12 Thus, we previously suggested that TF could be an ideal target for the delivery of therapeutic agents to PDAC tissues.13, 14, 15, 16 We have already developed our own anti‐TF mAbs.17, 18
Antibody‐drug conjugates (ADCs), which consist of a mAb, linker, and cytotoxic payload, are currently considered to be a promising strategy for cancer therapy. Although this approach was first used decades ago, the efficiency of ADCs has only recently been proven in clinical studies, in association with advancements in linker technology and optimization of highly potent payloads. Since the approval of Adcetris19, 20 and Kadcyla,21 the development of ADCs has become increasingly popular in basic and clinical cancer research. Currently, more than 30 different ADCs are in clinical trials against solid tumors,22 and several ADCs targeting TF have been investigated.15, 23, 24, 25, 26 In these preclinical studies, the efficacy of anti‐TF ADCs was evaluated in several types of cancer, including pancreatic cancer, colon cancer, ovarian cancer, and triple‐negative breast cancer using conventional xenograft models or patient‐derived xenograft (PDX) models.15, 23, 24, 25, 26 However, these ADCs targeted human TF antigens expressed on the membranes of human tumor cells, rather than mouse TF antigens localized in the tumor stroma. As described above, the upregulation of TF expression has been reported in tumor stromal cells as well as tumor cells themselves. Therefore, we anticipate that evaluating the antitumor effect against both tumor cells and tumor stromal cells will be important to precisely understand and predict the efficacy of anti‐TF ADCs in the clinical phase.
In the present study, we prepared mouse pancreatic cancer cells derived from genetically engineered KPC mice (LSL‐KrasG12D/+, LSL‐Trp53R172H/+ and Ptf1a‐Cre),27 in order to investigate the efficacy of anti‐mouse TF ADCs in the orthotopic pancreatic cancer model with abundant stroma. Also, to improve the construction of anti‐TF ADCs, we evaluated the feasibility of the bis‐alkylating method instead of the conventional maleimide‐based method for binding the mAb and the linker. In the former approach, the reduced interchain disulfides of the native mAb can be covalently rebridged, resulting in homogeneous ADCs and higher serum stability.28, 29 We expect that the findings of this study will further the development of anti‐TF ADCs.
2. MATERIALS AND METHODS
2.1. Antibodies and cell cultures
Anti‐mouse TF mAb (Clone.1157, rat IgG2b) was previously established.17 A second mAb (Clone.372, rat IgG2b) was used as an isotype control.30 Capan‐1, HPAF‐II, MIA PaCa‐2, PANC‐1, and PSN‐1 cells were obtained from ATCC. These cell lines were grown in ATCC‐recommended medium supplemented with FBS (Thermo Fisher Scientific), penicillin G (100 units/mL), streptomycin (100 μg/mL), and amphotericin B (0.25 μg/mL; FUJIFILM Wako Pure Chemical) in a 5% CO2 atmosphere at 37°C.
2.2. Generation of mouse pancreatic cancer cells from transgenic mice
Genetically engineered KPC mice were originally established by the Tuveson group and have been used worldwide (LSL‐KrasG12D/+, LSL‐Trp53R172H/+, and Ptf1a‐Cre).27, 31 After KPC mice were killed under anesthesia, pancreatic tumor tissue was extracted and washed using HBSS buffer (Thermo Fisher Scientific) on ice. Tumor tissues were cut into small pieces and digested by collagenase I (300 U/mL; Sigma Aldrich) and dispase II (0.96 mg/mL; Roche) at 37°C for 30 minutes in RPMI medium (FUJIFILM Wako Pure Chemical). After centrifugation, pellets were filtered (100 μm) and cultured on a collagen‐coated dish (Corning). Mouse pancreatic cancer cells were continuously cultivated for 4 weeks. Then the cells were diluted (0.5 cells/100 μL/well) in RPMI medium and plated onto 96‐well culture plates (Corning). A single cell (mouse pancreatic cancer‐WT cell [mPan‐wt]) that was susceptible to monomethyl auristatin E (MMAE) and that had the ability to form tumors with an abundant stroma was selected for subsequent experiments. To obtain cells with high TF expression, a plasmid vector was transfected into mPan‐wt cells, as previously described.17 The subpopulation of cells with high TF expression (mPan‐TF cells) was identified using goat anti‐mouse TF polyclonal Ab (0.2 μg/mL; R&D Systems), donkey anti‐goat IgG (H+L) cross‐adsorbed secondary Ab Alexa Fluor 647 (Thermo Fisher Scientific) at a dilution of 1:500, and a FACSAria flow cytometer (BD Biosciences).
2.3. Animal models
Four‐week‐old female BALB/c nude mice were purchased from Charles River Laboratories Japan. A week later, mice were used in the experiments below. As the in vivo s.c. models, a total of 1 × 10⁶ mPan‐wt or mPan‐TF cells were s.c. inoculated in the flank region of each mouse. As the in vivo orthotopic models, a total of 1 × 10⁵ Capan‐1, HPAF‐II, MIA PaCa‐2, PANC‐1, PSN‐1, mPan‐wt, or mPan‐TF cells were inoculated with Matrigel (Corning) into the pancreas of each mouse after laparotomy under deep anesthesia. The tumor sizes in the in vivo s.c. models were calculated by the following formula: volume = length × (width)2 × 1/2. All animal experiments were carried out with the approval of the Committee for Animal Experimentation of the National Cancer Center, Japan. The animal guidelines follow the ethical standards required by Japanese law and comply with the guidelines for the use of experimental animals in Japan.
2.4. Flow cytometry analysis
The flow cytometry (FCM) procedure was previously described.30 Goat anti‐mouse TF polyclonal Ab and donkey anti‐goat IgG (H+L) cross‐adsorbed secondary Ab Alexa Fluor 647 were used for the evaluation of TF expression. The data were analyzed using a Guava EasyCyte flow cytometer (Merck Millipore) and FlowJo analysis software (Tree Star).
To evaluate the binding affinity of IgGs and ADCs, mPan‐TF cells were treated with IgGs and ADCs at various concentrations (250, 50, 10, 2, 0.4, and 0.08 nM), and goat anti‐rat IgG (H+L) cross‐adsorbed secondary Ab Alexa Fluor 647 was used as a secondary Ab.
2.5. Fluorescence immunostaining and H&E staining
The staining protocols were previously described.30 Briefly, frozen sections were stained with the following primary Abs: goat anti‐mouse TF polyclonal Ab (1:250; R&D Systems), goat anti‐CD31 polyclonal Ab (1:100, R&D Systems), rabbit anti‐α‐ smooth muscle actin (αSMA) Ab (1:100, Abcam), rabbit anti‐collagen type I polyclonal Ab (1:1000, Merck Millipore), rabbit anti‐cytokeratin Ab (1:100, Abcam), and rabbit anti‐caspase3 (Asp175) Ab (1:400, Cell Signaling Technology). Rabbit anti‐caspase3 Ab was reacted at 4°C overnight, and the other primary Abs were reacted at room temperature (RT) for 1 hour. The sections were also stained with secondary Abs including donkey anti‐goat IgG (H+L) cross‐adsorbed secondary Ab Alexa Fluor 647 (1:500) and goat anti‐rabbit IgG (H+L) cross‐adsorbed secondary Ab Alexa Fluor 647 (1:250; Thermo Fisher Scientific) at RT for 1 hour. Hematoxylin‐eosin staining was also carried out. All images were obtained using a Virtual Slide Microscope (Olympus) under identical conditions. Fluorescence image analysis was undertaken by using ImageJ, a public domain Java image‐processing program.
2.6. Preparation of anti‐mouse TF ADCs
To conjugate MMAE with Ab, we used 2 types of linker structure. For the conventional linker, we used maleimidocaproyl‐PEG12‐valine‐citrulline‐p‐amino‐benzoyloxycarbonyl (MC‐PEG12‐vc‐PABC). In comparison with the conventional linker, we also used bis‐alkylating bis‐sulfone group‐PEG12‐valine‐citrulline‐p‐amino‐benzoyloxycarbonyl (bisAlk‐PEG12‐vc‐PABC). The procedure for preparing ADCs was described previously.13 The concentrations of cysteamine hydrochloride (Sigma Aldrich) we used were 5.8, 8, 25, and 30 mM to prepare control ADC with MC‐PEG12‐vs‐PABC‐MMAE (MC‐MMAE), anti‐TF ADC with MC‐MMAE, control ADC with bisAlk‐PEG12‐vc‐PABC‐MMAE (bisAlk‐MMAE), and anti‐TF ADC with bisAlk‐MMAE, respectively. The ADCs were stored at −80°C until use in subsequent experiments.
2.7. Gel electrophoresis
Each IgG and ADC was loaded (10 μg/lane) on a 4%‐15% gradient gel (Bio‐Rad) under nonreducing conditions. The gels were stained with Coomassie Brilliant Blue R‐250 (FUJIFILM Wako Pure Chemical) and scanned using ChemiDoc XRS+ (Bio‐Rad).
2.8. Fluorescence cell imaging
The procedure was previously described.15 The cells were separately treated with each ADC (2 μg/mL) conjugated with Alexa Fluor 488 at 37°C for 3 hours. Representative fluorescence images were obtained using a BIOREVO BZ9000 (Keyence) under the same conditions.
2.9. Internalization assay
The method was previously described.13 More than 300 cells per well were randomly selected, and the average fluorescence intensity of the cells was measured using an ArrayScan VTI HCS Reader (Thermo Fisher Scientific) under the same conditions.
2.10. Monomethyl auristatin E release
Recombinant mouse cathepsin B from CHO cells (BioLegend) was activated by incubation at 25°C for 3 minutes in 25 mM MES buffer (pH 5.0) containing 1 mM DTT (Sigma Aldrich). Each ADC was incubated at 37°C for 0, 1, 3, 6, or 24 hours with 0.67 μg/mL activated cathepsin B and monomethyl auristatin F in 25 mM MES buffer (pH 5.0). The method for quantifying MMAE was previously described.13 Monomethyl auristatin F was used as an internal standard for analysis.
2.11. Cell cytotoxicity
The cells were harvested at 2.5 × 10³ cells/well on 96‐well plates and incubated at 37°C overnight. Then the cells were treated with MMAE (30 nM) or ADCs (1.5 μg/mL, equivalent MMAE concentration with 30 nM MMAE) at 37°C for 72 hours. The cell viabilities were calculated using CCK‐8 (Dojindo).
2.12. Antitumor effects in s.c. models
When tumor sizes reached 150 mm3, mice were randomly grouped and treated i.v. with 10 or 20 mg/kg ADC. Dulbecco's PBS (DPBS) or MMAE (0.3 mg/kg, equivalent MMAE dose with 20 mg/kg ADC) were also used for the control groups. All treatments were implemented twice per week for 3 weeks.
2.13. Antitumor effects in orthotopic model
Treatment experiments were begun with 20 mg/kg ADC or 0.3 mg/kg MMAE twice per week for 3 weeks, beginning 2 weeks after transplantation. Then mice were killed under deep anesthesia, and pancreatic tumors were harvested. After the tumor weights were measured, tumors were immediately embedded in Tissue Tec optimal cutting temperature compound and frozen at −80°C for the immunofluorescence staining.
2.14. Survival study
The treatment experiments were started with 20 mg/kg ADC three times per week for 3 weeks, beginning 2 weeks after transplantation. As a control group, mice were treated with both 0.3 mg/kg MMAE and 20 mg/kg anti‐TF mAb (unconjugated).
2.15. Statistical analysis
Data analysis was undertaken using EZR software. The error bars of all data are shown as the mean ± SD. Analyses of fluorescence images and tumor weight were undertaken by one‐way ANOVA with Tukey analysis. Repeated ANOVA was applied for analysis of in vivo efficacy in s.c. models. The log‐rank test of Kaplan‐Meier curves was applied to analyze statistical differences in survival time.
3. RESULTS
3.1. Preparation of mouse pancreatic tumor models
The original cell clone (mPan‐wt cell) was selected through the cell selection process shown in Figure 1A. The mPan‐wt cells showed sensitivity to MMAE and an ability to form tumors with abundant tumor stroma. However, there was low mouse TF expression was in mPan‐wt tumors. Thus, in order to obtain mouse pancreatic cancer cells with high TF expression, mPan‐wt cells were transfected with the mouse TF gene and the subpopulation with high TF expression was then sorted (mPan‐TF cells). Although there were no morphologic differences between mPan‐wt cells and mPan‐TF cells, FCM data revealed that mPan‐TF cells expressed higher levels of mouse TF protein on the cell surface than mPan‐wt cells (Figure 1B). To investigate the histological features of tumors, we used H&E staining and fluorescence immunostaining of pancreatic tumors excised from KPC and orthotopic mouse models (Figure 1C). The H&E staining indicated that the orthotopic models based on mPan‐wt cells and mPan‐TF cells formed stroma‐rich pancreatic tumors that were similar to tumors of KPC mice. Fluorescence immunostaining of tumor tissues confirmed that there were no significant differences in relative αSMA/DAPI and collagen I/DAPI areas between the KPC mouse model and the orthotopic models based on mPan‐wt cells and mPan‐TF cells (Figure 1D,E). In addition, all 3 tumors were characterized by more αSMA‐ and collagen I‐positive regions compared with orthotopic tumors based on human pancreatic cancer cell lines (P < .05 and P < .001, respectively). Mouse TF expression levels were also confirmed by fluorescence immunostaining (Figure 1C) and were found to differ greatly between individual KPC mice. Therefore, we decided to use the orthotopic models based on mPan‐wt cells and mPan‐TF cells in order to simplify the evaluation of the in vivo effects of anti‐mouse TF ADCs. Furthermore, fluorescence immunostaining revealed that both tumor cells (cytokeratin‐positive) and tumor stromal cells, including tumor vascular endothelial cells (CD31‐positive), were mouse TF‐positive in the orthotopic model using mPan‐TF cells (Figure 1F).
Figure 1.
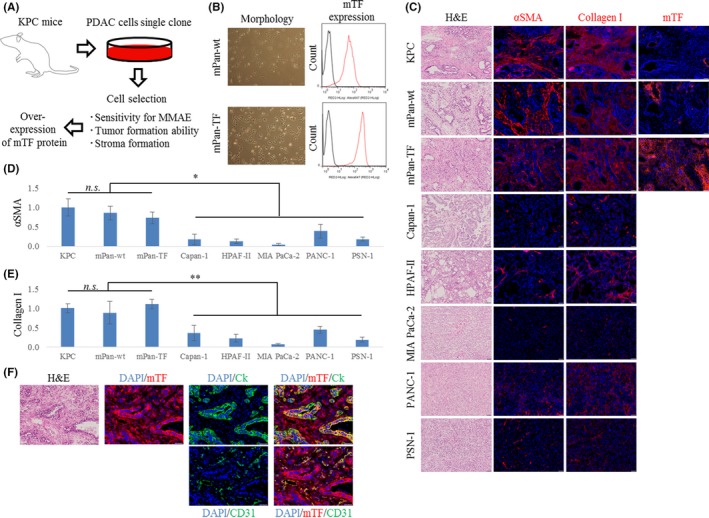
Preparation of mouse pancreatic cancer cells. A, Diagram of the preparation process. B, Mouse pancreatic cancer cell morphology and mouse tissue factor (mTF) expression. C, Representative micrographs of H&E‐ and immunofluorescence‐stained tumors in orthotopic models. Blue, DAPI; red, each marker. Scale bar = 50 μm. D,E, Relative fluorescence area of (D) α‐smooth muscle actin (αSMA)/DAPI and (E) collagen I/DAPI in tumors (n = 5). Error bars, SD. *P < .05; **P < .001. n.s., not significant (one‐way ANOVA with Tukey analysis). F, Representative micrographs of H&E‐ and immunofluorescence‐stained tumors in the orthotopic model based on mouse pancreatic cancer‐WT cells (mPan‐wt) and those with high TF expression (mPan‐TF). Blue, DAPI; green, cytokeratin (Ck) or CD31; red, mTF. Scale bar, 50 μm
3.2. Characteristics of ADCs in vitro
We prepared 2 types of both anti‐TF ADC and control ADC using MC‐MMAE and bisAlk‐MMAE. The construction of the cytotoxic drug and linker are described in Figure 2A. The drug Ab ratio of control ADC with MC‐MMAE, and anti‐TF ADC with MC‐MMAE, control ADC with bisAlk‐MMAE, and anti‐TF ADC with bisAlk‐MMAE was 3.32, and 3.27, 3.25, and 3.34, respectively. The SDS‐PAGE under nonreducing conditions revealed that there was less contamination with small molecules (eg, light chains or heavy chains) in control ADC with bisAlk‐MMAE and in anti‐TF ADC with bisAlk‐MMAE compared to control ADC with MC‐MMAE and anti‐TF ADC with MC‐MMAE. This might be due to limited bridging between the bisAlk linker and the two thiol side chains of the cysteine residues in the mAb (Figure 2B). The FCM analysis indicated that anti‐TF mAb, anti‐TF ADC with MC‐MMAE, and anti‐TF ADC with bisAlk‐MMAE had almost the same cell‐binding affinity to mPan‐TF cells (Figure 2C). In contrast, control mAb, control ADC with MC‐MMAE, and control ADC with bisAlk‐MMAE showed no cell‐binding affinity. Moreover, fluorescence images indicated that anti‐TF ADC with MC‐MMAE and anti‐TF ADC with bisAlk‐MMAE internalized into mPan‐TF cells, because they appeared to be colocalized with lysosomes in the cell cytoplasm (Figure 2D). Anti‐TF ADC with MC‐MMAE and anti‐TF ADC with bisAlk‐MMAE also efficiently internalized into cells to a degree that depended on the TF expression levels of the targeted cells and the incubation time. However, control ADC with MC‐MMAE and control ADC with bisAlk‐MMAE did not internalize into cells (Figure 2E,F). When cathepsin B was applied to ADC fractions, the release rate of MMAE from each ADC was equivalent in all samples (Figure 2G). Furthermore, the cytotoxicity assay showed that none of the ADCs showed cytotoxic effects against mPan‐wt cells (Figure 2H). In contrast, anti‐TF ADC with MC‐MMAE and anti‐TF ADC with bisAlk‐MMAE showed cytotoxic activities against mPan‐TF cells, but control ADC with MC‐MMAE and control ADC with bisAlk‐MMAE did not (Figure 2I).
Figure 2.
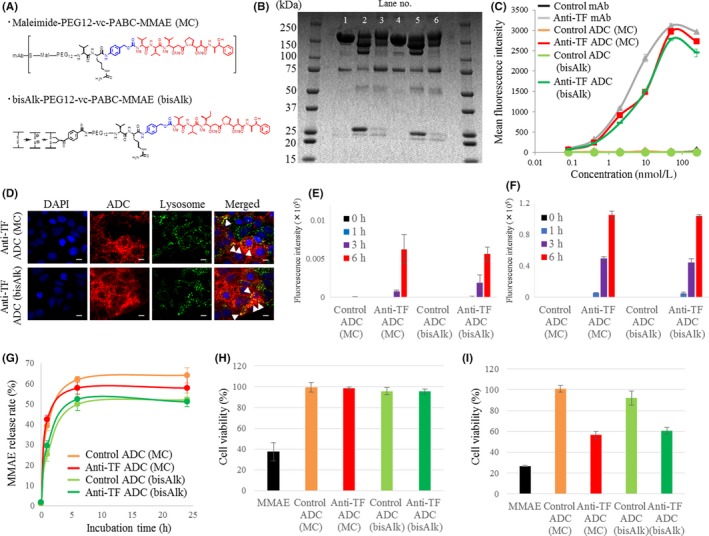
Characteristics of Ab‐drug conjugates (ADCs) in vitro. A, Chemical structure of linkers based on maleimide‐based conjugation (MC) and bis‐alkylating conjugation (bisAlk). B, SDS‐PAGE. Lane 1, control mAb. Lane 2, control ADC (MC). Lane 3, control ADC (bisAlk). Lane 4, anti‐tissue factor (TF) mAb. Lane 5, anti‐TF ADC (MC). Lane 6, anti‐TF ADC (bisAlk). C, Flow cytometry analysis of IgGs and ADCs using mouse pancreatic cancer cells with high TF expression (mPan‐TF) (n = 3). D, Representative micrographs of mPan‐TF cells in fluorescence cell imaging. Blue, DAPI; green, lysosomes; red, ADCs. Scale bar = 20 μm. Arrow (yellow) indicates ADC merging with lysosome. E,F, Internalization efficiency of ADCs against (E) mPan‐wt cells and (F) mPan‐TF cells (n = 3). G, Payload release rate of ADCs (n = 3). H,I, Cytotoxic activity of ADCs against (H) mPan‐wt cells and (I) mPan‐TF cells (n = 4). All error bars, SD. MMAE, monomethyl auristatin E
3.3. Antitumor effects in s.c. tumor models
The in vivo efficacy of ADCs was evaluated in s.c. tumor models based on mPan‐TF and mPan‐wt cells. In the s.c. tumor model with mPan‐TF cells, anti‐TF ADC with MC‐MMAE at 20 mg/kg inhibited tumor growth more than control ADC with MC‐MMAE at 20 mg/kg (P < .001; Figure 3A). However, no significant difference was observed between anti‐TF ADC with MC‐MMAE at a lower dose (10 mg/kg) and DPBS. In contrast, anti‐TF ADC with bisAlk‐MMAE at 10 mg/kg significantly inhibited tumor growth compared with DPBS (P < .05). In the case of anti‐TF ADC with bisAlk‐MMAE at 20 mg/kg, a significant antitumor effect was observed compared with control ADC with bisAlk‐MMAE at 20 mg/kg (P < .0005; Figure 3B). As expected, in the s.c. tumor model with mPan‐wt cells, there was no difference in antitumor effect between anti‐TF ADC with MC‐MMAE at 20 mg/kg and control ADC with MC‐MMAE at 20 mg/kg (Figure 3D). Unexpectedly, however, anti‐TF ADC with bisAlk‐MMAE at 20 mg/kg showed a greater antitumor effect than control ADC with bisAlk‐MMAE at 20 mg/kg (P < .01; Figure 3E). In these in vivo experiments, no treatments caused changes in mouse body weight (Figure 3C,F).
Figure 3.
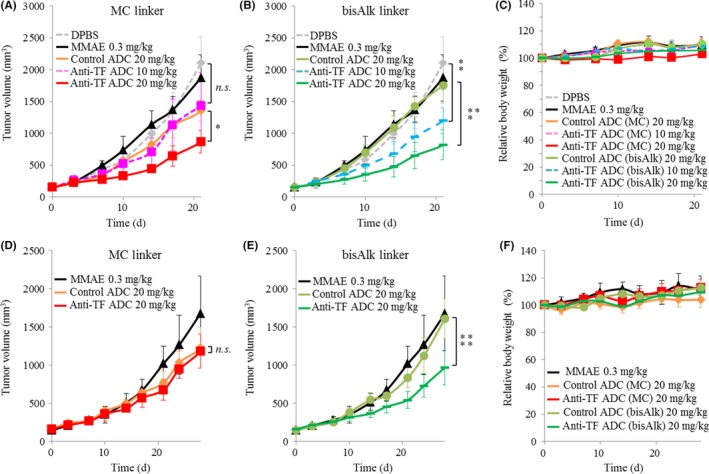
Antitumor effects in s.c. murine pancreatic cancer models. A,B, Antitumor effects of (A) Ab‐drug conjugates (ADCs) with maleimide‐based conjugation (MC) linker and (B) ADCs with bis‐alkylating conjugation (bisAlk) linker in an s.c. model of mouse pancreatic cancer cells with high tissue factor expression (mPan‐TF) (n = 5). C, Body weight changes in s.c. models based on mPan‐TF cells. D,E, Antitumor effects of (D) ADCs with MC linker and (E) ADCs with bisAlk linker in an s.c. model of mPan‐wt cells (n = 5). F, Relative body weight changes in s.c. models based on mPan‐wt cells. Error bars, SD. *P < .001; **P < .05; ***P < .0005; ****P < .01. n.s., not significant (repeated measures ANOVA). DPBS, Dulbecco's PBS; MMAE, monomethyl auristatin E
3.4. Antitumor effects in the orthotopic model
The orthotopic model based on mPan‐TF cells was studied in vivo as shown in Figure 4A. A comparison of tumor weights indicated that anti‐TF ADC with bisAlk‐MMAE significantly inhibited tumor growth relative to MMAE (P < .001) and control ADC with bisAlk‐MMAE (P < .01; Figure 4B,C). The efficacy of anti‐TF ADC with bisAlk‐MMAE was also assessed in a survival study using the mPan‐TF cell orthotopic model. The results indicated that anti‐TF ADC with bisAlk‐MMAE showed greater antitumor activity than the control groups and prolonged mouse survival time (P = .00028; Figure 4E). No treatments resulted in body weight changes (Figure 4D,F).
Figure 4.
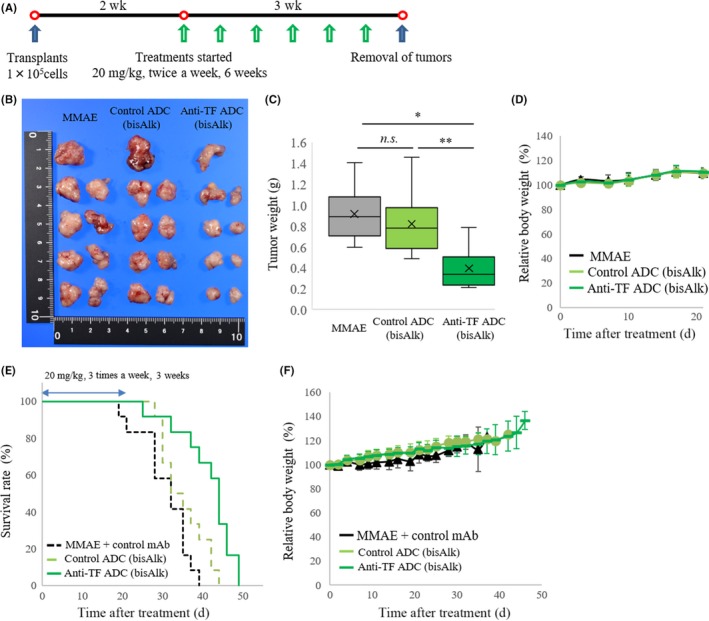
Antitumor effects in orthotopic murine pancreatic cancer models. A, Treatment scheme in orthotopic model based on mouse pancreatic cancer cells with high tissue factor expression (mPan‐TF cells). B, Images of removed tumors after treatment with each agent (n = 9). C, Relative tumor weights in orthotopic models of mPan‐TF cells. *P < .001; **P < .01. n.s., not significant (one‐way ANOVA with Tukey analysis). D, Relative body weight changes in orthotopic model based on mPan‐TF cells. E, Kaplan‐Meier curves in survival study (P = .00028, log‐rank test, n = 12). F, Relative body weight changes in survival study. ADC, Ab‐drug conjugate; bisAlk, bis‐alkylating conjugation; MMAE, monomethyl auristatin E
3.5. Histological changes in tumor tissues after treatments
Immunofluorescence staining was carried out to compare the effects of control ADC with bisAlk‐MMAE and anti‐TF ADC with bisAlk‐MMAE on tumor tissues in the orthotopic model based on mPan‐TF cells. The tumors shown in Figure 4B were used to evaluate the expression of mouse TF, CD31, αSMA, collagen I, and cytokeratin. Representative images are shown in Figure 5A. Additionally, the fluorescence images were analyzed to calculate the relative fluorescence intensity or area in tumor tissues (Figure 5B‐F). The results revealed that anti‐TF ADC with bisAlk‐MMAE decreased the expression of mouse TF and CD31 compared with control ADC with bisAlk‐MMAE in tumor tissues (P < .0001). However, there were no changes in the expression of αSMA, collagen I, or cytokeratin. These data indicated that anti‐TF ADC with bisAlk‐MMAE exerted a cytotoxic effect against tumor cells and tumor vascular endothelial cells. Furthermore, immunofluorescence staining of cleaved caspase 3 confirmed that tumor vascular endothelial cells (CD31‐positive) underwent apoptosis in tumors treated with anti‐TF ADC with bisAlk‐MMAE (Figure 5G).
Figure 5.
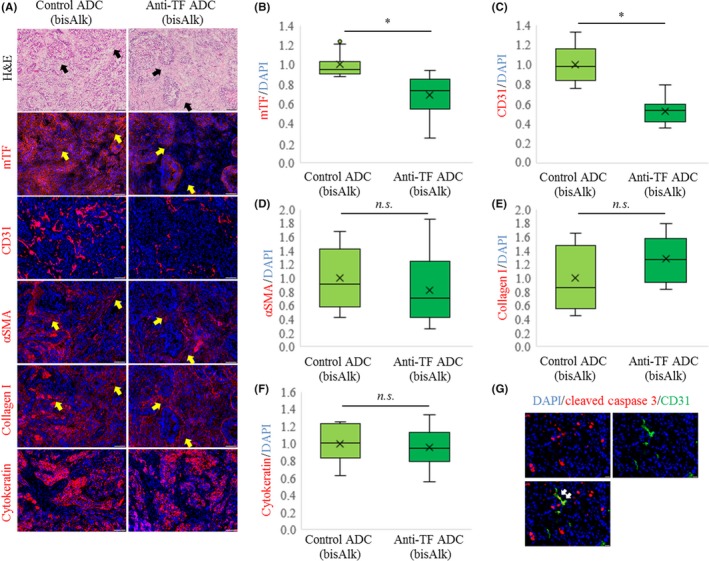
Changes in tumor tissues after treatment with Ab‐drug conjugates (ADCs) in orthotopic model based on mouse pancreatic cancer cells with high tissue factor expression (mPan‐TF) cells. A, Representative micrographs of H&E‐ and immunofluorescence‐stained tumors. Blue, DAPI; red, each marker. Scale bar = 100 μm. Arrows, collagen I and αSMA positive area. B, Relative fluorescence intensity of mouse TF (mTF)/DAPI area in tumors (n = 16). Relative fluorescence areas of (C) CD31/DAPI, (D) α‐smooth muscle actin (αSMA)/DAPI, (E) collagen I/DAPI, and (F) cytokeratin/DAPI in tumors (n = 16). Error bars, SD. *P < .0001. n.s., not significant (Student's t test). G, Representative micrographs of immunofluorescence‐stained tumors after treatments with anti‐TF ADC with bis‐alkylating conjugation (bisAlk)‐monomethyl auristatin E. Blue, DAPI; green, CD31; red, cleaved caspase 3. Scale bar = 20 μm
4. DISCUSSION
In order to predict clinical results from basic research, it is important to use the correct experimental models and tools. In the present study, we established pancreatic tumor cell lines derived from the KPC mouse in order to evaluate the efficacy of anti‐mouse TF ADCs in allograft models (Figure 1A). In contrast with human pancreatic cancer cell lines that are commonly used experimentally, these cell lines showed an ability to form tumors with an abundant stroma (Figure 1C‐E). The present data indicate that the tumor tissues in the orthotopic mouse pancreatic cancer models established in this study are more similar to those in actual clinical pancreatic cancer than those in models based on conventional human pancreatic cancer cell lines. Also, mouse TF expression was observed in both tumor cells and tumor stromal cells in the orthotopic model based on mPan‐TF cells (Figure 1F). Therefore, we suggest that the newly established mouse pancreatic cancer cells could be ideal as a basis for in vivo models to evaluate the effects of anti‐mouse TF ADCs. In vitro experiments revealed that anti‐TF ADC with MC‐MMAE and anti‐TF ADC with bisAlk‐MMAE had the ability to bind to and internalize into mouse TF‐positive cells, eventually exerting cytotoxicity against them in an mTF expression‐dependent manner (Figure 2). In vivo studies indicated that the antitumor effect of anti‐TF ADC with MC‐MMAE and anti‐TF ADC with bisAlk‐MMAE was greater than that of control ADCs in the s.c. tumor model based on mPan‐TF cells (Figure 3A,B). In contrast, in the s.c. tumor model based on mPan‐wt cells, the antitumor activity of anti‐TF ADC with MC‐MMAE was equivalent to that of control ADC with MC‐MMAE (Figure 3D). However, anti‐TF ADC with bisAlk‐MMAE showed greater antitumor effects than control ADC with bisAlk‐MMAE in the model (Figure 3E). These results, together with the higher stability of the ADC structure (Figure 2B), indicate that anti‐TF ADC with bisAlk‐MMAE could be more suitable for cancer treatment than anti‐TF ADC with MC‐MMAE. Additionally, anti‐TF ADC with bisAlk‐MMAE showed greater antitumor effects and a more prolonged survival period than control groups in the orthotopic model based on mPan‐TF cells (Figure 4B,C,E). Importantly, no body weight changes were observed in any in vivo experiments, meaning that anti‐TF ADCs should have high tolerability (Figures 3C,F and 4D,G). Furthermore, the results of immunofluorescence staining indicated that anti‐TF ADC with bisAlk‐MMAE exerted cytotoxic effects against TF‐positive cells, including tumor cells, tumor vascular endothelial cells, and other tumor stromal cells (Figure 5).
Our data predicted the resistance mechanism of anti‐TF ADC. As mentioned above, decreased expression of mouse TF was observed in both tumor cells and tumor stromal cells (Figure 5A), meaning that anti‐TF ADC with bisAlk‐MMAE caused damage to TF‐positive cell populations. However, the fluorescence area of αSMA/DAPI, collagen I/DAPI, and cytokeratin/DAPI was not changed by treatment with anti‐TF ADC with bisAlk‐MMAE (Figure 5D‐F). Thus, TF‐negative cell populations could survive and proliferate in tumor tissues after treatments. The decreased expression of targeted antigens has also been reported following treatment with other ADCs (eg, trastuzumab emtansine), and is one cause of resistance in vivo.32, 33 Our findings indicate that treatment with anti‐TF ADCs will be affected by the same resistance mechanism. This might be one of the reasons why anti‐TF ADC with bisAlk‐MMAE failed to show a marked effect in this study. Also, tumor stromal cells, such as tumor vascular endothelial cells and tumor‐associated fibroblasts, could have a slower proliferation rate compared with tumor cells. Furthermore, one study reported that tumor vascular endothelial cells are resistant to MMAE because they express ATP‐binding cassette transporter P‐glycoprotein.34 Therefore, other payloads, such as pyrrolobenzodiazepines, could improve the in vivo efficacy of anti‐TF ADCs. As another approach, it might be necessary to investigate the efficacy of anti‐TF ADCs in combination with conventional antitumor agents.
The most important result of this study is that mouse pancreatic orthotopic models containing an abundant tumor stroma were successfully used to evaluate anti‐TF ADC. We emphasize that this is the first study to simultaneously evaluate the effects of anti‐TF ADC against tumor cells and tumor stromal cells in stroma‐rich tumor models. The antitumor effects of most ADCs have been investigated in conventional xenograft models or PDX models with s.c. tumors. In most cases, these ADCs recognize only human antigens, not murine antigens. Also, many studies found that human stromal regions in PDX tumors were gradually replaced by murine stromal cells.35, 36, 37 Therefore, in addition to these standard analyses, research using ADCs that recognize host‐expressed antigens should greatly increase our understanding of where ADCs are distributed in tumor tissues, how ADCs affect tumor environments, and what degree of side effects should be expected, especially when the targeted antigens are expressed in not only tumor cells but also other cell populations (eg, tumor stromal cells and normal cells). Furthermore, greater attention should be paid to stromal cells when evaluating ADCs for pancreatic cancer therapy, because the major components of pancreatic tumors are not tumor cells themselves, but rather the ECM and stromal cells. However, it will be difficult to generate mAbs that recognize a common epitope shared by humans and mice. Therefore, research using ADCs that recognize host‐expressed antigens, as well as animal models that mimic the features of human tumors, will greatly facilitate our ability to precisely estimate the delivery of payload to tumor tissues and to obtain data that can be extrapolated to clinical studies.
CONFLICT OF INTEREST
The authors have no conflicts of interest.
ACKNOWLEDGMENTS
This work was supported by the National Cancer Center Research and Development Fund (23‐A‐45 and 29‐A‐9 to Y. Matsumura) and by the Japan Society for the Promotion of Science (JSPS) KAKENHI (Grant No. JP 18K14931 to R. Tsumura).
Tsumura R, Manabe S, Takashima H, Koga Y, Yasunaga M, Matsumura Y. Evaluation of the antitumor mechanism of antibody‐drug conjugates against tissue factor in stroma‐rich allograft models. Cancer Sci. 2019;110:3296‐3305. 10.1111/cas.14146
REFERENCES
- 1. Howlader N, Noone A, Krapcho M, et al. SEER cancer statistics review. 1975‐2014, National Cancer Institute Bethesda, MD. https://seercancergov/csr/1975_2014/, based on November 2016 SEER data submission, posted to the SEER web site, Accessed September 26, 2017.
- 2. Hexige S, Ardito‐Abraham CM, Wu Y, et al. Identification of novel vascular projections with cellular trafficking abilities on the microvasculature of pancreatic ductal adenocarcinoma. J Pathol. 2015;236:142‐154. [DOI] [PMC free article] [PubMed] [Google Scholar]
- 3. Matsumura Y. Cancer stromal targeting (CAST) therapy. Adv Drug Deliv Rev. 2012;64:710‐719. [DOI] [PubMed] [Google Scholar]
- 4. Rak J, Yu JL, Luyendyk J, Mackman N. Oncogenes, trousseau syndrome, and cancer‐related changes in the coagulome of mice and humans. Can Res. 2006;66:10643‐10646. [DOI] [PubMed] [Google Scholar]
- 5. Stein PD, Beemath A, Meyers FA, Skaf E, Sanchez J, Olson RE. Incidence of venous thromboembolism in patients hospitalized with cancer. Am J Med. 2006;119:60‐68. [DOI] [PubMed] [Google Scholar]
- 6. Khorana AA, Fine RL. Pancreatic cancer and thromboembolic disease. Lancet Oncol. 2004;5:655‐663. [DOI] [PubMed] [Google Scholar]
- 7. van den Berg YW, Osanto S, Reitsma PH, Versteeg HH. The relationship between tissue factor and cancer progression: insights from bench and bedside. Blood. 2012;119:924‐932. [DOI] [PubMed] [Google Scholar]
- 8. Anand M, Brat DJ. Oncogenic regulation of tissue factor and thrombosis in cancer. Thromb Res. 2012;129(Suppl 1):S46‐S49. [DOI] [PubMed] [Google Scholar]
- 9. Ueno T, Toi M, Koike M, Nakamura S, Tominaga T. Tissue factor expression in breast cancer tissues: its correlation with prognosis and plasma concentration. Br J Cancer. 2000;83:164‐170. [DOI] [PMC free article] [PubMed] [Google Scholar]
- 10. Vrana JA, Stang MT, Grande JP, Getz MJ. Expression of tissue factor in tumor stroma correlates with progression to invasive human breast cancer: paracrine regulation by carcinoma cell‐derived members of the transforming growth factor beta family. Can Res. 1996;56:5063‐5070. [PubMed] [Google Scholar]
- 11. Yamashita H, Kitayama J, Ishikawa M, Nagawa H. Tissue factor expression is a clinical indicator of lymphatic metastasis and poor prognosis in gastric cancer with intestinal phenotype. J Surg Oncol. 2007;95:324‐331. [DOI] [PubMed] [Google Scholar]
- 12. Ngo CV, Picha K, McCabe F, et al. CNTO 859, a humanized anti‐tissue factor monoclonal antibody, is a potent inhibitor of breast cancer metastasis and tumor growth in xenograft models. Int J Cancer. 2007;120:1261‐1267. [DOI] [PubMed] [Google Scholar]
- 13. Tsumura R, Manabe S, Takashima H, Koga Y, Yasunaga M, Matsumura Y. Influence of the dissociation rate constant on the intra‐tumor distribution of antibody‐drug conjugate against tissue factor. J Control Release. 2018;284:49‐56. [DOI] [PubMed] [Google Scholar]
- 14. Sugaya A, Hyodo I, Koga Y, et al. Utility of epirubicin‐incorporating micelles tagged with anti‐tissue factor antibody clone with no anticoagulant effect. Cancer Sci. 2016;107:335‐340. [DOI] [PMC free article] [PubMed] [Google Scholar]
- 15. Koga Y, Manabe S, Aihara Y, et al. Antitumor effect of antitissue factor antibody‐MMAE conjugate in human pancreatic tumor xenografts. Int J Cancer. 2015;137:1457‐1466. [DOI] [PMC free article] [PubMed] [Google Scholar]
- 16. Yamamoto Y, Hyodo I, Koga Y, et al. Enhanced antitumor effect of anti‐tissue factor antibody‐conjugated epirubicin‐incorporating micelles in xenograft models. Cancer Sci. 2015;106:627‐634. [DOI] [PMC free article] [PubMed] [Google Scholar]
- 17. Sato R, Obonai T, Tsumura R, et al. Preparation and characterization of anti‐tissue factor single‐chain variable fragment antibody for cancer diagnosis. Cancer Sci. 2014;105:1631‐1637. [DOI] [PMC free article] [PubMed] [Google Scholar]
- 18. Saito Y, Hashimoto Y, Kuroda J, et al. The inhibition of pancreatic cancer invasion‐metastasis cascade in both cellular signal and blood coagulation cascade of tissue factor by its neutralisation antibody. Eur J Cancer. 2011;47:2230‐2239. [DOI] [PubMed] [Google Scholar]
- 19. Younes A, Bartlett NL, Leonard JP, et al. Brentuximab vedotin (SGN‐35) for relapsed CD30‐positive lymphomas. N Engl J Med. 2010;363:1812‐1821. [DOI] [PubMed] [Google Scholar]
- 20. Francisco JA, Cerveny CG, Meyer DL, et al. cAC10‐vcMMAE, an anti‐CD30‐monomethyl auristatin E conjugate with potent and selective antitumor activity. Blood. 2003;102:1458‐1465. [DOI] [PubMed] [Google Scholar]
- 21. Lewis Phillips GD, Li G, Dugger DL, et al. Targeting HER2‐positive breast cancer with trastuzumab‐DM1, an antibody‐cytotoxic drug conjugate. Can Res. 2008;68:9280‐9290. [DOI] [PubMed] [Google Scholar]
- 22. Diamantis N, Banerji U. Antibody‐drug conjugates–an emerging class of cancer treatment. Br J Cancer. 2016;114:362‐367. [DOI] [PMC free article] [PubMed] [Google Scholar]
- 23. Theunissen JW, Cai AG, Bhatti MM, et al. Treating tissue factor‐positive cancers with antibody‐drug conjugates that do not affect blood clotting. Mol Cancer Ther. 2018;17:2412‐2426. [DOI] [PubMed] [Google Scholar]
- 24. Zhang X, Li Q, Zhao H, et al. Pathological expression of tissue factor confers promising antitumor response to a novel therapeutic antibody SC1 in triple negative breast cancer and pancreatic adenocarcinoma. Oncotarget. 2017;8:59086‐59102. [DOI] [PMC free article] [PubMed] [Google Scholar]
- 25. de Goeij BE, Satijn D, Freitag CM, et al. High turnover of tissue factor enables efficient intracellular delivery of antibody‐drug conjugates. Mol Cancer Ther. 2015;14:1130‐1140. [DOI] [PubMed] [Google Scholar]
- 26. Breij EC, de Goeij BE, Verploegen S, et al. An antibody‐drug conjugate that targets tissue factor exhibits potent therapeutic activity against a broad range of solid tumors. Can Res. 2014;74:1214‐1226. [DOI] [PubMed] [Google Scholar]
- 27. Hingorani SR, Wang L, Multani AS, et al. Trp53R172H and KrasG12D cooperate to promote chromosomal instability and widely metastatic pancreatic ductal adenocarcinoma in mice. Cancer Cell. 2005;7:469‐483. [DOI] [PubMed] [Google Scholar]
- 28. Badescu G, Bryant P, Bird M, et al. Bridging disulfides for stable and defined antibody drug conjugates. Bioconjug Chem. 2014;25:1124‐1136. [DOI] [PubMed] [Google Scholar]
- 29. Balan S, Choi JW, Godwin A, et al. Site‐specific PEGylation of protein disulfide bonds using a three‐carbon bridge. Bioconjug Chem. 2007;18:61‐76. [DOI] [PubMed] [Google Scholar]
- 30. Tsumura R, Sato R, Furuya F, et al. Feasibility study of the Fab fragment of a monoclonal antibody against tissue factor as a diagnostic tool. Int J Oncol. 2015;47:2107‐2114. [DOI] [PubMed] [Google Scholar]
- 31. Obonai T, Fuchigami H, Furuya F, Kozuka N, Yasunaga M, Matsumura Y. Tumour imaging by the detection of fibrin clots in tumour stroma using an anti‐fibrin Fab fragment. Sci Rep. 2016;6:23613. [DOI] [PMC free article] [PubMed] [Google Scholar]
- 32. Loganzo F, Tan X, Sung M, et al. Tumor cells chronically treated with a trastuzumab‐maytansinoid antibody‐drug conjugate develop varied resistance mechanisms but respond to alternate treatments. Mol Cancer Ther. 2015;14:952‐963. [DOI] [PubMed] [Google Scholar]
- 33. Barok M, Joensuu H, Isola J. Trastuzumab emtansine: mechanisms of action and drug resistance. Breast Cancer Res. 2014;16:209. [DOI] [PMC free article] [PubMed] [Google Scholar]
- 34. Seaman S, Zhu Z, Saha S, et al. Eradication of tumors through simultaneous ablation of CD276/B7‐H3‐positive tumor cells and tumor vasculature. Cancer Cell. 2017;31:501‐515 e8. [DOI] [PMC free article] [PubMed] [Google Scholar]
- 35. Chao C, Widen SG, Wood TG, et al. Patient‐derived xenografts from colorectal carcinoma: a temporal and hierarchical study of murine stromal cell replacement. Anticancer Res. 2017;37:3405‐3412. [DOI] [PMC free article] [PubMed] [Google Scholar]
- 36. Cassidy JW, Caldas C, Bruna A. Maintaining tumor heterogeneity in patient‐derived tumor xenografts. Can Res. 2015;75:2963‐2968. [DOI] [PMC free article] [PubMed] [Google Scholar]
- 37. DeRose YS, Wang G, Lin YC, et al. Tumor grafts derived from women with breast cancer authentically reflect tumor pathology, growth, metastasis and disease outcomes. Nat Med. 2011;17:1514‐1520. [DOI] [PMC free article] [PubMed] [Google Scholar]