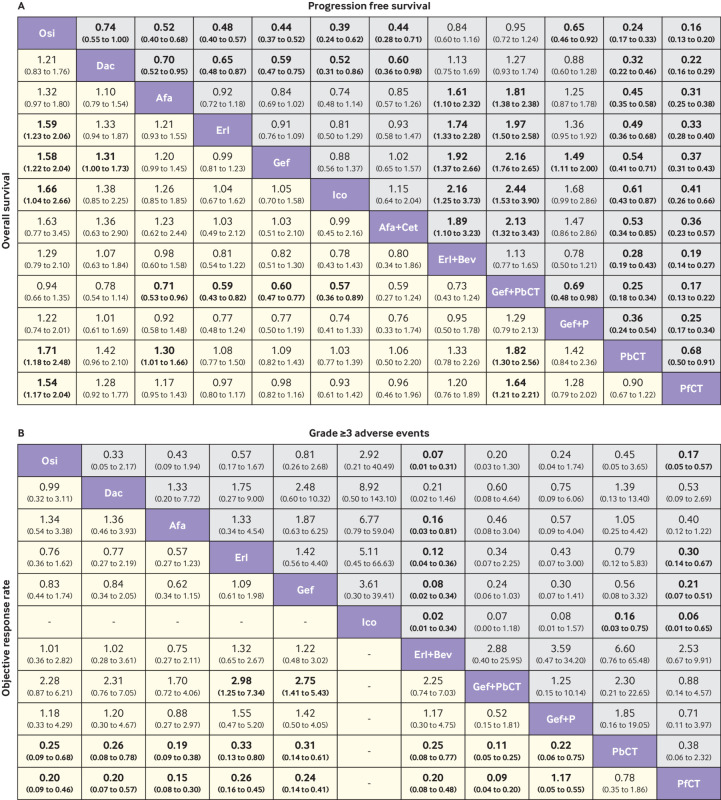
Fig 3.
Pooled estimates of the network meta-analysis. (A) Pooled hazard ratios (95% credible intervals) for progression free survival (upper triangle) and overall survival (lower triangle). (B) Pooled odds ratios (95% credible intervals) for adverse events of grade 3 or higher (upper triangle) and objective response rate (lower triangle). Data in each cell are hazard or odds ratios (95% credible intervals) for the comparison of row-defining treatment versus column-defining treatment. Hazard ratios less than 1 and odds ratios more than 1 favour row-defining treatment. Significant results are in bold. Osi=osimertinib; Dac=dacomitinib; Afa=afatinib; Erl=erlotinib; Gef=gefitinib; Ico=icotinib; Cet=cetuximab; Bev=bevacizumab; Gef+P=gefitinib plus pemetrexed; PbCT=pemetrexed based chemotherapy; PfCT=pemetrexed free chemotherapy

