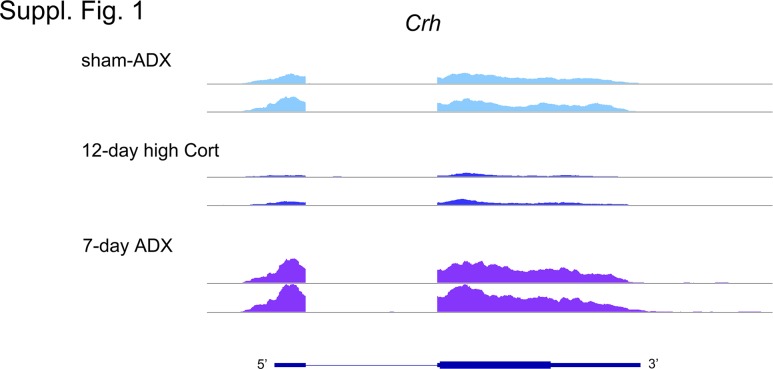
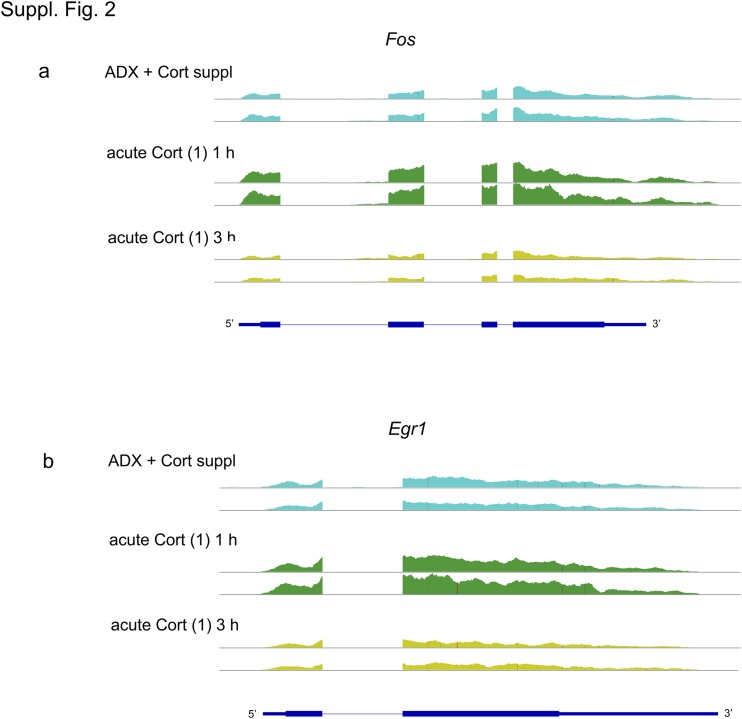
In the above-named article by Itoi K, Motoike I, Liu Y, Clokie S, Iwasaki Y, Uchida K, Sato T, and Aguilera G (Endocrinology. 2019;160(1):38–54; doi: 10.1210/en.2018-00535), the following errors occurred.
In Supplemental Figures 1 and 2, the read counts plotted on the ordinate should have been normalized by the size of the library. However, the graphic data currently presented as Supplemental Figures 1 and 2 had not been normalized. The corrected Supplemental Figures 1 and 2 are shown here.
In the Supplemental Figure 3 legend, line 9, the colors were incorrectly indicated. The sentence should read:
“By utilizing PSORT prediction tool (https://www.genscript.com/wolf-psort.html), proteins expressed in the plasma membrane are colored dark blue, the cytoplasm sky blue, the nucleus dark orchid, the mitochondria gold, the endoplasmic reticulum dark olive green, the peroxisome khaki, extracellular space lavender, and miscellaneous gray.”
In the Supplemental Figure 4 legend, line 7, “the red line” should read “the red dotted line.”
In the Supplemental Figure 6 legend, lines 11 and 12, the sentence shown in parentheses should read “the blue nodes represent decreases compared with the ADX + Cort suppl group.”


