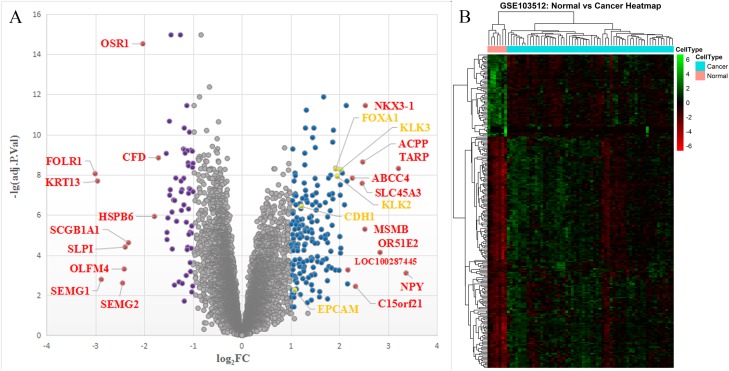
Figure 1. The volcano plot and heatmap of the DEGs.
(A) Volcano plot: The abscissa represents log2FC and the ordinate represents −log10(adjusted P-value). The blue, purple, gray, red, and yellow dots represent significantly upregulated DEGs, significantly downregulated DEGs, insignificant DEGs, top 10 up/downregulated DEGs, and hub genes between PCa and NP tissues, respectively. (B) Cluster heatmap of the DEGs. DEG, differentially expressed gene; FC, fold change; PCa, prostate cancer; NP, normal prostate.

