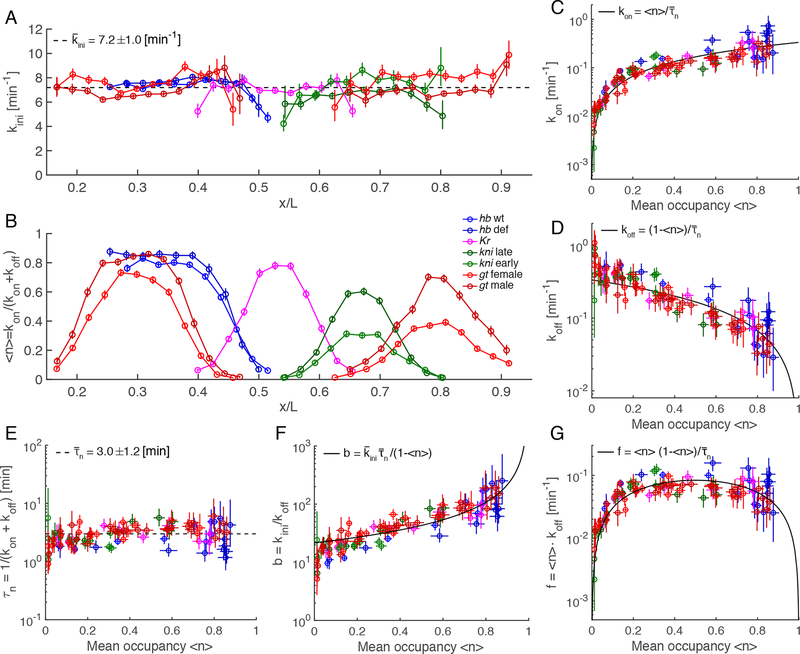
Figure 5: Inferred transcription parameters are tightly constrained across gap genes.
(A,B) Inferred Pol II initiation rate (A), and promoter mean occupancy (B) for all genes across AP position.
(C,D) Inferred on-rate (C) and off-rate (D) as a function of mean occupancy for all genes. Solid black lines represent the global trend using the mean value of (see formula in inset).
(E) Inferred switching correlation time as a function of mean occupancy for all genes with a mean value of min (dashed line).
(F,G) Inferred burst size (F) and burst frequency (G) as a function of the mean occupancy . Solid black lines represent the global trend using the mean value of and (see formula in inset).
Color code as in Figure 1C. Error bars are the 10 to 90th percentiles of the posterior distribution. See also Figure S6.

