

Abstract
Cyclic phenones are chemicals of interest to the USEPA and international organizations due to their potential for endocrine disruption to aquatic and terrestrial species. The metabolic conversion of cyclic phenones by liver hepatocytes and the structure of main metabolites yielded have not been assessed in fish species. As part of a larger project, in this study we investigated the structure of metabolites produced in vitro by rainbow trout (rt) liver slices after exposure to the model cyclic phenones benzophenone (DPK), cyclobutyl phenyl ketone (CBP) and cyclohexyl phenyl ketone (CPK). While only one distinct metabolite was detected for DPK and CBP (benzhydrol and CBPOH, respectively), CPK yielded nine positional isomers (M1-M9) as products. In absence of standards, improved inference of CPK metabolites tentative structures was achieved by combining GC-MS with and without derivatization, LC with tandem MS, LC with high resolution time of flight (TOF) MS and LC fractionation data with CPK phase II conjugative metabolism information. Data supported that CPK is metabolized by phase I oxidation of the cyclohexyl ring and not the phenyl group as predicted by metabolism simulators. CPK metabolites M1 and M2 (MW 186), were proposed to be cyclohexenyl-derivatives. Also, M6-M9 were proposed to be hydroxylated metabolites (MW 204), with the potential for undergoing phase II conjugative metabolism to glucuronides and sulfates. Finally, M3, M4 and M5 were proposed as cyclohexanone-derivatives of CPK (MW 202), resulting from the limited redox-interconversion of their hydroxylated pairs M8, M6 and M7, respectively. Assessment of metabolite role in biological responses associated with endocrine disruption will advance the development of methods for species extrapolation and the understanding of differential sensitivity of species to chemical exposure.
Keywords: Endocrine disruption, Fish, In vitro, Conjugative metabolism, Tentative metabolite structure, Mass spectrometry techniques
1. Introduction
Assessment of chemicals for their potential to disrupt endocrine pathways, including development of methods to facilitate prioritization for further testing, has been mandated by the USEPA [1,2]. Improved toxicity assays have provided evidence of continued interest in the use of aquatic species as models to assess endocrine disrupting chemical effects in ecotoxicology research, but a need to understand the bioaccumulation and biotransformation of suspected endocrine pollutants in aquatic organisms still remains [3–7].
The benefits of applying a suite of fish liver in vitro assays to assess the role of chemical biotransformation in fish estrogenic activity modulation and the potential adverse effects of potential endocrine disruptors such as phenones and other chemical series to vertebrate endocrine systems have been demonstrated by our group [8]. As part of this effort, we have reported the cytosol rainbow trout estrogen receptor (rtER) competitive binding, vitellogenin (Vtg) mRNA induction and distinct metabolic routes for a series of cyclic phenones of interest to the USEPA after liver slice exposure to these chemicals [8,9]. Model cyclic phenones analyzed included benzophenone (DPK), cyclohexyl phenyl ketone (CPK) and cyclobutyl phenyl ketone (CBP). To specifically predict the impact of biotransformation upon the potential toxicity of chemicals it is also necessary to understand the structure and reactive mechanisms of any metabolic products formed. Thus, an additional need for CBP, DPK and CPK assessment was to obtain chemical and structural information for their primary metabolic products in absence of suitable standards for identity validation. The metabolite structural information was required to support conflictive biological responses observed for these chemicals during in vitro exposure assays. To date, only a limited number of studies have addressed the analysis of reactive metabolites of endocrine disruption chemicals in fish species, or the characterization of target metabolites without the use of standards for quantitative and qualitative assessment [4].
The structural analysis of metabolic products and further differentiation of isomers generated during biotransformation reactions continue to be a highly challenging task [10–13]. Historically, various chromatographic and high-throughput analytical methods including gas and liquid chromatography-mass spectrometry (GC-MS and LC-MS) have been used to evaluate metabolite levels and structure in biological samples [14–17]. For example, GC-MS has been widely applied to profile primary metabolism in animal species because it allows evaluation of low MW analytes, separates complex metabolite mixtures with high efficiency, discriminates between isomeric compounds, provides high analysis throughput at relatively low cost, and facilitates compound identification by high reproducibility of fragmentation patterns in electron ionization (EI) mass spectra. Nevertheless, GC-MS lacks rapid annotation of unknown peaks, and is restricted to the analysis of thermally stable volatile analytes or volatile derivatives effectively modified through chemical derivatization methods prior to analysis [18,19]. High throughput analysis and quantification by GC-MS often relies on the speed and efficiency of the derivatization techniques used, as metabolites can show varying affinities for derivatizing agents and/or yield unwanted byproducts. In recent years, LC with tandem MS (MSn) has been widely used as a powerful complementary analytical tool for metabolite profiling and identification in biological matrices, demonstrated by its compatibility with commonly used solvents as well as separation versatility and capacity without a need for analyte derivatization [20,21]. Overall, both GC-MS and LC-MS offer improved algorithms and databases that can be used to acquire and assess biologically relevant information conserved across species.
Metabolite identification and characterization studies have been further facilitated by using time of flight (TOF) mass analyzers, which provide fast scanning rate, high mass resolution, additional sensitivity for improved detection, and mass accuracy analogous to more expensive instruments [22]. However, one limitation is that analytes such as positional isomers cannot be differentiated based on accurate mass alone [12]. In general, although MSn and high resolution techniques have improved structural inference and proposal of unknown metabolites [21], structural confirmation still is primarily obtained with authentic standards and/or Nuclear Magnetic Resonance (NMR) spectroscopy data. For the analysis of unknown parent chemicals and metabolites, supporting information for structural characterization can be obtained with MS/MS experiments, chemical derivatization, application of specialized software (e.g., ACD/MS Fragmenter™, Canada), or in the case of electron ionization, the use of available mass spectral libraries. It is now generally accepted that structural proposals based only on mass spectral data (including high-resolution MS) can be useful to the scientific community for chemical discovery and assessment purposes, provided that some expression of uncertainty is indicated when reporting the structural findings [23]. Furthermore, data from additional analytical and biochemical methods could provide MS-based structural proposals with information needed to support the hypothesized configurations. This guideline is especially valuable for approaches that are routinely limited by low experimental yield, such as fish in vitro metabolism assays.
Until now, the metabolic conversion of cyclic phenones by liver hepatocytes and the structure of main metabolites yielded have not been investigated in fish species. Thus, the current research specifically aimed at inferring the tentative metabolite structures of the rt slice-mediated biotransformation of cyclic phenones accountable for differential biological responses observed in in vitro exposures. To our knowledge, this manuscript constitutes the first report addressing the characterization of the main in vitro fish liver slice metabolites of model cyclic phenones (DPK, CPK and CBP). In absence of putative standards and NMR information for CPK and CBP metabolite identification, we first used GC-MS and LC-MS/MS data to gain insight into the cyclic phenone metabolite structural characteristics. Metabolite characterization relied primarily on both ESI-LC-TOF-MS (for higher mass accuracy measurement), and ESI-LC-MS/MS data because of the extensive application of these tools to the assessment of samples without previous knowledge of chemical composition. For CPK metabolism, MS and chemical derivatization approaches were applied to propose metabolite structures within a scaled level of confidence (Schymanski levels 1–5) [24]. The metabolite tentative structures inferred from MS data were then evaluated and supported with phase II conjugation information obtained for the same metabolites during in vitro exposures of the parent chemicals [9]. Structural and accurate mass information obtained with MS techniques was used to improve understanding of potential adverse reactions for reactive phenone metabolites, refine the main metabolic pathway of CPK with updated mechanistic data, and assess parent chemical and/or metabolite role in rt gene induction responses.
2. Materials and methods
2.1. Chemicals and reagents
All reagents were of the highest purity and grade available and obtained as previously reported [9]. Ammonium acetate and hydroxide (NH4OAc and NH4OH respectively), N,O-bis(trimethylsilyl)-trifluoroacetamide (BSTFA) with 1% trimethyl chlorosilane, N-methyl-trimethylsilyl trifluoroacetamide (MSTFA) and all other chemicals were procured from Sigma/Aldrich (St. Louis, MO, USA). Chemical names, acronyms, structures, molecular formula, physical-chemical properties and analytical parameters of parent cyclic phenones and metabolites available for identification studies are presented in Table 1 and their analyses in Supplemental Figures 1–3. Standards for characterization and validation of CPK and CBP slice-mediated metabolites were not commercially available.
Table 1.
Standards available for identification and their characteristic physical and analytical parameters.
| Chemical | Structure | Molecular formula | CAS Number | MW g/mol | Boiling point °C | log Kowa | GC-MS | LC-MS | |||||
|---|---|---|---|---|---|---|---|---|---|---|---|---|---|
| tR min | r12b | Mol. ion m/z | Base ion m/z | Other ions m/z | r12b | [M+H]+m/z | |||||||
| Parent | |||||||||||||
| CBP: Cyclobutylphenyl ketone |  |
C11H12O | 5407-98-7 | 160.2 | 261 | 2.96 | 11 | 0.820 | 160 | 105 | 77 | 0.765 | 161.096 |
| DPK: Diphenyl ketone (Benzophenone) |  |
C13H10O | 119-61-9 | 182.2 | 305 | 3.15 | 14 | 1.020 | 182 | 105 | 77/51 | 0.836 | 183.080 |
| CPK: Cyclohexyl phenyl ketone | 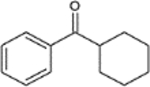 |
C13H16O | 712-50-5 | 188.3 | 287 | 3.94 | 14 | 1.000 | 188 | 105 | 77/133 | 1.000 | 189.127 |
| Metabolites | |||||||||||||
| BADPK: Diphenyl methanol (Benzhydrol) |  |
C13H12O | 91-01-0 | 184.2 | 312 | 2.71 | 14 | 1.041 | 184 | 107 | 79 | 0.778 | 185.096 |
| CPKOH:Cyclohexyl phenyl methanol |  |
C13H18O | 945-49-3 | 190.3 | 300 | 3.76 | 14 | 1.001 | 190 | 107 | 79 | 0.975 | 191.143 |
log Kow denotes octanol/water partitioning coefficient obtained from Sci Finder (ACD Lab) or Suite v4.11(USEPA)
r12 denotes relative retention defined as a ratio of retention times tR/tRCPK
2.2. Fish
Immature rainbow trout (Oncorhynchus mykiss, 500–1000 g, Erwin strain) were obtained from the United States Geological Survey (USGS) Upper Midwest Environmental Science Center (LaCrosse, WI) and treated as previously described [8].
2.3. Metabolite preparation for identification studies
To prepare minimum amounts of metabolites needed for structural assessment analyses, slices from rt livers were exposed to DPK, CPK and CBP at concentrations of 300 μM (chemical in ethanol) for 6 (DPK and CBP) or 48 h (CPK) in media at 11°C in a multi-well plate system. Exposure incubations and slice viability experiments were performed as previously reported [7,8]. After incubations, media containing a mixture of parent compounds and formed metabolites were pooled and extracted with hexane [9]. For GC-MS analyses, 1.5 mL of hexane was added to 1.5 mL of exposure media, the mixture was vortexed (30 sec), and centrifuged @14000 X g for 18 min. Despite efforts to increase the metabolite yield, the intrinsic experimental limitations of single slice incubations hindered the recovery of adequate amounts of CPK products for NMR experiments.
2.4. Characterization of parent chemicals and metabolites formed by trout liver slices
The overall analytical approach employed in this study is shown in Figure 1. Hexane extracts of control samples and exposure media containing the test metabolites were either analyzed directly via GC-MS, or dried at room temperature under a gentle stream of nitrogen and re-dissolved in appropriate mobile phase for analyses by LC-MS/MS and LC-TOF-MS. Dried CPK metabolite samples were also analyzed by GC-MS following derivatization with BSTFA or MSTFA as previously described [25]. Additional analyses of CPK metabolites by LC-MS/MS, LC-TOF-MS and GC-MS with BSTFA derivatization were performed after LC fractionations to specifically evaluate the formation of CPK hydroxylated metabolites. Structural data for main metabolites from all parent chemicals was further compared to conjugative metabolism results previously obtained for incubation of the same chemicals with liver slices [9]. Specifically, we assessed the formation of O-glucuronide and O-sulfate derivatives after enzymatic hydrolysis with β-Glucuronidase and Sulfatase for all metabolites detected, corresponding to the conjugation of alcohols and other hydroxylated aglycones. The rationale applied was that only metabolites hydroxylated as part of phase I metabolism in slices could undergo phase II metabolism to produce measurable amounts of O-conjugates. This strategy allowed differentiation of hydroxylated from non-hydroxylated moieties for CBP, CPK and DPK metabolites, including the recognition of hydroxylated structures showing potential steric hindrance for conjugative metabolism (i.e., limited or undetected glucuronide or sulfate conjugates formation).
Figure 1.

Approach to characterization of main rainbow trout liver slice metabolites of cyclic phenones.
*Identified with Stds by both GC- and LC-MS; no derivatization
¥Identified by GC-MS data only; no derivatization
2.5. GC-MS and LC-MS analyses
For GC-MS studies, two Agilent 6890N gas chromatographs connected to an Agilent 5975 Inert XL mass selective detector (Agilent Technologies, Santa Clara, CA, USA) at University of North Dakota (UND) and USEPA were used to independently confirm metabolite MS results. The analytical conditions used for both systems were similar and are displayed in Table 2. LC-MS/MS analyses were carried out on an Agilent 1200 series binary HPLC system coupled with an Agilent 6410 model triple quadrupole mass spectrometer equipped with an ESI source. All LC-TOF-MS determinations were carried out using ESI with a G1969A system coupled to a LC 1100 HPLC (Agilent). While LC-MS/MS allowed for the investigation of metabolite structural features, LC-TOF-MS provided higher resolution and more accurate molecular mass determination needed to support proposed metabolite structures. The detailed experimental conditions are also provided in Table 2. The LC fractions of CPK metabolites were obtained using the same separation conditions as those shown in Table 2 for LC-TOF-MS. Two fractions were collected at time intervals 6.0–10.4 min (1st fraction), and 10.4–14.5 min (2nd fraction).
Table 2.
Experimental analytical conditions used for GC-MS and LC-MS analyses at USEPA and University of North Dakota (UND)
| GC-MS system 1 | GC-MS system 2 | LC-MS/MS USEPA | LC-ToF-MS UND |
|---|---|---|---|
| Column: HP-5MS, 5% phenyl–95% methyl- polysiloxane, 30 m, 0.25 mm I.D., 0.25 μm | Column: DB5-MS, 5% phenyl–95% methyl-polysiloxane, 25 m, 0.25mm I.D., 0.25 μm | Column: Agilent SB-RP C18, 2.1 × 50 mm I.D., 1.8 μm | |
| Carrier: He 1.2 mL/min | Carrier: He 1.2 mL/min | Mobile phase A: 2% MeOH, 2% EtOH, 2.5 mM NH4OAc in water | |
| Pulsed splitless injection 25 psi for 0.6 min, 1.0 μl; Tinjector 280°C | Pulsed splitless injection 25 psi, 0.45 min, 1.0 μL; Tinjector 250 °C | B: 2% EtOH, 96% MeOH, 2.5mM NH4OAc in water; 0–1.25 min 35% B; 13.5–18.0 min 65% B; 18.0–18.25 min 35% B | |
| Oven: 40 °C/1 min; 10 °C/min to 200 °C; 20 °C/min to 310
°C and 9 min hold. Ttransfer line = 280 °C MS: EI and CI; 50–500 m/z |
Oven: 40 °C/1 min; 10 °C/min; 280 °C; 20 °C/min to 310
°C and 9 min hold. Ttransfer line = 280 °C MS: EI 50–500 m/z |
Flow rate: 0.25 mL/min | |
| ESI: capillary, tube lens, cone, and extractor at 3100, 0.1, 65 and 3.8 V, respectively; capillary temperature 325 °C. N2 sheath 30 psi, N2 auxiliary 10 psi. | ESI: capillary 4000 V; fragmentor 135 −250 V, 300 °C; N2 nebulizing 25 psi, N2 drying 12L/min; mass range: 50–500 m/z | ||
| CID at 30 eV (N2) with 0.1 scan for transition and mass range for products: 50–500 m/z. Transition dwell times: 8 and 4 and 2 ms for qualifier ion and internal Std, respectively. |
2.6. Data analysis
For GC-MS studies, enhanced MSD ChemStation for Windows (Rev E.02, Agilent Technologies, Santa Clara, CA, USA) was used for data acquisition and analysis. When possible, GC-MS identification results were supported or validated by comparison to National Institute of Standards Mass Spectral Library (NIST). For LC-MS experiments, data were acquired and evaluated with Mass Hunter (MH) Workstation software. The data were processed for LC-MS/MS and LC-TOF-MS using MH Quantitative Analysis, version B.01.03; Build 1.3.111 QQQ. In each experiment, at least 2 sample replicates were analyzed in duplicate by MS/MS. Structural inference of target analytes was supported by ion extraction from TIC at measured accurate mass for each compound. Accurate mass for parent compounds and metabolites was measured by LC-TOF-MS with better than 5 ppm mass accuracy error. Finally, CPK metabolites structural proposals that were based on high resolution-MS data and supported by conjugative metabolism findings were assigned a confidence level of 3 based on the Schymanski scale [24], representing tentative candidates whose possible structures can be proposed, but lack sufficient information to assign an exact structure.
3. Results and discussion
GC-EI-MS analyses of incubation media hexane extracts showed that only one main metabolite was produced from DPK and CBP. For both of these metabolites, a redox conversion of the phenone to the alcohol form was the most likely metabolic route yielding the primary metabolite in slice cytosol (BADPK and CBPOH, respectively). This pathway is consistent with the action of ketone reductases normally present in cytosol preparations [9]. While the conversion of DPK into benzhydrol (BADPK) was confirmed with a standard (Table 1 and Supplemental Figure 3), the metabolite CBPOH was tentatively identified by GC-MS by comparison of CBP and CBPOH molecular and base peak ions of m/z 160/105 and 162/107 respectively, and earlier elution time due to higher volatility (Supplemental Figure 4). No library spectrum match was found for CPBOH. In contrast, CPK yielded several different unknown metabolites, but no measurable amounts of the hypothesized metabolites CPKOH (alcohol) or the reactive phenyl-hydroxylated metabolite opOHCPK as confirmed with available standards [9].
We sought to deduce the structure of the unknown metabolites of CPK (positional isomers labeled M1-M9 in Figure 2 and Table 3) from MS data. We also intended to support the findings with conjugative metabolism information obtained from additional slice exposure studies. Initially, we chose to investigate the structure of phenone metabolites by GC-MS followed by LC-MS/MS analyses using retention times (tR) and characteristic product ions. Further structural assessment of CPK metabolites was performed using GC-MS with chemical derivatization, LC-MS/MS and accurate mass measurement (see Cyclohexanol-phenyl ketones section). Surprisingly, results indicated that CPK is metabolized in rt slices by phase I oxidation of the cyclohexyl ring and not the phenyl group, a significant discrepancy from current metabolism prediction models [26,27]. This finding increased the importance of seeking cyclohexyl-modified metabolite structural information that could lead to a better understanding of the potential reactivity of the CPK metabolic products and their actual role in regulatory pathways.
Figure 2.

GC-EI-MS total ion chromatogram (TIC) of CPK and main metabolites, and their proposed structures.
* Unknown distinct unsaturation position
Table 3.
Identification of CPK metabolites based on GC-MS, chemical derivatization and LC-ToF-MS data
| GC-MS | GC-MS & BSTFA | LC-ToF-MS | mass error, ppm | ||||||||||||||
|---|---|---|---|---|---|---|---|---|---|---|---|---|---|---|---|---|---|
| Label | Structure | Molecular formula | CAS Number | Derivatives of phenyl ketones | MW g/mol | *log Kow | tR, min | tR/tRCPK | EI Ions m/z | CI Ions m/z | tR, min | Mol.ion | Ions m/z | tR, min | [M+H]+ m/z | ||
| CPK |  |
C13H16O | 712-50-5 | cyclohexyl - | 188.22 | 3.94 | 15.68 | 1.000 | 188/105/77 | not derivatized | 19.3 | ||||||
| M1 |  |
C13H14O | 29373-01-1 | cyclohexenyl - | 186.24966 | 3.02 | ± 0.25 | 15.814 | 1.009 | 186/105/55 | 187/105 | not derivatized | ND | ||||
| M2 |  |
C13H14O | 17040-65-2 | cyclohexenyl - | 186.24966 | 3.382 | ± 0.29 | 16.343 | 1.042 | 186/105/55 | 187/105 | not derivatized | ND | ||||
| M3 |  |
C13H14O2 | 1046191-22-3 | cyclohexenone- | 202.24906 | 1.78 | ± 0.31 | 18.022 | 1.149 | 202/105/77 | 203/187/105 | not derivatized | 4.78 | 203.1069 | 1.2 | ||
| M4 |  |
C13H14O2 | 200624-56-2 | cyclohexenone- | 202.24906 | 1.91 | ± 0.31 | 18.062 | 1.152 | 202/105/77 | 203/187/105 | not derivatized | 7.94 | 203.1053 | −6.7 | ||
| M5 |  |
C13H14O2 | 908592-00-7 | cyclohexenone- | 202.24906 | 1.997 | ± 0.32 | 18.161 | 1.158 | 202/105/77 | 203/187/105 | not derivatized | 7.08 | 203.1058 | −4.2 | ||
| M6 |  |
C13H16O2 | 1114462-94-0 | cyclohexanol - | 204.26 | 2.16 | ± 0.24 | 18.119 | 1.156 | 186/105/77 | 16.858 | 276 | 261/186/105/129/73 | 8.42 | 205.1214 | −4.4 | |
| M7 | 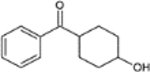 |
C13H16O2 | 58753-01-8 | cyclohexanol - | 204.26 | 2.01 | ± 0.23 | 18.161 | 1.158 | 186/105/77 | 17.167 | 276 | 261/186/105/129/73 | 9.12 | 205.1216 | −3.4 | |
| M8 |  |
C13H16O2 | 224426-74-8 | cyclohexanol - | 204.26 | 1.96 | ± 0.23 | 18.226 | 1.162 | 186/105/77 | 17.353 | 276 | 261/186/105/129/73 | 7.59 | 205.1215 | −3.9 | |
| M9 |  |
C13H16O2 | 947–19-3 | cyclohexanol - | 204.26 | 2.18 | ± 0.28 | 18.397 | 1.173 | 186/105/77 | not derivatized due to steric hydratance | 10.3 | 205.1213 | −4.9 | |||
log Kow values obtained trom Sci Finder (ACD lab software) Unknown unsaturation position for M1 and M2
3.1. Cyclohexenyl-phenyl ketones
The first two metabolites M1 and M2 (Figure 2) corresponded to phenyl ketones providing weak molecular ions at m/z 186 with EI and a solid molecular ion m/z 187 when chemical ionization (GC-CI-MS) was used (Supplemental Figures 5a and 5b). Main fragments in EI-MS were ions at m/z 105 (acylium ion), 77 and 51 with the fragmentation for M1 and M2 (m/z 187→105; alpha cleavage of cyclohexene) suggesting the formation of a more volatile, early-eluting cluster of CPK metabolites (tR of 15.8 and 16.3 min, respectively). The lack of conjugative metabolism reported for M1 and M2 [9], together with the absence of their ions in LC-MS analyses and unchanged retention time after trimethylsilylation, further supported the reduced polarity of these compounds and strongly suggested the absence of a hydroxyl group available for derivatization or phase II conjugation. Combined MS and metabolism results supported the proposal of M1 and M2 as cyclohexenyl-derivatives of CPK with monoisotopic mass of 186, but determination of the distinct unsaturation position of each isomer (Table 3) was not possible from MS or conjugative data.
3.2. Cyclohexanone-phenyl ketones
CPK metabolites M3, M4 and M5 followed a similar fragmentation pattern to M1 and M2 showing common ions at m/z 105, but also weak molecular ions at m/z 202 and pronounced fragments at m/z 186 following GC-EI-MS analyses. However, clustered elution at later tR (18.02, 18.06, and 18.16 min, respectively) suggested the formation of less volatile and potentially more hydrophilic molecules (Figure 2), consistent with molecules containing multiple ketone groups. Structural assignment of M3-M5 was supported by a similar fragmentation profile to cyclohexenyl-phenyl ketones (Supplemental Fig. 6), with a loss of a cyclohexene or cyclohexanone moiety (alpha-cleavage) together with a protonated molecular ion of m/z 203 observed after chemical ionization. Like M1 and M2, no changes in retention times were observed for M3, M4 or M5 following chemical derivatization, thus excluding the presence of hydroxylated groups. This observation was also consistent with the absence of conjugative metabolism for M3-M5 during slice exposures [9]. Further LC-MS and LC-TOF-MS analyses showed three peaks with characteristic ion of m/z 203.106 (Table 3, Supplemental Figure 7 and Figure 3b), and mass accuracy error less than 10 ppm even for the lower abundance M3 and M4 metabolites. Thus, metabolites M3-M5 were proposed as cyclohexanone-derivatives of CPK (Table 3). The LC-MS/MS studies allowed for the interpretation of the product ion spectra of protonated molecular ions of m/z 203 (tentative metabolite structures are shown in Figures 4a–c). Specifically, the product ion of m/z 185 obtained due to loss of H2O was insignificant for M3, and more pronounced for M4, suggesting M3 to be a cyclohexanone with a meta (3-) substitution. The metabolite M4 was the only one showing a significant ion at m/z 186, most likely corresponding to an ortho (2-) ketone substitution, thus leaving the most abundant of the three isomers, M5, with a ketone group in para (4-) position of the cyclohexyl ring. Specifically, M3-M5 lack both glucuronide and sulfation conjugation potential due to the presence of a C=O functional group at the cyclohexyl ring. CPK metabolites M3-M5 have been proposed as redox products of their corresponding hydroxylated isomers [9].
Figure 3.

LC-ToF-MS extracted ion chromatograms (EIC) of CPK metabolites: a) EIC of m/z 187.11 (M6-M9); b) EIC of m/z 203.11 (M3-M5)
Figure 4a.

LC-MS/MS product ion mass spectra of [M+H+] of m/z 203 and proposed fragmentation pathway for a) M3, b) M4 and c) M5 metabolites.
Figure 4c.

LC-MS/MS product ion mass spectra of [M+H+] of m/z 203 and proposed fragmentation pathway for a) M3, b) M4 and c) M5 metabolites.
3.3. Cyclohexanol-phenyl ketones
The structure of the last group of CPK metabolites (M6-M9) was the most challenging to infer (Figure 2). While GC-MS data showed m/z 186 as the most abundant ion for M6-M9, trimethysilylation with BSTFA showed three products with molecular ions of m/z 276 and abundant ion at m/z 261 after loss of a methyl group (−15; Figure 5). This observation suggested that the MW of the underivatized species was 204 (hydroxylated metabolite), and the formation of ion at m/z 186 was just the result of water loss. Metabolite derivatization findings with BSTFA were confirmed with additional MSTFA experiments (data not shown). A pronounced ion was also observed at m/z 187 in LC-MS analyses of M6-M9 (Supplemental Figure 7 and Figures 6–7). However, closer inspection and comparison to LC-TOF-MS higher mass accuracy analyses recorded with different fragmentor voltages affecting collision induced dissociation (Supplemental Figures 8a,b and 9a,b), revealed significant ions of m/z 205 formed at lower voltages, and increase in abundance for the m/z 187 ion with corresponding m/z 205 fragmentation at higher voltages. The possible formation of ammonia adducts (also m/z 205), was excluded based on mass accuracy error of 100 ppm. In contrast, loss of a water moiety resulting in the formation of the stable ion at m/z 187 was supported with a mass accuracy error of 10 ppm. Other main ions observed for M6-M9 during electrospray (ESI) and EI experiments corresponded to both an alkylbenzene fragmentation m/z 204 →105 (−99; loss of cyclohexene moiety), and m/z 105 →77 (−28; loss of CO). Based on this information, M6-M9 were proposed as cyclohexanol-derivatives of CPK (i.e., hydroxycyclohexyl-phenyl ketones; tentative proposed structures are shown in Table 3). Mass-spectrometric structural assignments were further supported with CPK biotransformation studies showing differential conjugative metabolism for M6-M8 followed by redox conversion into their corresponding cyclohexanone-phenyl ketones pairs (Cyclohexanone-phenyl ketones section).
Figure 5.

Direct GC-MS analysis of CPK metabolites with and without BSTFA derivatization a) TIC chromatograms; b) representative mass spectrum of derivatized metabolites (M6-M8)
Figure 6.

LC-MS/MS data and proposed fragmentation pattern for CPK Metabolites M7 and M8
Figure 7.

LC-MS/MS data and proposed fragmentation pattern for CPK Metabolites M6 and M9
To align LC and GC data and find correlations between metabolite peaks, we collected two LC fractions (Figure 3), and analyzed the samples by GC-MS following trimethylsilylation. Only one of the suspected hydroxylated metabolites M6-M9 was found in fraction 1. Assessment of BSTFA-GC-MS retention times and MS data (Figures 5–6 and Supplemental Figure 10), suggested that this metabolite was M8. Two other derivatized peaks were observed in fraction 2 and were assigned to M6 and M7. The hydroxylation of M9 was supported by mass accuracy data, but this metabolite did not derivatize with BSTFA, conjugated to any significant extent in exposed slices, or redox converted to a di-ketone in presence of oxidoreductases. Potential explanations include steric hindrance effects or very low M9 yield in exposure samples [9].
As expected, combined GC-MS and accurate mass data supported molecular weight formula assignments for CPK hydroxylated isomers, but did not allow definite determination of the positional substitution pattern. We assessed metabolite hydroxylation with MS data understanding that any insight obtained would be beneficial to our metabolic modeling and species extrapolation research, but also acknowledging a level of confidence that only allowed tentative structural assignments. However, we were also confident that metabolite structural elucidation uncertainty could be reduced with conjugative and derivatization supporting data. For example, because results showed similar LC-TOF-MS ion profiles for the metabolite pairs M7/M8 and M6/M9 (Supplemental Figure 10), LC-MS/MS information was used first for additional structural assessment of each pair. Specifically, product ion mass spectra showed that M7 and M8 produced the same ions, with M7 generating weaker m/z 169, 141 and 91 ions (Figure 6). Similar finding was obtained for LC-TOF-MS data shown in Supplemental Figure 8. To distinguish between M7 and M8 from MS data, we used metabolite fractionation and yield of conjugative metabolism information to establish a basis for differentiation. Initially, the separation of M8 and M7 in two different LC fractions (1 and 2, respectively; Figure 3) supported the presence of isomers with different polarity that correlated well to GC-MS results. Also, prior to any structural assessment, we had reported a higher glucuronidation and sulfation yield for the metabolite M7 than for M8 in rt slices [9]. A potential explanation lies within the efficiency of group transfer between the corresponding phase II enzyme and the hydroxylated isomer position during conjugative metabolism. It is reasonable to assume that within comparable enzymatic substrate specificity, the bulkiness of the transfer group will be an influential factor for conjugate yield. It is well known that steric hindrance could prevent the optimal attachment of bulky groups like glucuronic acid- (from UDP-glucuronic acid) and sulfo group- (from PAPS) during conjugation reactions and affect metabolite stability and rate of formation [9]. Theoretically, competition of the 4-OH and 3-OH-isomer positions for phase II conjugation will depend on various factors most notably, position equivalency (3-OH and 2-OH show two equivalent sites), and position accessibility (4-OH will most likely offer the lowest hindrance for group transfer). A third factor is the metabolite’s compatibility with the enzyme’s site (i.e. metabolite structure stabilization for group transfer), which varies depending upon the substrate specificity of the protein/receptor. The observation that conjugation of M7 is favored over M8 in rt slice suggests that group transfer to this metabolite is facilitated by a less restrictive hydroxylated position or that there are more positions available for conjugation. It is expected that a position showing lower resistance to group transfer within the same isomer family would consistently increase metabolite conjugation yield in the slice and corresponding transfer to media. Furthermore, metabolism data showed that the rates of glucuronosyl transferases appear higher for M7 than for M8 in rt slices. The 3-OH position offers 2 equivalent sites, but probably more steric hindrance and cumbersome configuration for stabilization in the enzyme site as well. Although hydroxylation of CPK occurs strictly on the rotating cyclohexyl moiety, the preferred in silico and experimental glucuronidation of the 4-OH-phenyl as compared to the 3-OH-phenyl position of Quercertin has been reported [28]. It is reasonable to presume that the hydroxylated 4- and 3- cyclohexyl positions in CPK may follow a similar glucuronidation mechanism. Furthermore, we have reported the preferential binding of a series of 4-OH phenyl-cyclic phenones to the rt estrogen receptor in vitro driven by a more stable hydrogen bonding of the 4-OH to the active site [8]. Given the wide specificity of both phase II conjugation enzymes and the estrogen receptor in fish, it is also reasonable to assume a preferential attachment of the 4-OH metabolite to the group transfer site in enzymes like glucuronosyl transferase. In contrast, the M8 product ion similarity to M7, and M8 lower conjugation yield suggest proximity of the M8-hydroxyl to the M7-hydroxyl group, and enhanced limitations to group transfer even in the presence of equivalent conjugation sites. We suspect that structural conformation limitations and less-favored interaction with the enzymes play a more significant role for M8. Therefore, we hypothesized that M7 and M8 correspond to the 4-OH and 3-OH CPK isomers, respectively. Findings previously discussed for cyclohexanone-phenyl ketones, correlate well with M5 (4-C=O) and M3 (3-C=O) as the redox conversion pairs for M7 and M8, respectively.
Finally, Figure 7 shows similar mass spectra for M6 and M9, but less product ion formation than for M7 and M8. In this case, the higher abundance of M6 (100:1) in both GC- and LC-MS analyses, combined with the confirmed lack of derivatization/redox conversion shown by M9 and the marginal phase II conjugation of M9 (< 0.5nmole/well by 24 h; [9]), strongly supported the tentative positional assignment of M6 and M9 as the 2-OH and 1-OH substituted metabolites of CPK, respectively. The much higher abundance observed for M6 could be interpreted as the result of minimal position competition for conjugation, and as to all the factors stated above favoring M6 conjugation (position equivalence, accessibility and interaction with enzyme site). It is likely that the 1-OH position would be more constrained and therefore less available and stable, thus hindering its conjugation pathway. A summary of the tentative substitution assignments proposed for CPK metabolites in absence of standards is displayed in Figure 2.
4. Conclusions
Complementary information obtained with chromatography-mass spectrometry and chemical derivatization techniques, aided by fish in vitro conjugative metabolism data for the same chemicals was used to infer the tentative structure of main metabolites formed after in vitro exposure of rt liver slices to potential endocrine disruptors (cyclic phenones) in absence of standards and other tools for identity confirmation. Results indicated that the alcohol form is the predominant stable metabolite produced by both DPK (benzhydrol) and CBP (CBPOH) in slice cytosol, and that CPK is converted in the slice to multiple potentially reactive positional isomers. Combination of LC-MS/MS, accurate mass measurement and conjugative metabolism information allowed the proposal of a tentative substitution pattern for CPK metabolites. The inferred metabolite structures were consistent with conjugative metabolism findings reported by our group. Overall, it was proposed that CPK biotransforms in vitro into nine metabolites structurally consistent with cyclohexenyl (2)-, cyclohexanone (3)- and cyclohexanol (4)-derivatives. Specific unsaturation position determination was not possible for cyclohexenyl-metabolites. Metabolism data for CPK supported the conjugation potential of M6-M8 (hydroxylated derivatives) and the formation of cyclohexanone-derivatives M3, M4 and M5 as the result of redox interconversion of the hydroxylated metabolites M8, M7 and M6, respectively. A key contribution of this research was the indication that CPK is metabolized by phase I oxidation of the cyclohexyl ring and not the phenyl group as would be expected. This finding differs significantly from predictions obtained from metabolism simulators and other pathway models used by both industry and government to advance understanding of regulatory mechanisms and develop appropriate risk assessment models. Validation of metabolism models with newly acquired mechanistic data constitutes a critical task in human and ecotoxicology research for years to come. We conclude that further work is necessary to overcome limitations presented by identification of metabolites produced at detection limits levels in absence of structural validation tools. Ultimately, parent chemical and metabolite structural information reported in this manuscript was used to gain insight into the main biotransformation pathways of cyclic phenones, assess parent chemical and/or metabolite role in fish gene induction responses, help populate the knowledge base MetaPath with validated and updated metabolism mechanistic data, provide basis for species sensitivity comparison to chemical series, and advance non-animal testing strategies for ecological risk assessment.
Supplementary Material
Figure 4b.

LC-MS/MS product ion mass spectra of [M+H+] of m/z 203 and proposed fragmentation pathway for a) M3, b) M4 and c) M5 metabolites.
Acknowledgments
The authors thank Dr. John Kenneke, USEPA-NERL, and Dr. William Fisher, USEPA-NHEERL for the thorough review of this paper, and Jessica Voelker for technical assistance. This research did not receive any specific grant from funding agencies in the commercial or not-for-profit sectors.
Abbreviations:
- DPK
benzophenone
- CBP
cyclobutyl phenyl ketone
- CPK
cyclohexyl phenyl ketone
- rt
Rainbow trout
- ER
estrogen receptor
Footnotes
Declaration of Interest
All studies reported in this manuscript were supported by the USEPA, Office of Research and Development (ORD) and conducted by or under the supervision of USEPA employees in additional non-financial collaboration with the University of North Dakota. Manuscript review was performed in accordance with guidelines of the USEPA-ORD. Mention of trade names or commercial products does not constitute endorsement or recommendation for use. Ideas discussed in the text are those of the authors and not necessarily the opinion of the USEPA. The authors report no conflict of interest.
References
- [1].Ankley G, Schmieder P., Serrano J, et al. Adverse outcomes pathways: a conceptual framework to support ecotoxicology research and risk assessment. Environ. Toxicol. Chem, 2010, 29:730–741. [DOI] [PubMed] [Google Scholar]
- [2].Hornung M, Tapper M, Denny J, et al. Effects-based chemical category approach for prioritization of low affinity estrogenic chemicals. SAR QSAR Environ. Res, 2014, 25:132–154. [DOI] [PubMed] [Google Scholar]
- [3].Ankley G, Feifarek D, Blackwell B, et al. Re-evaluating the significance of estrone as an environmental estrogen. Environ. Sci. Technol, 2017, 51:4705–4713. [DOI] [PMC free article] [PubMed] [Google Scholar]
- [4].Hu G, Siu S, Li S, et al. Metabolism of calycosin, an isoflavone from Astragali Radix, in zebrafish larvae. Xenobiotica, 2012, 42(3):294–303. [DOI] [PubMed] [Google Scholar]
- [5].Salinas K, Serrano J, Higgins L, et al. Identification of estrogen-responsive vitelline envelope protein fragments from Rainbow trout plasma using Mass Spectrometry. Mol. Reprod. Dev, 2010, 77(11):963–969. [DOI] [PubMed] [Google Scholar]
- [6].Serrano J, Higgins L, Witthuhn B, et al. (2010). In vivo assessment and potential diagnosis of xenobiotics that perturb the thyroid pathway: proteomic analysis of xenopus laevis brain tissue following exposure to model T4 inhibitors. Comp. Biochem. Physiol, 2010, 5:138–150. [DOI] [PubMed] [Google Scholar]
- [7].Tapper M, Serrano J, Schmieder P, et al. Metabolism of diazinon in rainbow trout slices. App. in Vitro Toxicol, 2018, 4(1):13–18. [DOI] [PMC free article] [PubMed] [Google Scholar]
- [8].Tapper M, Denny J, Serrano J, et al. Phenone, hydroxybenzophenone and branched phenone ER binding and vitellogenin agonism in rainbow trout in vitro models. App. In Vitro Toxicol, 2019, 5(1):62–67. [Google Scholar]
- [9].Serrano J, Tapper M, Kolanczyk R, et al. Metabolism of cyclic phenones in rainbow trout in vitro assays, Xenobiotica, 2019, [DOI] [PMC free article] [PubMed] [Google Scholar]
- [10].Feng Y, Chen B, Yu Q, et al. Identification of double bond position isomers in unsaturated lipids by m-CPBA epoxidation and MS fragmentation. Anal. Chem, 2019, 91:1791–1795. [DOI] [PMC free article] [PubMed] [Google Scholar]
- [11].Goncalves A, Ducatti D, Grindley T, et al. ESI-MS differential fragmentation of positional isomers of sulfated oligosaccharides. J. Am. Soc. Mass Spectrom, 2010, 21:1404–1416. [DOI] [PubMed] [Google Scholar]
- [12].Tyrkko E, Pelander A, Ojanpera I Differentiation of structural isomers in a target drug database by LC/Q-TOF-MS using fragmentation prediction. Drug Test Analysis, 2010, 2:259–270. [DOI] [PubMed] [Google Scholar]
- [13].Yoshitsugu H, Fukuhara T, Ishibashi M, et al. Key fragments for identification of positional isomer pair in glucuronides from the hydroxylated metabolites of RT-3003 (Vintoperol) by LC/ESI/MS. J. Mass Spectrom, 1999, 34:1063–1068. [DOI] [PubMed] [Google Scholar]
- [14].Kamel A, Colliza K, Gunduz M, et al. (2012). In vitro-in vivo correlation for intrinsic clearance for CP-409,092 and sumatript: a case study to predict the in vivo clearance for compounds metabolized by monoamine oxidases. Xenobiotica, 2012, 42(4):355–362. [DOI] [PubMed] [Google Scholar]
- [15].Schultz-Utermoehl T, Sarda S, Foster J, et al. Evaluation of the pharmacokinetics, biotransformation and hepatic transporter effects of troglitazone in mice with humanized livers. Xenobiotica, 2012, 42(6):503–517. [DOI] [PubMed] [Google Scholar]
- [16].Villas-Bôas S, Delicado D, Akeson M, et al. Simultaneous analysis of amino and non-amino organic acids as methyl chloroformate derivatives using gas chromatography-mass spectrometry. Anal. Biochem, 2003, 322:134–138. [DOI] [PubMed] [Google Scholar]
- [17].Villas-Bôas S, Smart K, Sivakumaran S, et al. Alkylation or silylation for analysis of amino and non-amino organic acids by GC-MS. Metabolites, 2011, 1(1):3–20. [DOI] [PMC free article] [PubMed] [Google Scholar]
- [18].Fiehn O Extending the breadth of metabolite profiling by gas chromatography coupled to mass spectrometry. Trends Anal. Chem, 2008, 27(3):132–145. [DOI] [PMC free article] [PubMed] [Google Scholar]
- [19].Garcia D, Baidoo E, Benke P, et al. Separation and mass spectrometry in microbial metabolomics. Curr. Opin. Microbiol, 2008, 11:233–239. [DOI] [PubMed] [Google Scholar]
- [20].Coulier L, Bass R, Jespersen S, et al. Simultaneous quantitative analysis of metabolites using ion-pair liquid chromatography electrospray ionization mass spectrometry. Anal. Chem, 2006, 78: 6573–6582. [DOI] [PubMed] [Google Scholar]
- [21].Mei L, Wang Y, Li J, et al. Comprehensive metabolism study of polydatin in rat plasma and urine using ultra high-performance liquid chromatography coupled with high resolution mass spectrometry. J. Chromatogr. B, 2019, 1117: 22–35. [DOI] [PubMed] [Google Scholar]
- [22].Ferrer I, Thurman E. Liquid chromatography-Time of Flight Mass Spectrometry: principles, tools and applications for accurate mass analysis. New York, NJ: Wiley, 2009. [Google Scholar]
- [23].Liu Y, D’Agostino L, Qu G, et al. High-resolution mass spectrometry (HRMS) methods for nontarget discovery and characterization of PFASs in environmental and human samples. Trends Anal. Chem, 2019, In Press. [Google Scholar]
- [24].Schymanski E, Jeon J, Gulde R, et al. Identifying small molecules via high resolution mass spectrometry: communicating confidence. Environ. Sci. Technol, 2014, 48: 2097–2098. [DOI] [PubMed] [Google Scholar]
- [25].Segura J, Ventura R, Jurado C. Derivatization procedures for gas chromatography-mass spectrometric determination of xenobiotics in biological samples, with special attention to drugs of abuse and doping agents. J. Chromatogr. B, 1998, 713:61–90. [DOI] [PubMed] [Google Scholar]
- [26].Kolanczyk R, Schmieder P, Jones W, et al. MetaPath: an electronic knowledge base for collating, exchanging and analyzing case studies of xenobiotic metabolism. Reg. Toxicol. Pharmacol, 2012, 63:84–96. [DOI] [PubMed] [Google Scholar]
- [27].Kolanczyk R, Serrano J, Tapper M, et al. Comparison of pesticide metabolic pathways across 3 species. Reg. Toxicol. Pharmacol, 2018, 94:124–143. [DOI] [PMC free article] [PubMed] [Google Scholar]
- [28].Williamson G, Aerberli I, Miguet L, et al. Interaction of positional isomers of Quercertin glucuronides with the transporter ABCC2. Drug Met. Disp, 2007, 35(8):1262–1268. [DOI] [PubMed] [Google Scholar]
Associated Data
This section collects any data citations, data availability statements, or supplementary materials included in this article.