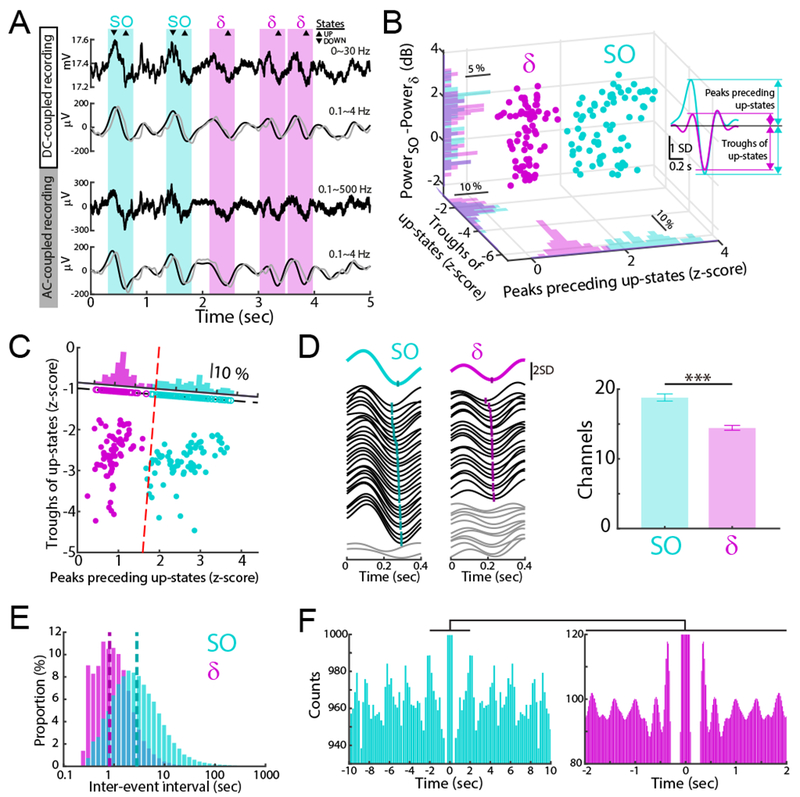
Figure 1. Dissociation of SO and δ.

(A) Examples of raw and filtered traces with DC- and AC-coupled recordings. Traces were filtered using online (gray) and offline (black) digital filters (Methods). SO and δ waves marked by cyan and magenta hereafter.
(B) SO versus δ waves from all post-training sleep (n = 72 sessions, 12 rats). Distribution of peaks preceding upstates, troughs of up-states, and differences between SO power (in 0.1-1 Hz) and δ power (in 1.5-4 Hz) are shown.
(C) SO versus δ waves separated by red dashed line (determined by k-means clustering). Projections to axis orthogonal to separation line shown.
(D) Left, Examples of traces from 32 channels of a array. Mean traces above and single channel trace below. Right, comparison of detected SO versus δ waves in the array (mean ± s.e.m.; n = 72 sessions, mixed-effects model, t142 = 5.13, ***P < 10−6).
(E) Distributions of inter-event intervals for SO and δ waves; dashed lines is geometric mean (n = 72 sessions; SO: 2.71 sec; δ: 0.96 sec).
(F) Autocorrelogram examples computed with bins of 100 ms (left) and 20 ms (right) from both SO and δ wave upstates for 1-hour sleep. Right histogram is an expansion of left histogram. Central peaks and lower values are truncated.
