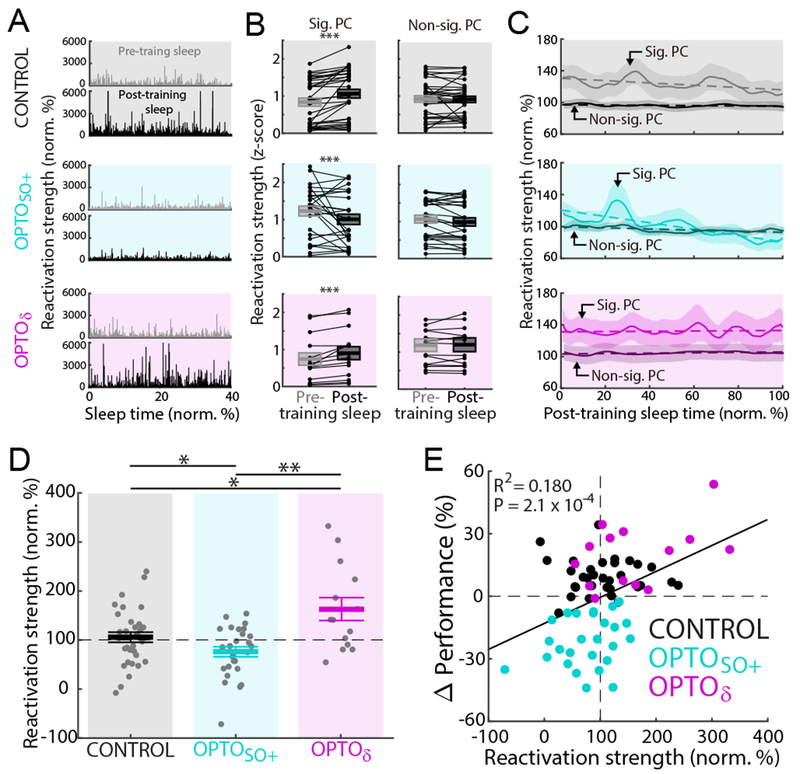
Figure 5. Strengthening and weakening of memory reactivation by optogenetic inhibitions.

(A) Examples of top 10 percentile reactivation events during a pre- and a post-training sleep in each respective condition (CONTROL, OPTOSO+, and OPTOδ). Normalized to the mean reactivation strength during pre-training sleep. First 40% of sleep shown.
(B) Changes from pre- to post-training sleep in the mean reactivation strength for a significant PC (z-scored in each pre- and post-training sleep pair using the mean and the standard deviation during both pre- and post-training sleep; mean in solid line ± s.e.m. in box; CONTROL: n = 32 sessions, 12 rats, mixed-effects model, t598126 = 16.31, ***P < 10−59; OPTOSO+: n = 26 sessions, 12 rats, mixed-effects model, t343469 = −6.12, ***P < 10−8; OPTOδ: n = 14 sessions, 5 rats, mixed-effects model, t344961 = 11.30, ***P < 10−28; corrected for multiple comparison). Same analyses with a non-significant PC (mixed-effects model, P > 0.05, corrected for multiple comparison).
(C) Average time course of top 10 percentile reactivation events during post-training sleep (mean ± s.e.m.; averaged with moving window of 5% sleep time). Normalized to the mean reactivation strengths during pre-training sleep (that is 100% on y-axis). Dashed line represents linear fitting with the significant PC (CONTROL: n = 32 sessions, 12 rats, R2 = 0.206, P = 2.1 × 10⁻⁶; OPTOSO+: n = 26 sessions, 12 rats, R2 = 0.626, P = 1.2 × 10⁻²²; OPTOδ: n = 14 sessions, 5 rats, R2 = 0.009, P = 0.36) and with the non-significant PC (CONTROL: n = 32 sessions, 12 rats, R2 = 0.132, P = 2.0 × 10⁻⁴; OPTOSO+: n = 26 sessions, 12 rats, R2 = 0.353, P = 6.9 × 10⁻¹¹; OPTOδ: n = 14 sessions, 5 rats, R2 = 0.206, P = 2.1 × 10⁻⁶). Across “A-C,” top, middle, and bottom represent the CONTROL, OPTOSO+, and OPTOδ experiments, respectively.
(D) Mean reactivation strength at the end of post-training sleep (i.e. last 15% of sleep; CONTROL: 108.5 ± 11.2%, n = 32 sessions, 12 rats; OPTOSO+: 75.7 ± 12.4%, n = 26 sessions, 12 rats; OPTOδ: 162.9 ± 16.9%, n = 14 sessions, 5 rats; one-way ANOVA, F2,57 = 8.42, P < 10−3; significant post hoc t tests, corrected for multiple comparison, *P < 0.05, **P < 0.01).
See also Figure S6.
(E) Relationship between the final mean reactivation strength of post-training sleep and task performance changes (total n = 72 sessions, 12 rats; significant linear regression, R2 = 0.180, P = 2.1 × 10⁻⁴).
