

Abstract
Although molecular tools for controlling neuronal activity by light have vastly expanded, there are still unmet needs which require development and refinement. For example, light delivery into the brain is still a major practical challenge that hinders potential translation of optogenetics in human patients. In addition, it would be advantageous to manipulate neuronal activity acutely and precisely as well as chronically and non-invasively, using the same genetic construct in animal models. We have previously addressed these challenges by employing bioluminescence and have created a new line of opto-chemogenetic probes termed luminopsins by fusing light-sensing opsins with light-emitting luciferases. In this report, we incorporated Chlamydomonas channelrhodopsin 2 with step-function mutations as the opsin moiety in the new luminopsin fusion protein termed step-function luminopsin (SFLMO). Bioluminescence-induced photocurrent lasted longer than the bioluminescence signal due to very slow inactivation of the mutated channel. In addition, bioluminescence was able to activate most of the channels on the cell surface due to the extremely high light sensitivity of the channel. This efficient channel activation was partly mediated by radiationless bioluminescence resonance energy transfer due to the proximity of luciferase and opsin. To test the utility of SFLMOs in vivo, we transduced the substantia nigra unilaterally via a viral vector in male rats. Injection of the luciferase substrate as well as conventional photostimulation via fiber optics elicited circling behaviors. Thus, SFLMOs expand the current approaches for manipulation of neuronal activity in the brain and add more versatility and practicality to optogenetics in freely behaving animals.
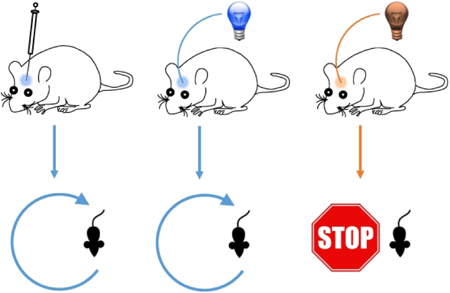
Graphical Abstract.
Step-function luminopsins allow activation of targeted neural circuits by a chemical (left) or physical light (center) to elicit specific behaviors in rodents (bottom). Its action can be terminated by illumination of yellow/red light (right).
INTRODUCTION
In the last decade, the optogenetics toolbox has vastly expanded. Various light-driven channels and pumps have been identified in algae and bacteria and successfully introduced into neurons in the brains of mammals and other species. Those opsins can cause either excitation or inhibition, depending on the ions they permeate or transport. Optogenetics allows unprecedented cellular and temporal specificity for controlling neuronal activity and has provided extraordinary experimental and therapeutic value in rodents. However versatile the technique is, there is one major hurdle: delivery of light into the brain. This is particularly problematic in larger brains, such as non-human primates and humans.
To circumvent the challenge imposed by delivery of external light into the brain, we have utilized biological light produced by luciferase enzymes as an alternative light source for activating light-sensing opsins. A luciferase emits bioluminescence when a small-molecule chemical substrate (e.g. luciferin) is applied. Since luciferase enzymes can be genetically encoded and expressed together with opsins in a cell type-specific manner, these bioluminescent light sources obviate any need for chronic implants or external hardware for delivery of light into the brain. We have already generated a number of fusion proteins termed luminopsins with marine luciferases and opsins (Berglund et al. 2013; Berglund et al. 2016; Tung et al. 2015). In the luminopsin fusion protein, light needed for activation of opsins is generated by the luciferase moiety when its substrate, marine luciferin (coelenterazine, CTZ), is bound. In this instantiation, opsins are activated by internal, biological light, which bypasses the challenges of delivering external light into the brain. The genetically encoded light source also offers much versatility in illuminating large, multiple, and/or complex structures in the brain because the substrate can spread throughout the brain when administered systemically. In addition, this approach does not involve cumbersome external hardware and thus is far less invasive than optogenetics. Although the time course of its action is limited by the diffusion of CTZ in the brain, and therefore slower than optogenetics, the advantages may outweigh this limitation in a variety of applications.
We have demonstrated previously that luminopsins can manipulate circling behaviors in rodents – either through neuronal excitation or inhibition. For neuronal excitation, Gaussia luciferase was coupled with a light-driven non-selective cation channel, Volvox channelrhodopsin 1 (Berglund et al. 2016). For neuronal inhibition, Renilla luciferase was coupled with a light-driven chloride pump, Natronomonas halorhodopsin (Tung et al. 2015). In these two studies, we have shown that these luminopsins are capable of inducing and suppressing neuronal activity, respectively, in the presence of the luciferase substrate, CTZ, in vitro and in vivo.
In this report, we describe the development and characterization of a new line of luminopsins that incorporate step-function opsins (SFOs) derived from Chlamydomonas channelrhodopsin 2 (Berndt et al. 2009; Yizhar et al. 2011b). The two step-function point mutations in the DC gate, namely D156A in the transmembrane domain (TM) 4 and C128S in the TM3, synergistically alter channel functions (Volkov et al. 2017). In developing new luminopsins, we capitalized on two unique properties of SFOs: prolonged deactivation kinetics and higher sensitivity. Deactivation is slowed by 100- to 10,000-fold in SFOs (Bamann et al. 2010; Berndt et al. 2009; Yizhar et al. 2011b) so that the channel is kept open even after cessation of photostimulation. This is ideal in experiments where sustained depolarization of target neurons is desired. The same mutations also make the channel extremely sensitive to light. This property is advantageous for activation of luminopsins by bioluminescence as biological light is inherently dim. We characterized and validated the new luminopsins based on the SFOs in a series of in vitro and in vivo experiments and termed them step-function luminopsins (SFLMO).
MATERIALS AND METHODS
All the procedures involving live rats described in this article were approved prior to implementation of the procedures and conducted in accordance with the Institutional Animal Care and Use Committees of the authors’ institutions.
Plasmids
DNA plasmids were made using conventional molecular biology methods. The BamHI – NotI fragment from LMO1 (GLuc-linker-ChR2-EYFP; Berglund et al. 2013) containing the 3’ end of the linker and the entire Chlamydomonas channelrhodopsin 2 (ChR2) sequence, was subcloned into pUC. The 417 bp XhoI – ApaI fragment of the ChR2 sequence (Nagel et al. 2003) was replaced with synthesized XhoI – ApaI fragments (Genscript) containing the nucleotide changes to encode for ChR2/C128S (Bamann et al. 2010; Berndt et al. 2009), /D156A (Bamann et al. 2010), and /C128S/D156A (Fenno et al. 2011), respectively. The correct modifications were confirmed by DNA sequencing.
The BamHI – NotI fragment from LMO3 (sbGLuc-linker-VChR1-EYFP; Berglund et al. 2016) was exchanged with the mutated ChR2 sequences from above, generating SFLMOs in a mammalian expression vector (modified pcDNA3.1) under control of the CAG promoter (pcDNA3.1/CAG-SFLMOs). To obtain an adeno-associated viral (AAV) vector, the transgenes were subcloned into an AAV transfer plasmid under control of the human synapsin I promoter, pAAV/hSynI.
To obtain an SFOCS (ChR2/C128S) expression vector without sbGLuc, the sbGLuc cassette in pcDNA3.1/CAG-SFLMOCS was removed between the compatible NheI and SpeI sites and ligated.
To obtain an sbGLuc expression vector without the secretion signal (SS; the first 17 amino acids of GLuc; sbGLucΔSS) fused with an orange fluorescent protein, monomeric cherry (mCherry), the HindIII – BsrGI fragment of LMO2 (Berglund et al. 2013) was replaced in a 3-piece ligation by a PCR fragment containing the coding sequence for sbGLuc without the signal peptide, flanked by HindIII and NotI sites (forward: 5’- TTGTCAAAGCTTATGAAGCCCACCGAGAACAAC; reverse: 5’- CGAACGGCGGCCGCGTCACCACCGGCCCCCTTG) and a NotI – BsrGI fragment containing mCherry, resulting in pcDNA3.1/CAG-sbGLucΔSS-mCherry.
To replace the linker between sbGLuc and SSFLMOCS/DA (sbGLuc-ChR2/C128S/D156AEYFP) with a linker that contained self-cleaving Thosea asigna virus 2A peptide (TaV-2A; EGRGSLLTCGDVEENPGP), first sbGLucΔSS in pcDNA3.1/CAG-sbGLucΔSS-tdTomato was PCR-amplified using a primer pair that contained the HindIII and BamHI sites (forward: 5’-ataaagcttgccaccatgaagcccaccgagaacaacgaag-3’; reverse: 5’-aatggatccccgtcaccaccggccccctt-3’) and ligated into the respective sites in pcDNA3.1/CAG-SSFLMOCS/DA, replacing sbGLuc with sbGLucΔSS. Then, the linker was replaced between the BamHI and SpeI sites with synthetized and annealed DNA oligos that contained the TaV-2A sequence (forward: 5’-gatccagagggccgcggctccctgctgacctgcggcgacgtggaggagaaccccgggccc-3’; reverse: 5’-ctaggggcccggggttctcctccacgtcgccgcaggtcagcagggagccgcggccctctg-3’).
To replace the linker between sbGLuc and SSFLMOCS/DA with a linker that contained the recognition site for a recombinant protease from the tobacco etch virus (TEV; ENLYFQG), the linker and a part of SSFOCS/DA in pcDNA3.1/CAG-SSFLMOCS/DA was PCR-amplified using a forward primer that replaces 7 amino acids with the TEV-encoding sequence (5’-cggggatccagaaaacctgtattttcaaggtgcccttgctgccacc-3’) and a ChR2 reverse primer (5’-cagtaacattgatcctcagggacc-3’) and then ligated into the BamHI and Bsu36I sites of the same plasmid.
Three point mutations, Glu97Arg (E97R), Arg120Ala (R120A), and/or D253A, were introduced into the SSFO moiety of SSFLMOCS/DA using a commercial mutagenesis kit following the manufacturer’s instructions and their online primer design software (QuickChange XL; Agilent Technologies, La Jolla, CA). The primers were designed so that they additionally remove (XhoI with E97R) or add (NdeI with R120A and AfeI with R253A) a restriction site. First, the SSFLMOCS/DA cassette in the pcDNA3.1/CAG vector was moved into the pGP/CMV vector (Addgene plasmid #: 40753, a gift from Douglas Kim) using the unique NheI/BsrGI restriction sites and then site-directed mutageneses were performed. The correct sequence was confirmed by respective restriction enzyme analysis as well as DNA sequencing. The SSFLMO cassette with mutation(s) were cloned back into the original pcDNA3.1/CAG vector using the same restriction sites and transfection-grade plasmids were prepared using a commercial kit (PureLink Midiprep Kit; Invitrogen, Waltham, MA). The plasmids were tested in vitro in human embryonic kidney (HEK) 293 cells in culture for electrophysiological properties and expression levels using patch clamp techniques and plate-reader assays, respectively, similar to primary neuronal culture described below. Based on these results, the SSFO-EYFP cassette with the chosen double mutations (E97R and D120A) was subcloned into the AAV transfer plasmid, pAAV/hSynI, using the unique SpeI/BsrGI sites for subsequent production of AAV vectors.
Viral vector
Recombinant AAV vectors carrying the luminopsin genes were produced by transfecting subconfluent HEK293FT cells per 10-cm culture dish with 24 μg of the helper plasmid pAd delta F6, 20 μg of the Cap/Rep plasmid pseudotyped with AAV2/9, and 12 μg of the AAV transfer plasmid described above using lipofection (Lipofectamine 2000; Life Technologies, Carlsbad, CA, USA). 72 hours after transfection, the supernatant was harvested from culture plates and filtered through a 0.45-μm pore membrane. Virus was purified from cells and supernatant following the method of Guo et al. (2012) with a modification: no partitioning step in the aqueous two-phase system. Virus was dialyzed against phosphate buffered saline (PBS; without Ca2+ and Mg2+) overnight at 4 °C (Float-A-Lyzer G2; MWCO: 50KD; Spectrum, Rancho Dominguez, CA, USA), followed by concentration (Amicon Ultra-0.5 ml Centrifugal Filters; EMD Millipore, Billerica, MS, USA). Viral particles were resuspended in sterile PBS, aliquoted, and kept at −80 °C until use. Titers were determined by quantitative PCR for the woodchuck hepatitis post-transcriptional regulatory element. They ranged from 1 × 10¹⁰ to 1 × 10¹³ viral genomes (vg)/ml.
Primary neuronal culture
Primary cortical neurons were dissociated from embryonic day 18 rat embryos of both sexes carried by pregnant Sprague-Dawley females obtained directly from a commercial vendor (Harlan, Indianapolis, IN, USA). Cortical neuron cultures were seeded on 12-mm poly-D-lysine-coated #1 glass coverslips (BioCoat, Corning, Corning, NY, USA) in four-well or 24-well plates (Corning) for electrophysiology or 96-well plates (Corning) for plate-reader assays. Neurons were initially maintained in Neurobasal medium (Invitrogen) supplemented with GlutaMAX (Invitrogen), heat-inactivated fetal calf serum (5% v/v), and gentamicin (final concentration: 1 μg/ml; Invitrogen). The medium was replaced with one without serum and antibiotics, but with B-27 serum-free culture supplement (Invitrogen) the next day. For plate-reader assays in 96-well plates, same culture medium, but without phenol red was used.
Neurons were transfected via lipofection (Lipofectamine 2000) or transduced with viral vectors on days in vitro (DIV) 2. Multiple wells were transfected with the same DNA. Different DNAs were used in different wells within the same plate for comparisons. Lipofection was done by following the manufacturer’s protocol with a modification: The volume of Lipofectamine and the amount of plasmids were reduced to 10% of the recommended values. A viral vector was added to the culture medium at 1 μl/ml dilution. Neurons were used for recording on DIV 10–14. All-trans retinal (R2500; Sigma-Aldrich, St. Louis, MO, USA) was added to the culture medium (final concentration: 100 μM) the day before electrophysiological recordings.
Microscopy and electrophysiology
Neurons were examined on an upright epifluorescence microscope (Eclipse FN-1, Nikon) equipped with a 40× 0.8 NA water immersion objective, a metal-halide arc lamp, an electronic shutter (Uniblitz, Vincent Associates), filter cubes (B-2E/C, G-2E/C, Y-2E/C, HcRed and Cy5 from Nikon and FITC-LP01 from Semrock, Rochester, NY), a cooled CCD camera (CoolSNAP fx, Photometrics), and acquisition software (μManager 1.4, http://www.micro-manager.org) on a PowerMac G5 (Apple).
For electrophysiology, conventional whole-cell voltage or current clamp recordings were made using a patch clamp amplifier (MultiClamp 700B; Axon Instruments), a digital acquisition system (Digidata 1440A; Axon Instruments), and patch-clamp software (pClamp 10; Axon Instruments) on a PC. Recording pipettes had resistances of 7–10 MΩ when filled with 140 mM K-gluconate, 2 mM MgCl2, 0.5 mM CaCl2, 10 mM HEPES, 4 mM Na2-ATP, 0.4 mM Na3-GTP, and 5 mM EGTA (pH 7.15 titrated with KOH). The extracellular solution consisted of 150 mM NaCl, 3 mM KCl, 2 mM CaCl2, 2 mM MgCl2, 20 mM D-glucose, and 10 mM HEPES (pH 7.35, titrated with NaOH). For voltage clamp experiments, cells were held at −60 mV. For current clamp experiments, cells were held with zero current. Junction potential was not corrected. A chamber for a 12-mm coverslip (RC-48LP, Warner Instruments) was constantly superfused with the extracellular solution at the rate of ~500 μl/min. For routine SFO activation and deactivation, the GFP filter cube (excitation: 465–495 nm) and the HcRed filter cube (excitation: 550–600 nm) were used, respectively. We also observed SFO deactivation with the Cy5 filter cube (excitation: 630–650 nm) to somewhat lesser extent compared to the HcRed filter cube (data not shown). Intensity was adjusted by a combination of neutral-density filters in the microscope (ND4, 8, and 16; Nikon) and in the mercury lamp house (ND2, 4, 8, 16 and 32; Nikon C-HGFI). The recordings were performed at room temperature (21–24 °C).
For bioluminescence imaging, native coelenterazine (CTZ; cat. #: 303; Nanolight, Pinetop, AZ, USA) was reconstituted at 50 mM in a proprietary solvent (NanoFuel; cat. #: 399; Nanolight) and kept at −80 °C until use. Immediately before application, an aliquot of the CTZ stock solution was diluted in the extracellular solution at 100 μM. CTZ solution (500 μl) was added to the recording chamber. Bioluminescence was imaged using the CCD camera every 5 s without any filter cube with 4-by-4 binning and 4.5-s exposure time.
Bioluminescence measurements
Bioluminescence was measured between DIV10 and DIV14 using a plate reader (FLUOstar Optima, BMG Labtech, Ortenberg, Germany) immediately after adding 50 μl of CTZ solution to each well (final concentration 33 μM in culture medium). To correct for the background, CTZ was added to wells with neurons without transfection and the averaged signal was subtracted.
Recombinant tobacco etch virus (rTEV) protease (10127–017; Invitrogen) was first diluted at 1:50 in culture medium and 50 μl of diluted solution was added to each well (10 units/well). The plate was then incubated in the CO2 incubator for 1 hour at 37 °C to ensure complete hydrolysis before the assay. For control wells, water was used instead of rTEV protease stock solution.
To eliminate retinal from the culture medium, cells were cultured in Neurobasal medium containing B27 supplement without retinal precursor, vitamin A (12587010; Gibco). As a positive control, all-trans retinal was added to the culture medium (final concentration: 100 μM) the day before plate-reader assays.
For the experiments with hydroxylamine, cells were cultured in Neurobasal medium containing B27 supplement with vitamin A. Hydroxylamine hydrochloride (379921; Sigma) was directly dissolved in the culture medium to obtain 1 mM solution and pH was adjusted with sterile NaOH (1 N). About an hour before bioluminescence measurements, the standard culture medium was replaced with the one with hydroxylamine. To facilitate retinal removal from the opsin with hydroxylamine, blue light was applied by setting up the plate reader in the fluorescence measurement mode and by applying 480-nm light (20 flashes/well with an orbital movement).
Stereotactic surgeries
Unilateral injections of the viral vector into the substantia nigra of adult rats were performed as previously described (Tung et al. 2015). Two-month-old male Sprague-Dawley rats (200–250 g) were anesthetized with 1.5–4% isoflurane in oxygen and a craniectomy was made 5.6 mm posterior and 2.0 mm lateral to the bregma. Half of the animals received AAV in the left substantia nigra and the other half in the right substantia nigra. Pairs of rats were assigned randomly to these two conditions. Three animals received control AAV. AAV was diluted at 1:100 in sterile PBS and ~1 μl (~1 × 10⁷ vg) was stereotaxically injected at a depth of 7.9 mm from the dura targeting the substantia nigra. Five minutes after a glass-pulled pipette was positioned, virus was injected through the pipette using a microinjector (Nanoject; Drummond Scientific) as 15 × 69-nl injections over 5 minutes. Five minutes after viral injection was completed, the glass pipette was slowly withdrawn and the scalp stapled closed. An analgesic (meloxicam; 2 mg/kg; S.C.; q.d.) was administered after surgery.
One week after viral injection, the animals underwent a second surgery for implantation of a guide cannula to allow intracranial injection of CTZ via an injection cannula as well as photostimulation of the nigra via an optical fiber (n=5 rats) or for implantation of a jugular vein catheter for intravenous injection of CTZ (n=4 rats).
For implantation of a guide cannula, the same coordinates were used for stereotaxic insertion of a 21G guide cannula (Plastics One) except that the tip was placed 1 mm above the viral injection site. Four skull screws were attached to the skull and the cannula was sealed with dental acrylic (Lang Dental). In some animals, the viral vector was injected through the cannula. A 26G injection cannula connected to a Hamilton syringe through a distilled water-filled polyethylene tubing was back-filled with viral suspension. The injection cannula protruded 1 mm when inserted into the implanted guide cannula. Viral suspension was dispensed by the Hamilton syringe placed in a syringe pump (CMA/100; Carnegie Medicin) at the rate of 200 nl/minute for 5 minutes. A dummy cannula was inserted into the guide cannula at the end of the surgery.
For implantation of a jugular vein catheter, after tissue above the jugular vein was cleared away the vein was isolated and tied off on the end distal to the heart with silk suture material. An incision was made in the jugular vein. The upper flap was held and the pre-sterilized silicone catheter with a membrane injection port (PNP3F22–50, Instech Laboratories, Plymouth Meeting, PA) was inserted into the vein through the incision. After the catheter was inserted into the vein, the suture material tied around the vein was used to anchor the catheter. Another portion of suture material was used to tie off the region of the implantation proximal to the heart to provide further anchoring of the catheter. A small amount of tissue adhesive (Vetbond, 3M cat. #: 1469SB, St. Paul, MN) was used to fortify the anchoring knots. The rat was turned over and an incision was made on the dorsal region just between the shoulder blades. The skin was separated from the underlying tissue. The hemostats were worked through the skin until they appeared on the ventral side and were used to thread the catheter through the skin to exit through the dorsal incision. The dorsal incision was closed, and the catheter was anchored to the skin using monofilament suture. The ventral incision was closed similarly. To prevent infection and clogging, catheters were flushed daily with 0.02 ml gentamicin (4 mg/ml) and 0.02 ml heparin solution (30 U/ml in sterile saline), respectively, with a sterile syringe attached with an injection port adaptor (PNP3M-50, Instech Laboratories).
After the surgery, the animals were housed individually with ad libitum access to normal rodent chow and water with the 12-hour light/12-hour dark cycle. Animals were monitored for body weight, head caps, and/or catheter until the end of the experiments and were immediately euthanized if they lost 15% of the body weight compared to the pre-surgery level or lost their head caps. Two animals were excluded due to head cap failures. Two animals died during surgeries. No mortality was observed otherwise.
Antibody characterization
In this study, the following antibodies were used (Table 1).
Table 1.
A list of antibodies used in this study.
| Name | Immunogen | Catalog number | RRID | Concentration |
|---|---|---|---|---|
| Anti-GAD67 | Full-length (594AA) recombinant human GAD67 | Millipore 5406, mouse monoclonal | AB_2278725 | 4 μg/ml |
| Anti-mouse IgG conjugated with Alexa Fluor 594 | Mouse IgG heavy and light chains | Invitrogen A21203, donkey polyclonal | AB_141633 | 2 μg/ml |
The manufacture validated specificity in Western blot. Anti-GAD67 antibody recognized a single band of the 67 kDa isoform, but not the 65 kDa isoform, in rat brain lysate. In our immunohistochemical analysis, the staining pattern in the substantia nigra was similar to our previous observation and the signal was primarily observed in pars reticulata, a region known for containing GABAergic neurons and their processes.
Histology
Rats were euthanized by barbiturate (Euthasol; Virbac, Fort Worth, TX) overdose. After deep anesthesia was confirmed, cardiac perfusion was performed with saline (0.9% [w/v] NaCl solution) followed by 4% paraformaldehyde in saline. The brain was removed and post-fixed overnight in the same solution at 4°C and then placed in 30% (w/v) sucrose solution in PBS for cryoprotection. Coronal sections were cut at 40 μm thickness with a cryostat. For immunostaining, floating sections were blocked and permeabilized in PBS containing 4% normal donkey serum (NDS) and 0.5% Triton-X100 for 30 minutes on a shaker at room temperature. Sections were then incubated in PBS containing 2% NDS and mouse antibodies against glutamate decarboxylase 67 Kd isoform (anti-GAD67; Millipore cat. #: 5406; RRID: AB_2278725), a marker of GABAergic neurons overnight on a shaker at 4°C. Sections were then rinsed in PBS and incubated in PBS containing 2% NDS and AlexaFluor 594-conjugated donkey anti-mouse IgG secondary antibodies (Invitrogen cat. #: A21203; RRDI: AB_141633). After several rinses, sections were mounted with antifade mounting medium (Vectashield with DAPI; Vector Laboratory, Burlingame, CA, USA), and covered with #1.5 glass coverslips for fluorescence microscopy using an inverted microscope (Leica).
Behavior
Under light anesthesia with isoflurane, a harness was attached to the upper body of the rat, and an injection cannula was inserted. The rat was then placed into a cylindrical chamber with an automated counter-rotation mechanism (Raturn System; BASi, West Lafayette, IN, USA). In our preliminary experiments, the animals hardly moved in the cylinder without external stimuli. Thus, the animal was given the psychostimulant, amphetamine (2.5 mg/kg), by intraperitoneal injection before each session to exaggerate the imbalance of outputs between the left and the right substantia nigra, thereby more likely inducing circling behavior. Partial (270°) rotations were automatically logged in spreadsheet software (Microsoft Excel) for up to an hour using TTL signals from the system recorded with a microcontroller (Arduino Uno) and a serial port communication tool (PLX-DAQ; Parallax, Rocklin, CA, USA). Fifteen minutes after the animal recovered from anesthesia and started moving, it was injected with either 1 μl of CTZ (1 mM in PBS; 200 nl/minute for 5 minutes) or vehicle (sterile PBS) through the injection cannula using the syringe pump. For systemic injection using the jugular vein catheter, 1 mg of sterile native CTZ dissolved in 250 μl of sterile solvent was injected (Inject-ALume, Nanolight cat. #: 303-INJ). This dosage corresponds to 150 – 180 μM at the plasma level when evenly distributed for an estimated total blood volume of 13 – 16 ml (Lee and Blaufox 1985). Each animal received both CTZ and vehicle injections with an interval of at least 3 days and the order was counterbalanced between animals. For photostimulation, a 0.39 NA, 200 μm core diameter bare fiber optic (Thorlabs) was inserted in an injection cannula and positioned 500 μm above the virus injection site using the same guide cannula used for CTZ injection. One-minute continuous photostimulation with blue (465 nm; 9.7 mW/mm2 at the fiber tip) or orange (620 nm; 46 μW/mm2 at the fiber tip) light from a fiber-coupled LED (Plexon) was used. The assays were conducted in the late afternoon (5–7PM). The experimenter for the behavioral paradigm was blind to the surgical conditions.
RESULTS
Step-function opsin as a highly efficient acceptor of bioluminescence
Activation of Chlamydomonas channelrhodopsin 2 (ChR2) can be prolonged by incorporating point mutations in the pore region, namely Cys128Ser (ChR2CS) and Asp156Ala (ChR2DA) (Berndt et al. 2009). To test which step-function opsin (SFO) best suits bioluminescence activation, we first compared photocurrent resulting from blue light illumination to the channelrhodopsin moieties in new luminopsins. Dissociated cortical neurons in culture were transfected and then whole-cell patch clamped. Photocurrent was elicited by prolonged blue light (480 nm for 10 s) of various intensity (Fig. 1a). To make sure that the current was normalized to the baseline before each photostimulation, channels were deactivated by illuminating yellow light (575 nm at 1.4 mW/mm2 for 1 s) which facilitates deactivation of SFO (Berndt et al. 2009; Yizhar et al. 2011b). Relative amplitudes of photocurrent were plotted against photostimulation intensity, yielding dose-response curves for each mutant that can be described by the Hill equation (Fig. 1b). ChR2DA and ChR2CS showed higher sensitivity to blue light compared to wildtype ChR2 and Volvox channelrhodopsin 1 (VChR1), which were used in the previous iterations of luminopsins (LMO1 and LMO2/3, respectively; Berglund et al. 2013; Berglund et al. 2016). Amplitudes of photocurrent at saturating intensity of light were similar between the two SFOs (p>0.99; Tukey’s multi comparisons; q(4,14)=0.22) and both were significantly smaller compared to wildtype ChR2 (*p=0.007; one-way ANOVA followed by Tukey’s multi comparisons; F(3,14)=6.17; n=5, 5, 4, and 4 for ChR2, VChR1, ChR2CS, and ChR2DA, respectively; *p<0.02; q(4,14)>4.79 between ChR2 and SFOs; Figs. 1c and d), suggesting that they may not drive neurons as much as the previous versions of luminopsins based on wildtype ChR2. These experiments suggest SFOs as excellent actuators for bioluminescent activation albeit for smaller amplitudes in photocurrents, taking advantage of high light sensitivity as biological light is inherently dim compared to conventional, physical light sources for optogenetics.
Figure 1.
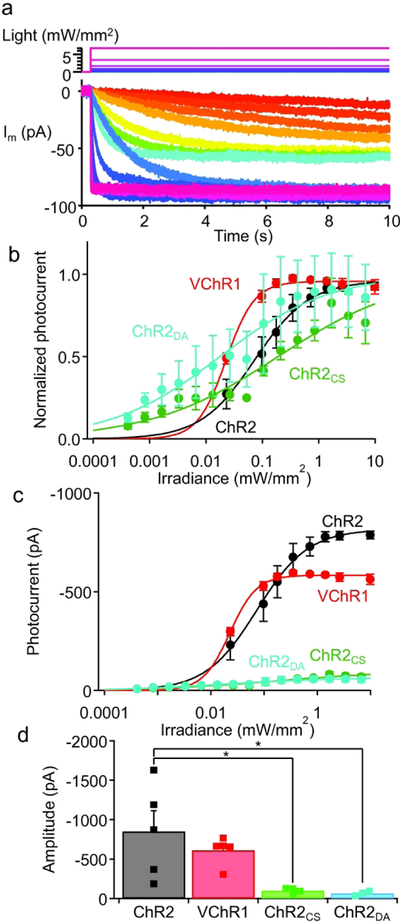
Quantification of photocurrent for various opsins in luminopsins. a. A representative family of photocurrents (bottom) elicited by 480 nm light (top) in the SFOCS moiety in the new luminopsin. b. Dose-response relationships of photocurrents with different opsins. n=4 (ChR2), 5 (VChR1), 4 (SFOCS) and 3 (SFODA) cells. c. The same data as in b shown in absolute amplitude without normalization. d. Amplitudes of photocurrents in response to saturating intensity of light (>1 mM/mm2). n= 5 (ChR2), 5 (VChR1), 4 (SFOCS) and 4 (SFODA) cells. Data for ChR2 and VChR1 was replotted from a previous publication (Berglund et al. 2013). The error bars in this and subsequent figures represent the standard errors of the mean. Asterisks denote statistical significance in Tukey’s multi comparisons following one-way ANOVA. Asterisks in this and subsequent figures denote statistical significance. See text for the detail.
A new line of luminopsin fusion protein was created by placing the slow-burn variant of Gaussia luciferase (sbGLuc; wildtype GLuc with Met60Leu and Met127Leu double mutations; Welsh et al. 2009) at the N-terminal of ChR2 with single or double SFO mutation (stabilized SFOCS/DA or SSFOCS/DA; Yizhar et al. 2011b) through a 15 amino-acid linker. We termed the new fusion protein step-function luminopsin (SFLMO). When transfected, neurons showed robust expression of the fusion protein as examined by fluorescence from the enhanced yellow fluorescent protein (EYFP) tag placed at the C-terminus of mutated ChR2 (Fig. 2a). When challenged with luciferase substrate, coelenterazine (CTZ; 100 μM), the cell showed robust bioluminescence across the entire cell membrane (Fig. 2b). To quantify efficiency of bioluminescence to induce photocurrent among different versions of SFLMOs, responses to physical, external light were first recorded (Fig. 2c). A neuron, here expressing SFLMODA, was illuminated by saturating intensity of blue light (480 nm at 820 μW/mm2 for 1 s), which elicited inward current that did not decay after cessation of photostimulation (Fig. 2c, left), consistent with the photodynamics of SFOs (Berndt et al. 2009; Yizhar et al. 2011b). Deactivation of SFO is significantly prolonged compared to wildtype ChR2 and photocurrent lasted even after cessation of photostimulation. To eliminate existing photocurrent, if any, a longer wavelength of light was applied before applying CTZ (575 nm at 1.4 mW/mm2 for 1s) which facilitated deactivation of the SFO (Fig. 2c, right) (refer to Berndt et al. 2009; Yizhar et al. 2011b for detailed deactivation kinetics).Bath-application of CTZ caused transient bioluminescence, which in turn elicited inward current with an amplitude similar to that achieved with saturating intensity of light (Fig. 2d). CTZ-induced photocurrent decayed eventually at this longer time scale, but its time course was slower than the decay of bioluminescence, consistent with the nature of SFOs in that photocurrent outlasts light due to their prolonged deactivation kinetics.
Figure 2.

Bioluminescence-induced photocurrent and its efficiency in neurons. a and b. SFLMODA-transfected neurons in fluorescence (a) and bioluminescence (b). The EYFP tag in the luminopsin was imaged through a green filter cube in the microscope. Bioluminescence was induced by CTZ (100 μM) and imaged without a filter cube. Exposure time was 100 ms and 1 s, respectively. c and d. Representative photocurrents (Im) in response to physical (c) and biological light (d). The SFODA moiety in the luminopsin was activated by 480 nm light (422 μW/mm2; blue bar) and subsequently deactivated by 575 nm light (902 μW/mm2: yellow bar; c). CTZ (100 μM; arrow) was bath-applied to the same cell, which induced bioluminescence and, in turn, bioluminescence-induced photocurrent (d). e. Relationships between lamp-induced photocurrent and bioluminescence-induced photocurrent. Each cell was challenged by physical blue light from a lamp at a saturating intensity (> 2 mW/mm2; 480 nm) and saturating concentration of CTZ (100 μM) and the amplitudes of photocurrent induced in the two modes were plotted. n=12 (LMO1), 10 (LMO2), 21 (LMO3), 5 (SFLMOCS), 6 (SFLMODA), and 4 (SSFLMOCS/DA) cells. Data with SFLMOs were fitted with linear regressions. f. Coupling efficiency of SFLMOs. CTZ-induced photocurrent was divided by lamp-induced photocurrent in each cell and the means and SEMs were calculated for each variant of luminopsins. n=12 (LMO1), 10 (LMO2), 21 (LMO3), 5 (SFLMOCS), 6 (SFLMODA), and 4 (SSFLMOCS/DA) cells. Data with LMO1, 2, and 3 were replotted from a previous publication (Berglund et al. 2016).
These experiments were carried out with the SFLMO variants, and amplitudes of CTZ-induced current were plotted against those of lamp-induced current with saturating intensity (Fig. 2e). Such plots revealed superior efficiency of SFLMOs as their linear relationships appeared above those with the previous versions of luminopsins, LMO1, LMO2 (Berglund et al. 2013), and LMO3 (Berglund et al. 2016). For quantitative analysis, we defined a simple index, coupling efficiency (Berglund et al. 2013), as follows: CTZ-induced current divided by lamp-induced current measured in each cell. On average, coupling efficiency of SFLMOs ranged between 54.1 – 66.6% (Fig. 2f), which was significantly higher than the previous versions of luminopsins (*p = 0.0001; one-way ANOVA; F(3,32) = 9.90; n = 21, 5, 6, and 4 for LMO3, SFLMOCS, SFLMODA, and SSFLMOCS/DA, respectively); we did not observe a significant difference in coupling efficiency among SFLMOs (p > 0.47 at least; Tukey’s multi-comparison test; q(32,4) < 2.08 at most)(Fig. 2f). These experiments confirmed SFOs as efficient actuators for bioluminescent activation due to their superior light sensitivity compared to wildtype ChR2 or VChR1.
In our design of luminopsins, opsin and luciferase are fused together as a single molecule. This guarantees 1:1 stoichiometry as well as proximity of the two molecules, although it is not clear whether the arrangement as fusion protein is necessary for bioluminescent activation of opsins. To address this question, we separately expressed sbGLuc and SFO and compared the resulting CTZ-induced current with that from the fusion protein. To express the two molecules separately, we employed two approaches: co-transfection and self-cleavage. The former was achieved by transfecting neurons with two plasmids, SFOCS and sbGLuc-tdTomato (sbGLuc fused with an orange fluorescent protein, tandem-dimer Tomato). Although we used the same amount of DNA plasmids with the same promoter for co-transfection, the expression levels could be different between the two molecules as turnover rates of mRNA and/or protein can be different. The latter approach, self-cleavage, was achieved by replacing the 15-amino acid (AA) linker between luciferase and opsin with a 33-AA linker that contained the Thosea asigna virus 2A peptide. The 2A peptide is cleaved at the time of translation, resulting in 1:1 stoichiometry between luciferase and opsin, provided 100% efficiency in self-cleavage. In both approaches, we removed the secretion signal (SS) from sbGLuc (sbGLucΔSS) so that the otherwise secreted protein would remain inside the cell as it was no longer tethered to the membrane through a membrane protein (opsin).
Similar to when the SFO was expressed alone without luciferase (Fig. 3a, SFOCS), we did not observe any significant CTZ-induced current when the two proteins were expressed separately (Fig. 3a, SFOCS+sbGLucΔSS and SSFLMOΔSS/2A). This was in stark contrast to the two proteins expressed together as fusion protein, in which case CTZ elicited photocurrent proportional to lamp-induced current (Fig. 3a, SSFLMOCS/DA). These experiments suggest that the close configuration of the two moieties in one fusion protein is necessary for bioluminescence-mediated activation of opsins.
Figure 3.

A configuration as a fusion protein is necessary for efficient energy transfer from the luciferase to the opsin. a. SFOs and GLuc were co-expressed by two different ways (cotransfection: SFOCS+sbGLucΔSS, n=3 cells, open squares; 2A self-cleavage: SSFLMOΔSS/2A, n=3 cells, open circles) and CTZ-induced current was compared to those with the fusion protein (SSFLMOCS/DA, n=5 cells, filled circles) and the opsin alone (SFOCS, n=3 cells, open triangles). b. Recovery of donor bioluminescence after detachment of the acceptor (opsin). Bioluminescence was measured in neurons transfected with the original SSFLMOCS/DA and the one with a modified linker (SSFLMOTEV) with or without a recombinant protease from the tobacco etch virus (rTEV). n=4 wells each. c. Bioluminescence measurements in neurons transfected with SFLMOCS in the presence or absence of all-trans retinal (100 μM). n=4 wells each. d. Bioluminescence measurements in neurons transfected with SFLMOCS in the absence or presence of hydroxylamine (1 mM). The effect of hydroxylamine was further augmented by shining blue light before bioluminescence measurements (480 nm; 20 flashes; +Light). n=7 wells each.
Next, we asked about the nature of opsin activation by luciferases. Based on the proximity of the two moieties, we speculated that part of the activation could be mediated by bioluminescence resonance energy transfer (BRET) rather than simple, photon-mediated, energy transfer. If proximity of the two molecules is causing radiationless BRET, then the donor, sbGLuc, will recover emission when the acceptor, SFO, is removed. To “cut the tie” between the two molecules, we replaced the short linker between sbGLuc and SSFOCS/DA with the amino-acid sequence recognized by the recombinant protease from tobacco etch virus (rTEV). Treatment with rTEV did not affect bioluminescence from unmodified SSFLMOCS/DA which did not have the protease recognition site (p > 0.6; two-tailed Student’s t-test; t(6) = 0.51; n = 4 each)(Fig. 3b). However, the same treatment significantly increased bioluminescence from SSFLMOCS/DA modified with the protease recognition site (SSFLMOTEV)(*p = 0.044; two-tailed Student’s t-test; t(6) = 2.56; n = 4 each), indicating that the sbGLuc moiety recovered bioluminescence after it was detached from the acceptor, SSFOCS/DA. To further confirm BRET in luminopsins, we employed an approach analogous to bioluminescence recovery after acceptor photobleaching, commonly used to prove bioluminescent-fluorescent BRET protein pairing. We assumed that the acceptor in the case of luminopsins is the chromophore in the opsin, retinal. Thus, instead of photobleaching the acceptor, we removed the presumable BRET acceptor from the opsin moiety by removing retinal from the medium during culture. This chronic treatment of retinal deficiency also significantly increased bioluminescence from the presumable BRET donor, sbGLuc, compared with cells treated with all trans-retinal before the assay (*p = 0.048; two-tailed Student’s t-test; t(6) = 2.55; n = 4 each)(Fig. 3c). To remove retinal more quickly, we also employed hydroxylamine. When cells were treated with hydroxylamine just before bioluminescent assays to remove retinal from the opsin, bioluminescence was increased (Fig. 3d) although the effect was not significant (p > 0.08; Dunnett’s multi-comparison test; q(18,3) = 2.13; one-way ANOVA; F(20) = 5.37; *p = 0.015; n = 7 each). The effect became significant (*p = 0.0089; Dunnett’s test; q(18,3) = 3.22) when it was further enhanced by irradiating the cells with blue light, consistent with observations that a retinal-binding Schiff base of rhodopsin is much more reactive to hydroxylamine under illumination (Inoue et al. 2016; Katayama et al. 2010). These lines of evidence support the hypothesis of radiationless energy transfer within the luminopsin fusion protein. Taken together, we conclude that proximity of the two moieties in luminopsins is a requirement for efficient activation of the opsin by bioluminescence and that this activation is mediated mainly by radiationless BRET.
Long-lasting depolarization with step-function luminopsin activated by bioluminescence
Next, we tested the utility of the new luminopsins in neurons in vitro. The three variants of SFLMOs were expressed in primary rat cortical neurons in culture by transient transfection and the cells were probed by patch-clamp electrophysiology under current clamp to record bioluminescence-mediated depolarization (Fig. 4). Upon application of CTZ, we were able to record sustained depolarization whose time course corresponded with bioluminescence (Fig. 4a). Although, we did not observe robust action potential firing after CTZ application, consistent with previous observations in SFO-expressing neurons during conventional photostimulation (Berndt et al. 2009; Yizhar et al. 2011b), we encountered occasional firing of action potentials during bioluminescence-induced depolarization (Fig. 4a, Vm). Three minutes after CTZ application, bioluminescence-induced depolarization was ceased by a pulse of longer-wavelength light using a filter cube and a mercury lamp in the epi-fluorescence unit (Fig. 4a, right), similar to the photocurrent of SFO (Fig. 2c).
Figure 4.

Bioluminescence-mediated depolarization in neurons. a. Representative traces of bioluminescence and membrane potential (Vm) after bath-application of CTZ (100 μM, arrow). An SFLMOCS-expressing neuron was whole-cell patch-clamped and held under current clamp with no holding current. Bioluminescence-induced depolarization (arrow b; quantified in panel b) was ceased by a light pulse of a longer wavelength (575 nm; 902 μW/mm2, red bar). Note that the first bioluminescence-induced response and the subsequent lamp-induced response were shown in different time scales. The remaining amplitude of depolarization 3 minutes after CTZ application (arrow c) was quantified in panel c. b. Mean depolarization induced by CTZ with variants of SFLMOs. For comparison, depolarization with the previously published LMO3 was also shown (Berglund et al. 2016). n=4 (LMO3), 8 (SFLMOCS), 4 (SFLMODA), and 4 (SSFLMOCS/DA). c. Mean proportion of bioluminescence-induced depolarization remained 3 minutes after CTZ application. The amplitude of remaining depolarization with SFLMOs was accurately determined by the light pulse of a longer wavelength applied at the end of CTZ application. For LMO3, the remaining depolarization was defined as the difference in the membrane potential before and 3 minutes after CTZ application.
On average, CTZ-induced depolarization with the three different versions of SFLMO had amplitudes of 11.1 – 16.4 mV and they were not statistically different from each other or from the previous version of luminopsin, LMO3 (Fig. 4b; p>0.23; one-way ANOVA; F(3, 16)= 1.60; n=4, 8, 4, and 4 cells for LMO3, SFLMOCS, SFLMODA, and SSFLMOCS/DA, respectively). To examine how long bioluminescence-induced depolarization lasts, we quantified the amplitude of depolarization 3 minutes after CTZ application, when bioluminescence was almost gone (Fig. 4a, right, arrow c). As expected from the prolonged kinetics of SFOs, significant portions of bioluminescence-induced depolarization remained in SFLMO-expressing neurons whereas the membrane potential of LMO3-expressing neurons went back to the pre-application levels by this time point (Fig. 4c; *p=0.00933; one-way ANOVA; F(3,16)=5.43; n was the same as Fig. 4b)(Berglund et al. 2016). The prolonged depolarization was especially significant with SFLMOCS and SSFLMOCS/DA, where more than 50% of depolarization induced by CTZ remained 3 minutes after application. The remaining portion of bioluminescence-induced depolarization was significantly different from LMO3 (*p<0.035; Dunnett’s test; q(16,4)> 2.76). Thus, SFLMO could induce depolarization of an amplitude comparable with the previous luminopsin yet with prolonged time course.
Non-functional SFLMO with point mutations for control experiments
Any experimental manipulation calls for control experiments to eliminate potential unintended effects. Luminopsins pose a unique challenge for control conditions as they require a foreign substrate, CTZ, which generates bioluminescence. An ideal control would be a condition where bioluminescence is generated by CTZ, but the opsin moiety of luminopsin does not transduce electrical activity. We generated such control luminopsins by introducing non-functional point mutations already described for ChR2, Glu97Arg (E97R; Tanimoto et al. 2013), Arg120Ala (R120A), and Asp253Ala (D253A; Kato et al. 2012), into SSFLMOCS/DA. As these mutations have never been examined in combination with the step-function mutations (i.e. C128S and D156A), we first characterized them in terms of expression and photocurrents in transiently transfected human embryonic kidney (HEK) cells.
Based on fluorescence from the EYFP tag, expression of mutant SSFLMOs in HEK cells was qualitatively similar to that of the original SSFLMOCS/DA. All mutants were expressed in HEK cells and appeared to be translocated to the membrane (Fig 5a). To quantify expression levels of the mutants, we measured fluorescence from EYFP as well as bioluminescence from GLuc using a plate reader (Figs. 5b and c, respectively). The fluorescence signal was similar among the original and mutant SSFLMOs and there was no statistical difference (p>0.4; one-way ANOVA; F(6,49)=0.95; n=8 wells each). In contrast, the same mutations affected bioluminescence measured in the presence of CTZ (*p=0.00002; one-way ANOVA; F(6,49)=6.90; n=8 wells each), perhaps by affecting membrane trafficking. This was especially true for the E97R/R120A/D253A triple mutant whose bioluminescence was significantly lower than that of the original SSFLMOCS/DA (*p=0.0003; Dunnett’s multi comparisons; q(7,49)=4.48).
Figure 5.

Non-functional SFLMO for control experiments. a. Microscopic images of HEK cells transfected with SSFLMOCS/DA with the indicated non-functional point mutations in the channel moiety. Fluorescence from the EYFP tag is shown. b and c. Fluorescent (b) and bioluminescent (c) signals from HEK cells transfected with SSFLMOCS/DA with the indicated mutations quantified in a plate reader. n=8 wells each. d. Quantification of photocurrent recorded in HEK cells transfected with SSFLMOCS/DA with the indicated non-functional mutations. n=13, 7, 6, 7, 6, 6, and 8 cells for SSFLMO, E97R, R120A, D253A, ER/DA, RA/DA, and ER/RA/DA, respectively. Representative traces with the original SSFLMOCS/DA and the ones with D253A and ER/DA mutations are shown (inset). Photocurrent was evoked by 480 nm light (422 μW/mm2; blue bar) and subsequently deactivated by 575 nm light (902 μW/mm2; yellow bar).
We then measured photocurrent evoked by a lamp (Fig. 5d, inset). ThThe three single mutations significantly reduced photocurrent compared to SSFLMO without mutations (*p=0.00009; one-way ANOVA followed by Dunnett’s test; F(6,46)=6.13; q(7,46)>3.74; *p<0.003; n=13, 7, 6, 7, 6, 6, and 8 cells for SSFLMO, E97R, R120A, D253A, ER/DA, RA/DA, and ER/RA/DA, respectively; Fig. 5d). Unlike ChR2 without step-function mutations (Kato et al. 2012; Tanimoto et al. 2013), photocurrent with step-function mutations was not completely diminished by any of the single mutations. Thus, we decided to combine mutations by including the most effective single mutation, D253A. Whereas the double mutation of RA/DA exhibited residual photocurrent, D253A combined with E97R with or without R120A completely eliminated photocurrent. For production of control SFLMO viral vectors in the subsequent experiment, we chose ER/DA, but not ER/RA/DA, as the double mutant eliminated photocurrent while maintaining expression comparable to the original SSFLMOCS/DA when assessed with fluorescence and bioluminescence.
Circling behavior induced by bi-modal stimulation of nigral neurons in the rat brain
We further tested the new luminopsin for eliciting specific behavior in rats in vivo. Neurons in the substantia nigra were transduced with SFLMOCS via unilateral stereotaxic injection of a recombinant adeno-associated viral (AAV) vector carrying the gene. Postmortem histology and fluorescent microscopy for the EYFP tag of the luminopsin revealed that transduced neurons were mostly found in the substantia nigra pars compacta (Fig. 6a). Counterstaining of pars reticulata using a GABAergic marker, GAD67, also confirmed that expression of SFLMOCS was largely limited to pars compacta comprised of dopaminergic neurons (Fig. 6b). EYFP fluorescence observed in the striatum was consistent with expression of SFLMOCS in dopaminergic cells as they innervate the striatum (Fig. 6c).
Figure 6.

Circling behavior elicited by unilateral transduction of the substantia nigra with SFLMO in rats. a-c. Postmortem histology showing expression of SFLMOCS in dopaminergic neurons in substantia nigra pars compacta. Expression of SFLMO was predominantly observed as green fluorescence in substantia nigra pars compacta including the dorsal tier (SNC; a). Counterstaining of GABAergic neurons in substantia nigra pars reticulata (SNR) with a GABA marker, GAD67 (red), also confirmed proper targeting of dopaminergic neurons in SNC. The position of the injection cannula for intracranial injection of CTZ is also shown (b). SFLMO expression was also observed in the caudate-putamen (CPu) where dopaminergic cells in SNC project, especially in the axon terminals (arrows; c). Inset shows the fluorescently labeled dopaminergic axons. Distance from the bregma at which sections were obtained is indicated in a and c. ml: medial lemniscus; LV: lateral ventricle; Cx: neocortex. Scale bars: 500 μm (a-c), 50 μm (inset in a), and 100 μm (inset in c). d and e. Intracranial injection of CTZ induced rotations contraversive to the transduced nigra whereas vehicle injection did not (d). Mean number of rotations 5–15 minutes after injection (e). Each rat received injection of a viral vector carrying either the SFLMOCS gene (n=6) or the control ER/DA gene (n=3) and was tested for both vehicle and CTZ on different days. f and g. Photostimulation-induced contraversive rotations. The circling behavior was repeatedly induced by blue light illumination (465 nm; 9.7 mW/mm2) and stopped by yellow light illumination (620 nm; 46 μW/mm2) continuously delivered via fiber optics through the same cannula (f). Mean numbers of rotations before and during photostimulation (g). n=4 sessions (16 photostimulations) with SFLMOCS and n=3 sessions (12 photostimulations) with ER/DA.
We stimulated unilaterally transduced neurons using CTZ by systemic injection via a jugular vein catheter (n=4 rats) or by local injection via an intracranial cannula (n=2 rats). We did not observe any qualitative difference between the two routes and, thus, combined the results. Soon after injection, CTZ caused circling behavior contraversive to the luminopsin-transduced side (Fig. 6d), presumably due to imbalance in neuronal activity between the two sides of the nigra as luminopsin activation was limited to one side. Vehicle injection did not elicit this behavior (Fig. 6d) and contraversive rotations after CTZ injection was significantly more than that after vehicle injection (*p=0.042; one-way ANOVA followed by the Newman-Keuls multiple comparisons; two-tailed paired t-test; F (3,144)=3.63; q(4,14)=3.17 between vehicle and CTZ in SFLMOCS; n=6 and 3 animals with SFLMOCS and ER/DA, respectively;; Fig. 6e). This effect was not observed when the animals were injected with the control vector, ER/DA (p>0.07; Fig. 6e). In addition to CTZ, luminopsins can be alternatively activated by physical light from an external source. The same population of neurons was activated in the same animal by conventional photostimulation via an optical fiber inserted into the same intracranial injection cannula with the tip protruding 0.5 mm from the guide cannula (0.5 mm above the virus injection site). Contraversive rotations were elicited by blue light repeatedly whereas yellow light ceased this effect (Fig. 6f). Contraversive rotations during blue light illumination was significantly more than that without photostimulation (*p=0.0004; one-way ANOVA followed by Tukey’s multi comparisons; F(5,14)=9.49; q(6,14)> 5.51; *p<0.02; n= 4 and 3 sessions (16 and 12 photostimulations in total) for SFLMOCS and ER/DA, respectively) whereas yellow light did not elicit a significant effect compared to control (p>0.99; Tukey’s test; q(6,14)=0.7444; Fig. 6g, SFLMOCS). When the animals were infected with an AAV vector with non-functional ER/DA, photostimulation with blue light did not increase contraversive rotations (p>0.9; Tukey’s test; q(6,14)<1.44; Fig. 6g, ER/DA). Thus, SFLMOs were able to elicit specific behavior in rats and allowed to achieve the same behavioral effect through two different approaches, namely chemogenetics and optogenetics.
DISCUSSION
Here, we successfully incorporated highly light-sensitive SFOs (Fig. 1) into the latest iteration of luminopsins. Primary rat cortical neurons in culture showed robust expression of the new fusion proteins and activation of the opsins by bioluminescence was more than 50% compared to physical light as expected from their superb light sensitivity, which resulted in sustained photocurrent and depolarization (Figs. 2 and 4). When expressed unilaterally in the nigral neurons of rats in vivo, SFLMOs were able to induce comparable contraversive circling behavior upon application of CTZ or physical light (Fig. 6). We have shown in vitro that bioluminescence-induced depolarization with SFLMOs can last significantly longer than that with the previous version of luminopsin, LMO3 (Fig. 4c). In fact, VChR1, which LMO3 is based upon, has a deactivation time constant of 133 ms (Zhang et al. 2008) whereas deactivation time constants of SFOs was much larger (SFOCS: 1.7 minutes; SFODA: 6.9 minutes; SSFOCS/DA: 29 minutes; Yizhar et al. 2011a; Yizhar et al. 2011b). Thus, the decay of bioluminescence-activated SFLMOs in this study (Fig. 4) was consistent with the deactivation kinetics of SFOs when activated by conventional photostimulation. We expect that the new luminopsins behave similarly in awake, behaving animals as well, and, in fact, the effect of SFLMO activation on circling behavior (Fig. 6d) appeared to have lasted longer than that with the previous iteration of LMO, LMO3: When VChR1-based LMO3 was expressed in the substantia nigra of mice, intracranial injection of CTZ caused circling behavior only up to 4 minutes (Berglund et al. 2016). However, a similar assay done with halorhodopsin-based inhibitory iLMO2 expressed in the globus pallidus combined with intravenous injection of CTZ in rats showed significantly increased circling behavior up to 50 minutes (Tung et al. 2015), similar to the current study with excitatory SFLMO albeit with the opposite direction of rotations. We speculate that these similarities and differences in the seemingly simple behavior of rotations reflect complexity of underlying neuroanatomy and neurophysiology in different brain structures in the rodents. The precise time courses of action of SFLMOs in vivo need to be determined in a future study. Thus, the series of experiments in this study establishes and validates the unique utility of these new luminopsins, namely bimodal and sustained activation of the opsin by biological and physical light.
We found that a molecular arrangement as a fusion protein as well as radiationless BRET between the luciferase and opsin moieties are a prerequisite for efficient bioluminescence-mediated activation of the opsin (Fig. 4). Our findings that Gaussia luciferase did not activate the opsin when expressed separately are different from previous reports where co-expressed Firefly or Renilla luciferase appeared to activate Natronomonas halorhodopsin (Land et al. 2014; Tung et al. 2015), although, in these studies, the luciferase-opsin combinations were different from that of the current study and co-expression was not systematically compared to a fusion protein as in this study.
Luminopsins can be compared with chemogenetic probes such as Designer Receptors Exclusively Activated by Designer Drugs (DREADDs), an approach in which activity of neurons is modulated by diffusible artificial ligands and their respective, engineered receptors (Roth 2016). However, luminopsins offer distinct advantages: 1) Luminopsins emit bioluminescence, which can be used as a convenient measure and validation of its activation (Birkner et al. 2014; Tung et al. 2016b); 2) Luminopsins retain the capability to be activated by external light in a conventional optogenetic manner, thus allowing direct comparisons as well as possible downstream benefits of combining the two modes as shown in this study; 3) Unlike DREADDs, which are engineered G protein-coupled receptors, luminopsins do not rely on innate biochemical signaling cascades, and the substrate (CTZ) is completely foreign to non-luminous species. All available toxicological data indicates that CTZ poses no harm to mammals. No cytotoxicity was observed in various mammalian cell lines (except for rat hepatocytes; Dubuisson et al. 2000) at 100 μM (Dubuisson et al. 2005), a concentration similar to the estimated plasma levels when 1 mg of CTZ was injected intravenously in this study (see Methods). Although CTZ and luciferase have been widely used in oncological imaging studies, we are not aware of any publication that reported an adverse effect. In fact, a rodent could be treated with a CTZ derivative with no sign of acute or chronic toxicity at a surprisingly high dosage (>1 g/kg; oral)(Dubuisson et al. 2005). Rather, therapeutic merits of CTZ, a natural antioxidant, have been pursued as bioluminescence is an oxidation process (Dubuisson et al. 2005). On the other hand, Clozapine-N-oxide (CNO), a DREADD agonist, is metabolized to the anti-psychotic drug, Clozapine, in rats (MacLaren et al. 2016) as well as in monkeys and humans (Chang et al. 1998; Raper et al. 2017). It has recently been shown that this metabolically derived Clozapine, rather than the injected CNO, is actually activating DREADDs in vivo (Gomez et al. 2017). Chronic treatment with CNO may be particularly problematic as, with its long half-life, Clozapine may accumulate and have psychotropic effects in animals and humans (McOmish et al. 2012; Roth 2016); 4) Numerous combinations of different opsins and luciferases can rapidly expand the luminopsin toolbox to fulfill diverse experimental needs, capitalizing on continuously evolving optogenetic probes and luciferases. In fact, in this study, we were able to incorporate opsins with unique properties into new luminopsins. One practical drawback of CTZ compared to CNO is its price. Although we used intraperitoneal injection with CTZ in mice in the past, this route of administration is cost-prohibitive in rats as it requires more CTZ due to their larger body size. To deliver concentrated CTZ into the brain, we used injection through intracranial cannula or jugular vein catheter in this study. In addition, we used higher concentrations of CTZ in vivo for intracranial injection (1 mM) than in vitro (100 μM) as we could not be certain to what extent the CTZ solution would be diluted before reaching the target.
One interesting avenue for future developments of SFLMOs is to add functionality to be stopped by bioluminescence of longer wavelength, similar to the electrophysiological experiments in this study where photocurrent or bioluminescence-induced depolarization was ceased by physical light of longer wavelength (Figs. 2c and 4a). This may be realized by utilizing a luciferase that emits green or yellow bioluminescence upon catalyzing a luciferin other than CTZ, such as Firefly luciferase and NanoLuc that catalyze D-luciferin and furimazine, respectively. In this regard, NanoLuc variants that emit bioluminescence of various colors are suitable (enhanced Nano-lanterns or eNLs; Suzuki et al. 2016). With such a luminopsin, CTZ will start activation of target neurons while subsequent injection of another substrate will stop the effect, adding temporal control of the chemogenetic probe. A green- or yellow-emitting eNL can be conveniently fused to the C-terminus of an SFLMO by replacing the EYFP tag. This configuration will ensure proximity of the opsin and the green or yellow fluorescent protein moiety in eNL, which may help efficient energy transfer from eNL to SFO for deactivation.
Optogenetics has shown promising results in treating rodent models of various psychiatric and neurological diseases including epilepsy (for review, Tung et al. 2016a). SSFOCS/DA, when expressed in the ventrobasal complex of the thalamus, can bidirectionally control epileptic networks and prevent seizures by switching the firing mode of thalamocortical neurons from burst firing to tonic firing (Sorokin et al. 2017). SSFLMOCS/DA, as described in this study, can serve the exact same purpose with the added feature of non-invasive activation by CTZ.
SIGNIFICANCE STATEMENT.
The step-function variants of luminopsins engineered in this study provide versatile and practical utility in controlling activity of neurons or other excitable cells for functional interrogation or therapeutic purposes.
OTHER ACKNOWLEDGEMENTS
We thank Jack K. Tung, Emory University School of Medicine, for participating in the early stage of this study, E. Reice Robinson for technical help on generation of mutant SFLMOs, and Keiichi Inoue, Nagoya Institute of Technology, for helpful discussion.
Grant information: This work was supported by NIH grants NS085568 (REG), NS079268 (REG), NS079757 (REG), MH101525 (UH), NS099709 (UH), NSF CBET-1512826 (KB/REG), CBET-1464686 (UH), and the Mirowski Family Foundation (REG). The automated behavioral device (Raturn and Activity Monitor) used in this study was awarded by Bioanalytical Systems, Inc. (BASi), West Lafayette, IN.
Footnotes
CONFLICT OF INTEREST
The automated behavioral device (Raturn and Activity Monitor) used in this study was awarded by Bioanalytical Systems, Inc. (BASi), West Lafayette, IN.
REFERENCES
- Bamann C, Gueta R, Kleinlogel S, Nagel G, Bamberg E. 2010. Structural guidance of the photocycle of channelrhodopsin-2 by an interhelical hydrogen bond. Biochemistry 49(2):267–278. [DOI] [PubMed] [Google Scholar]
- Berglund K, Birkner E, Augustine GJ, Hochgeschwender U. 2013. Light-emitting channelrhodopsins for combined optogenetic and chemical-genetic control of neurons. PLOS ONE 8(3):e59759. [DOI] [PMC free article] [PubMed] [Google Scholar]
- Berglund K, Clissold K, Li HE, Wen L, Park SY, Gleixner J, Klein ME, Lu D, Barter JW, Rossi MA, Augustine GJ, Yin HH, Hochgeschwender U. 2016. Luminopsins integrate opto- and chemogenetics by using physical and biological light sources for opsin activation. Proceedings of the National Academy of Sciences 113(3):E358–E367. [DOI] [PMC free article] [PubMed] [Google Scholar]
- Berndt A, Yizhar O, Gunaydin LA, Hegemann P, Deisseroth K. 2009. Bi-stable neural state switches. Nat Neurosci 12(2):229–234. [DOI] [PubMed] [Google Scholar]
- Birkner E, Berglund K, Klein ME, Augustine GJ, Hochgeschwender U. 2014. Non-invasive activation of optogenetic actuators. SPIE BiOS 8928:89282F-89282F–89289. [DOI] [PMC free article] [PubMed] [Google Scholar]
- Chang W-H, Lin S-K, Lane H-Y, Wei F-C, Hu W-H, Lam YF, Jann MW. 1998. Reversible metabolism of clozapine and clozapine N-oxide in schizophrenic patients. Progress in Neuro-Psychopharmacology and Biological Psychiatry 22(5):723–739. [DOI] [PubMed] [Google Scholar]
- Dubuisson MLN, Rees JF, Marchand-Brynaert J. 2005. Coelenterazine (marine bioluminescent substrate): A source of inspiration for the discovery of novel antioxidants. Drug Development and Industrial Pharmacy 31(9):827–849. [DOI] [PubMed] [Google Scholar]
- Dubuisson MLN, Wergifosse Bd, Trouet A, Baguet F, Marchand-Brynaert J, Rees J-F. 2000. Antioxidative properties of natural coelenterazine and synthetic methyl coelenterazine in rat hepatocytes subjected to tert-butyl hydroperoxide-induced oxidative stress. Biochemical Pharmacology 60(4):471–478. [DOI] [PubMed] [Google Scholar]
- Fenno L, Yizhar O, Deisseroth K. 2011. The development and application of optogenetics. Annual Review of Neuroscience 34(1):389–412. [DOI] [PMC free article] [PubMed] [Google Scholar]
- Gomez JL, Bonaventura J, Lesniak W, Mathews WB, Sysa-Shah P, Rodriguez LA, Ellis RJ, Richie CT, Harvey BK, Dannals RF, Pomper MG, Bonci A, Michaelides M. 2017. Chemogenetics revealed: DREADD occupancy and activation via converted clozapine. Science 357(6350):503–507. [DOI] [PMC free article] [PubMed] [Google Scholar]
- Guo P, El-Gohary Y, Prasadan K, Shiota C, Xiao X, Wiersch J, Paredes J, Tulachan S, Gittes GK. 2012. Rapid and simplified purification of recombinant adeno-associated virus. J Virol Methods 183(2):139–146. [DOI] [PMC free article] [PubMed] [Google Scholar]
- Inoue K, Ito S, Kato Y, Nomura Y, Shibata M, Uchihashi T, Tsunoda SP, Kandori H. 2016. A natural light-driven inward proton pump. Nature Communications 7:13415. [DOI] [PMC free article] [PubMed] [Google Scholar]
- Katayama K, Furutani Y, Kandori H. 2010. FTIR study of the photoreaction of bovine rhodopsin in the presence of hydroxylamine. The Journal of Physical Chemistry B 114(27):9039–9046. [DOI] [PubMed] [Google Scholar]
- Kato HE, Zhang F, Yizhar O, Ramakrishnan C, Nishizawa T, Hirata K, Ito J, Aita Y, Tsukazaki T, Hayashi S, Hegemann P, Maturana AD, Ishitani R, Deisseroth K, Nureki O. 2012. Crystal structure of the channelrhodopsin light-gated cation channel. Nature 482:369. [DOI] [PMC free article] [PubMed] [Google Scholar]
- Land B, Brayton C, Furman K, LaPalombara Z, DiLeone R. 2014. Optogenetic inhibition of neurons by internal light production. Frontiers in Behavioral Neuroscience 8(108). [DOI] [PMC free article] [PubMed] [Google Scholar]
- Lee HB, Blaufox MD. 1985. Blood volume in the rat. Journal of Nuclear Medicine 26(1):72–76. [PubMed] [Google Scholar]
- MacLaren DAA, Browne RW, Shaw JK, Krishnan Radhakrishnan S, Khare P, Espana RA, Clark SD. 2016. Clozapine N-oxide administration produces behavioral effects in Long-Evans rats: Implications for designing DREADD experiments. eneuro 3(5). [DOI] [PMC free article] [PubMed] [Google Scholar]
- McOmish CE, Lira A, Hanks JB, Gingrich JA. 2012. Clozapine-induced locomotor suppression is mediated by 5-HT2A receptors in the forebrain. Neuropsychopharmacology 37(13):2747–2755. [DOI] [PMC free article] [PubMed] [Google Scholar]
- Nagel G, Szellas T, Huhn W, Kateriya S, Adeishvili N, Berthold P, Ollig D, Hegemann P, Bamberg E. 2003. Channelrhodopsin-2, a directly light-gated cation-selective membrane channel. Proceedings of the National Academy of Sciences 100(24):13940–13945. [DOI] [PMC free article] [PubMed] [Google Scholar]
- Raper J, Morrison RD, Daniels JS, Howell L, Bachevalier J, Wichmann T, Galvan A. 2017. Metabolism and distribution of Clozapine-N-oxide: Implications for nonhuman primate chemogenetics. ACS Chemical Neuroscience 8(7):1570–1576. [DOI] [PMC free article] [PubMed] [Google Scholar]
- Roth BL. 2016. DREADDs for neuroscientists. Neuron 89(4):683–694. [DOI] [PMC free article] [PubMed] [Google Scholar]
- Sorokin JM, Davidson TJ, Frechette E, Abramian AM, Deisseroth K, Huguenard JR, Paz JT. 2017. Bidirectional control of generalized epilepsy networks via rapid real-time switching of firing mode. Neuron 93(1):194–210. [DOI] [PMC free article] [PubMed] [Google Scholar]
- Suzuki K, Kimura T, Shinoda H, Bai G, Daniels MJ, Arai Y, Nakano M, Nagai T. 2016. Five colour variants of bright luminescent protein for real-time multicolour bioimaging. Nature Communications 7:13718. [DOI] [PMC free article] [PubMed] [Google Scholar]
- Tanimoto S, Sugiyama Y, Takahashi T, Ishizuka T, Yawo H. 2013. Involvement of glutamate 97 in ion influx through photo-activated channelrhodopsin-2. Neuroscience Research 75(1):13–22. [DOI] [PubMed] [Google Scholar]
- Tung JK, Berglund K, Gross RE. 2016a. Optogenetic approaches for controlling seizure activity. Brain Stimulation: Basic, Translational, and Clinical Research in Neuromodulation 9(6):801–810. [DOI] [PMC free article] [PubMed] [Google Scholar]
- Tung JK, Berglund K, Gutekunst CA, Hochgeschwender U, Gross RE. 2016b. Bioluminescence imaging in live cells and animals. Neurophotonics 3(2):025001. [DOI] [PMC free article] [PubMed] [Google Scholar]
- Tung JK, Gutekunst C-A, Gross RE. 2015. Inhibitory luminopsins: genetically-encoded bioluminescent opsins for versatile, scalable, and hardware-independent optogenetic inhibition. Scientific Reports 5:14366. [DOI] [PMC free article] [PubMed] [Google Scholar]
- Volkov O, Kovalev K, Polovinkin V, Borshchevskiy V, Bamann C, Astashkin R, Marin E, Popov A, Balandin T, Willbold D, Buldt G, Bamberg E, Gordeliy V. 2017. Structural insights into ion conduction by channelrhodopsin 2. Science 358(6366). [DOI] [PubMed] [Google Scholar]
- Welsh JP, Patel KG, Manthiram K, Swartz JR. 2009. Multiply mutated Gaussia luciferases provide prolonged and intense bioluminescence. Biochemical and Biophysical Research Communications 389(4):563–568. [DOI] [PubMed] [Google Scholar]
- Yizhar O, Fenno Lief E, Davidson Thomas J, Mogri M, Deisseroth K. 2011a. Optogenetics in neural systems. Neuron 71(1):9–34. [DOI] [PubMed] [Google Scholar]
- Yizhar O, Fenno LE, Prigge M, Schneider F, Davidson TJ, O’Shea DJ, Sohal VS, Goshen I, Finkelstein J, Paz JT, Stehfest K, Fudim R, Ramakrishnan C, Huguenard JR, Hegemann P, Deisseroth K. 2011b. Neocortical excitation/inhibition balance in information processing and social dysfunction. Nature 477(7363):171–178. [DOI] [PMC free article] [PubMed] [Google Scholar]
- Zhang F, Prigge M, Beyriere F, Tsunoda SP, Mattis J, Yizhar O, Hegemann P, Deisseroth K. 2008. Red-shifted optogenetic excitation: a tool for fast neural control derived from Volvox carteri. Nature Neuroscience 11:631. [DOI] [PMC free article] [PubMed] [Google Scholar]