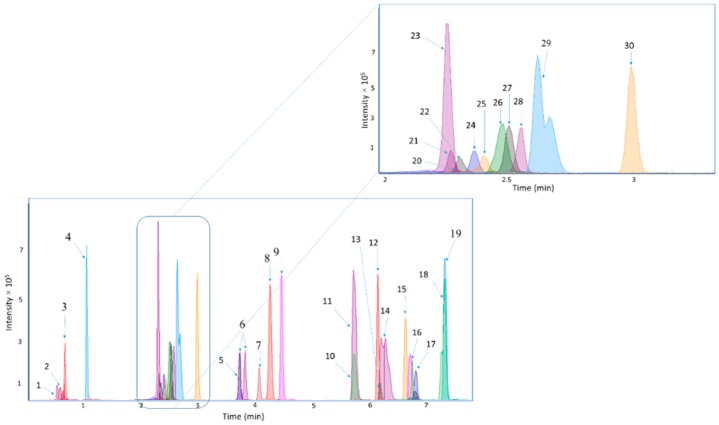
Figure 1.
Chromatograms representing the chromatographic separation of the analytes. The peak numbers correspond to the following analytes: (1) Crea, (2) GBB, (3) β-OHB, (4) N-MNA, (4) Kynu, (6) Leu and Ile, (7) Phe, (8) AzelA, (9) Trp, (10) TUDCA, (11) TCA, (12) GCA, (13) GUDCA, (14) TDCA and TCDCA, (15) CA, (16) CDCA, (17) GCDCA and GDCA, (18) UDCA, (19) DCA, (20) Gly, (21) Gln, (22) ADMA and SDMA, (23) taurine, (24) Phe, (25) Gln, (26) HCit, (27) Ala, (28) AADA, (29) IndS and (30) Tyr.

