

Abstract
Tumor associated macrophages (TAMs) in tumor microenvironment can interact with tumor cells and are related to tumor progression. However, the mechanisms that drive the anti-tumor functions of TAMs are not fully understood. The Src homology 2 domain-containing tyrosine phosphatase 2 (Shp2) has been reported to have tumor-suppressing roles in colorectal cancer (CRC). However, a role for Shp2 on TAMs in CRC has not been studied. Here we report that in CRC, Shp2 expression on TAMs is negatively associated with liver metastasis. TAMs require Shp2 for their anti-tumor functions in a cell-cell co-culture system and a mouse model of CRC. Mechanistically, absence of Shp2 on TAMs induces their polarization toward M2 phenotype through the activation of p-STAT3 and inhibition of p-NF-κB p65. The findings of our study imply that Shp2 is a key factor in the tumor microenvironment to facilitate the TAMs’ tumor-suppressing functions in colorectal cancer.
Keywords: Tumor-associated macrophages, protein-tyrosine phosphatase Shp2, colorectal cancer, macrophage polarization, liver metastasis
Introduction
Tumor microenvironment (TME) is a population of cells constituted with tumor cells and various stromal cells recruited by tumor cells including T cells, macrophages, fibroblasts and so on [1]. Tumor cells and stromal cells interact many ways either favor or hinder tumor progression [2,3]. Tumor-associated macrophages (TAMs) are an important portion of the stromal cells infiltrating in the TME [4]. TAMs are characterized by the high functional plasticity which makes them controllable targets for anticancer therapy, through either their ablation or their polarization from pro-tumoral towards anti-tumoral states. Depending on their microenvironment, macrophages can be polarized into two distinct functional phenotypes: M1-like (classically activated) TAMs or M2-like (alternatively activated) TAMs [5]. M1-like TAMs have classically been regarded as tumor suppressors and M2-like TAMs as tumor promoters. In general, M1 macrophages secret high levels of IL-6, IL-12, TNF-α and inducible NO synthase (iNOS) which promotes host immune response against invading bacteria. In contrast, M2 macrophages produce high levels of IL-10, arginase 1 (Arg1), chitinase 3-like protein 3 (Chi3l3, YM-1) and resistin-like α (Retnla, Fizz1) which contributes to the anti-inflammatory response, wound healing, and pro-tumoral activities [6,7]. Thus, inhibiting TAMs polarization into M2 phenotype and/or promoting polarization into M1 phenotype might be a promising target for cancer treatment.
Colorectal cancer (CRC) is the third most common cancer in the world [8]. In CRC, TAMs can be recruited to the tumor sites by several chemokines such as CCL2, CCL5, VEGF and CSF-1 [9]. While the role of TAMs in CRC is still controversial, some studies reported that high density of TAMs is associated with tumor progression, angiogenesis, epithelial-to-mesenchymal transition (EMT) and unfavorable prognosis [10,11]. On the contrary, other studies indicated that TAMs have the anti-tumor effects and are associated with the improved disease-free survival [12-14]. Till now, the mechanism behind the potential anti-tumor effects of TAMs has not been clarified.
The Src homology 2 domain-containing tyrosine phosphatase 2 (Shp2), is a non-receptor tyrosine phosphatase encoded by PTPN11 gene. In CRC, Shp2 has been reported to inhibit CRC cells proliferation and migration. Low Shp2 expression is correlated with poor tumor differentiation and TNM stage, for which negatively regulating of STAT3 phosphorylation is involved [15,16]. Considering the importance of Shp2 in regulating macrophages function and polarization, it is of interesting to explore the regulatory role for Shp2 in the scenario of TAMs in CRC TME. The aim of the present study was to evaluate the role of Shp2 on TAMs in the CRC progression and its related mechanisms. We revealed that TAMs in CRC depend on Shp2 for their anti-tumor roles in colorectal cancer through the regulation of macrophage polarization.
Materials and methods
Human CRC samples
A total of 81 human CRC tumor tissues confirmed by pathological diagnosis were obtained for immunohistochemistry from the First Affiliated Hospital, Zhejiang University School of Medicine (Hangzhou, China) from October 2010 to October 2013. All specimens were obtained from patients who had not received any chemotherapy or radiotherapy before surgery. All patients in this work have been followed up until death or to five years after surgery. The following characteristics were recorded: age, gender, tumor location, TNM stage, tumor differentiation and serum levels of carcinoembryonic antigen (CEA) before surgery. The study was approved by the Human Experimental Ethical Inspection of the First Affiliated Hospital and the informed consent of patients was acquired.
Immunohistochemistry and evaluation
Immunohistochemistry was performed by Google Biotechnology Co. LTD (Wuhan, China) to detect the expression of Shp2 and CD68. Briefly, formalin-fixed, paraffin-embedded tissue sections were consecutively cut into 4-μm slices before exposed to the mouse monoclonal antibody against Shp2 (1:500, sc-7384; Santa Cruz) and CD68 (1:500, 66231-2-Ig; Proteintech), respectively overnight at 4°C. After washing with phosphate-buffered saline (PBS), the sections were incubated with second antibody for 30 min followed by washing with PBS. Finally, the sections were visualized by diaminobenzidine solution and counterstained with hematoxylin. Negative controls were performed with the incubation with rabbit IgG instead of primary antibody.
Two investigators (YYY and HXL) who were blinded to the clinical-pathological data evaluated the immunohistochemical staining independently. The macrophages’ immunostaining of Shp2 protein was graded as follows-Low expression is defined as the percentage of Shp2 positive TAMs ≤ 50%, high expression is defined as the percentage of Shp2 positive TAMs > 50%.
Animals and models
5-6-week-old female BALB/c nude mice weighing between 18-20 g or 6-8-week old female C57BL/6 mice were purchased from Shanghai Laboratory Animal Company (SLAC; Shanghai, China) and maintained in the animal facility at Zhejiang University. Shp2flox/flox mice were crossed with LysMCre/+ mice to generate myeloid Shp2 conditional knock-out mice. LysMCre/+ or Shp2flox/flox (Shp2MWT) and LysMCre/+: Shp2flox/flox mutant (Shp2MKO) mice were used in the experiments. Mice were provided with water and food ad libitum and kept under standard conditions (temperature 24 ± 2°C, humidity, 50-70%, 12-h light/dark cycle). All animal experiments were performed in accordance with the Guide for the Care and Use of Laboratory Animals and were approved by the Animal Care and Use Committee at Zhejiang University.
To establish the subcutaneous CRC model, CT26 cells (1 × 10⁶) resuspended in 100 μL PBS were injected into the right flanks of nude mice. 3 weeks after cells implantation, mice were euthanasiad, tumors and spleens were collected for macrophages isolation.
To establish the liver metastasis model, nude mice were intravenously injected with clodronate liposomes (200 μL/mouse, Formu Max Scientific, Sunnyvale, USA) 48 hours before cells injection to deplete macrophages. Then mice were anesthetized with 1.5% pentobarbital by intra-peritoneal injection, fixed and then a small left abdominal flank incision (1 cm) was made and the spleen was exteriorized for the intra-splenic injection. 5 × 10⁶ cells mixture (CT26 cells and BMDMs which had been direct co-cultured for 24 hours (BMDMs: CRC 1:1)) suspended in 100 μL ice-cold PBS were injected into the spleen with a 27-gauge needle. A sterile cotton was held over the site of injection for 30 seconds to prevent cells leakage and bleeding. Then the spleen was returned to the abdomen and the wound was sutured with 5-0 black silk. After 25 days, mice were sacrificed, livers and spleens were harvested, and numbers of liver metastases were enumerated. H&E staining was performed on livers by Google Biotechnology Co., Ltd. (Wuhan, China).
Cells and direct/indirect co-culture
Mouse CRC cell lines CT26 and MC38 were purchased from Shanghai Institution for Biological Science (Shanghai, China). Human monocytic leukemia cell line Thp-1 cells and human CRC cell line LoVo were bought from American Type Culture Collection. All the cells were cultured in RPMI-1640 medium complemented with 10% heat-inactivated fetal bovine serum (FBS), penicillin/streptomycin (100 U/ml) and L-glutamine (2 nM). Thp-1 cells were stimulated with 20 ng/mL phorbol 12-myristate 13-acetate (PMA; Sigma-Aldrich, St. Louis, MO, USA) for 48 hours to induce the cells to differentiate into macrophages before the experiment. Primary bone marrow-derived macrophages (BMDMs) derived from wildtype C57BL/6, Shp2MWT or Shp2MKO mice were cultured in complete RPMI1640 with 10 ng/mL M-CSF (PeproTech, Rocky Hill, NJ, USA) for 7 days. Cells were cultured at 37°C with 5% CO2 in a humid incubator. All cell culture reagents were purchased from Invitrogen (Shanghai, China).
For direct co-culture: After culturing of BMDMs for 7 days, CRC cells were trypsined and re-suspended onto the BMDMs (BMDMs: CRC 1:1). After co-culturing for the indicated times, cells were collected for macrophages isolation.
For indirect co-culture: transwell chambers (Corning, Cambridge, MA, USA) containing 6.5 mm-diameter polycarbonate filters (1 μm pore) were used. Macrophages were seeded on the lower compartments, and CRC cells (BMDMs: CRC 1:1) were cultured on the upper compartments. Cells were collected at the indicated times after co-culture for the next experiments.
CT26 cells conditioned medium stimulation
CT26 cells were cultured in serum-free RPMI-1640 for 24 hours, and then the supernatants were harvested as conditioned medium (CM). BMDMs were stimulated by CM for the indicated times.
Macrophages isolation
Subcutaneously tumors or spleens extracted from mice or cells mixture after direct co-culture were collected for macrophages isolation. Then, F4/80 positive macrophages were sorted with Anti-F4/80 MicroBeads UltraPure (130-110-443, Miltenyi Biotec) according to the manufacturer’s instructions for manual separation. The separated macrophages or CRC cells were directly subjected to mRNA extraction for RT-qPCR or protein extraction for western blotting.
RNA extraction and RT-qPCR
Total RNA was extracted with Ultrapure RNA Kit (CW Biotech, Beijing, China). First-strand cDNA was synthesized by reverse transcriptase PCR with 1 μg of total RNA (DNase-treated) using an iScript cDNA synthesis kit (Bio-Rad) according to the manufacturer’s instructions. qPCR was then performed with 1 μL of cDNA with the iTaq Universal SYBR Green Supermix (Bio-Rad) on the CFX96 Touch Real-Time PCR Detection System (Bio-Rad). The primer sequences used to detect Shp2, MMP2, MMP3, MMP9, iNOS, IL-6, TNF-α, Arg-1, Fizz1, YM-1, IL-10 and β-actin are listed in Table 1. qPCR results were analyzed with the relative quantification Delta delta CT (2-ΔΔCq) strategy. The calculated threshold cycle was normalized to the value of internal β-actin amplified from the same cDNA and the fold-change was calculated as referenced to control.
Table 1.
Sequences of primers used for RT-qPCR
| Gene Name | Forward Primer | Reverse Primer |
|---|---|---|
| mShp2 | AGAGGGAAGAGCAAATGTGTCA | CTGTGTTTCCTTGTCCGACCT |
| hShp2 | AAAGGGGAGAGCAATGACGG | CTCCACCAACGTCGTATTTCA |
| MMP2 | ACCTGAACACTTTCTATGGCTG | CTTCCGCATGGTCTCGATG |
| MMP3 | GGCCTGGAACAGTCTTGGC | TGTCCATCGTTCATCATCGTCA |
| MMP9 | GCAGAGGCATACTTGTACCG | TGATGTTATGATGGTCCCACTTG |
| iNOS | GTTCTCAGCCCAACAATACAAGA | GTGGACGGGTCGATGTCAC |
| IL-6 | CTGCAAGAGACTTCCATCCAG | AGTGGTATAGACAGGTCTGTTGG |
| TNF-α | CAGGCGGTGCCTATGTCTC | CGATCACCCCGAAGTTCAGTAG |
| Arg-1 | CTCCAAGCCAAAGTCCTTAGAG | GGAGCTGTCATTAGGGACATCA |
| Fizz1 | CCAATCCAGCTAACTATCCCTCC | ACCCAGTAGCAGTCATCCCA |
| YM-1 | CAGGTCTGGCAATTCTTCTGAA | GTCTTGCTCATGTGTGTAAGTGA |
| IL-10 | CTTACTGACTGGCATGAGGATCA | GCAGCTCTAGGAGCATGTGG |
| β-actin | GTGACGTTGACATCCGTAAAGA | GCCGGACTCATCGTACTCC |
Western blotting
Cells were lysed in 1 × RIPA buffer (CST, Danvers, MA, USA) containing 1 mM phenylmethylsulfonyl fluoride (PMSF) (CST) and protease inhibitor cocktail. Protein concentration was determined using the Bradford protein assay. For western blotting, 20-30 μg of lysate was separated by electrophoresis using PAGE gels (10%) and transferred to PVDF membranes. After blocking with 5% non-fat dry milk, membranes were incubated overnight at 4°C with the following primary antibodies: anti-Shp2 (sc-7384; Santa Cruz), anti-GAPDH (#60004-1-I g) anti-MMP2 (#10373-2-AP), anti-MMP3 (#17873-1-AP), anti-MMP9 (#10375-2-AP; all from Proteintech, Wuhan, China), anti-p-NK-κB p65 (#3039), anti-NK-κB p65 (#8242), anti-p-STAT3 (#9145), anti-p-ERK (#4370), anti-ERK (#4695), anti-p-p38 (#9211), anti-p38 (#9212), anti-p-JNK (#4668), anti-JNK (#9252), anti-p-STAT1 (#9167), anti-STAT1 (#9172), anti-p-AKT (#4060) and anti-AKT (#4691; all from CST). Secondary HRP-conjugated anti-mouse or anti-rabbit (Lianke, Hangzhou, China) were applied for 1 hour at room temperature followed by signal detection using FluorChem E System (Protein Simple, Santa Clara, CA, USA). Densitometric analysis was performed with Image J software. The density for each band was normalized to that of GAPDH. The relative protein expression of each protein was compared to the control, which was assigned a value of 1.
Transwell migration and invasion assay
For migration and invasion assay, transwell chamber with 24-well, 8.0-μm pore membranes (Corning Costar Corp., Cambridge, MA, USA) was used. For invasion assay, the upper surfaces of the membranes were coated with 50 µL Matrigel (BD Biosciences) 6 hours before CRC cells were seeded. Briefly, 1 × 10⁵ BMDMs in 600 μL of complete medium were plated in the lower chamber. Then 1 × 10⁵ CRC cells were seeded in the upper chamber in 100 μL of serum-free medium. After incubated for 36 hours in the incubator, the cells remaining at the upper surface of the membrane were removed with cotton swabs, and the cells on the lower surface of the membrane are the migrated or the invaded cells. After fixed with ice-cold methanol, stained with 0.1% crystal violet, the cells that passed through the filter were photographed by inverted microscope.
For Shp2 inhibition, BMDMs were pre-treated with the Shp2-specific pharmacological inhibitor PHPS1 (20 μM) (Santa Cruz Biotechnology, CA, USA) or vehicle (DMSO) for 1 hour and then replaced with the complete medium.
For inhibition of STAT3 or activation of NF-κB, BMDMs in the lower chamber were pre-treated with AG490 (Beyotime Institute of Biotechnology, Shanghai, China)) at 100 µM for 1 hour or PMA at 20 ng/mL for 6 hours followed by the medium was replaced with the complete medium.
ELISA assay
CT26 cells were direct or indirect co-cultured with BMDMs from Shp2MWT or Shp2MKO mice for 24 or 48 hours before supernatants were collected. The concentrations of IL-6, TNF-α and IL-10 was determined with ELISA assays (R&D Systems, Shanghai, China) according to the manufacture’s protocols.
Cells stimulation
BMDMs were either stimulated with LPS (10 ng/mL) plus IFN-γ (20 ng/mL) or IL-4 (20 ng/mL) for 24 hours before RNA or proteins were extracted to determine the Shp2 expression.
Statistical analysis
Data are expressed as means ± SEM and analyzed using GraphPad Prism 5 (GraphPad InStat Software, San Diego, CA, USA). Significance of differences between the two independent groups was determined by the two-tailed Student’s t-test. The Kaplan-Meier method was applied to estimate patient overall survival. The log-rank test was performed to evaluate the survival differences. The relationship between Shp2 expression on TAMs and CRC clinical features was analyzed with the Chi-square test. P-value < 0.05 was considered statistically significant.
Results
In patients with colorectal cancer, Shp2 expression on TAMs is negatively associated with liver metastasis
Before investigating the potential role of Shp2 on macrophages in the tumor microenvironment (TME) in colorectal cancer (CRC), we examined its expression in CRC tissues. Immunohistochemical expressions of Shp2 and CD68, a cell marker for macrophages in consecutive sections of CRC tissues were evaluated. We graded the macrophages’ immunostaining of Shp2 protein according to the percentage of Shp2 positive-staining numbers of CD68 per high power field. Less than 50% was defined as low expression and more than that was defined as high. Figure 1A shows representative IHC staining of high Shp2 (upper panel) and low Shp2 expressions (down panel) on TAMs. The results showed 41 CRC patients (50.6%) had low Shp2 expression. Moreover, the association between Shp2 expression on TAMs and the clinical parameters was investigated. As shown in Table 2, the Shp2 expression levels on TAMs was significantly correlated with liver metastasis (P < 0.0001) and CEA level (P = 0.0027).
Figure 1.
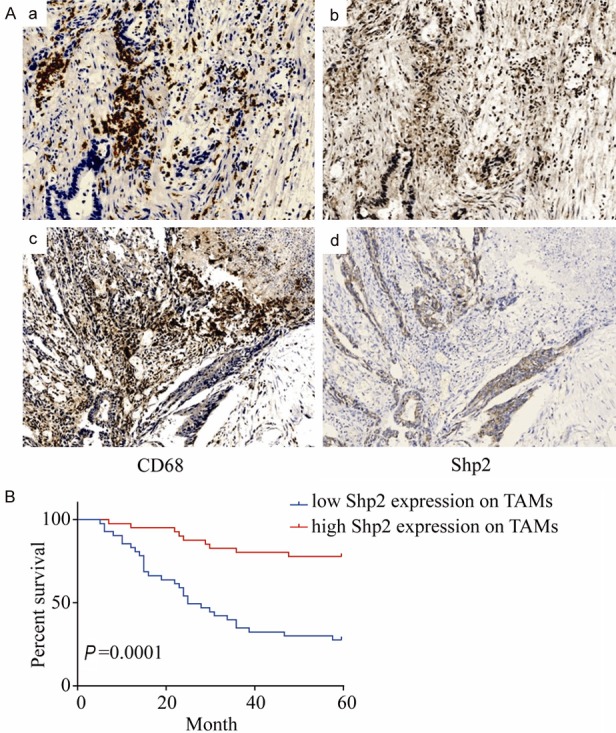
Shp2 expression on TAMs in colorectal cancer is associated with liver metastasis and is a favorable prognostic factor. (A) Immunohistochemical staining for CD68 and Shp2 in consecutive sections of colorectal cancer tissues. Patient A with no liver metastasis shows strong staining of Shp2 (b) in CD68 positive staining (a) sections of CRC. Patient B with liver metastasis shows weak staining of shp2 (d) in CD68 positive staining (c) sections of CRC. (magnification × 200). (B) Relationship between Shp2 expression on TAMs and survival rates in the detected human colorectal cancer patients. Patients with low Shp2 expression on TAMs had significantly poorer prognosis than those with high Shp2 expression on TAMs (P < 0.0001).
Table 2.
Clinicopathologic characteristics of shp2 expression on TAMs in human CRC
| Characteristics | Shp2 Expression levels in TAMs | χ2 | P-value | |
|---|---|---|---|---|
|
| ||||
| Low (n = 41) | High (n = 40) | |||
| Age | 0.01 | 0.92 | ||
| ≥ 60 | 22 | 21 | ||
| < 60 | 19 | 19 | ||
| Gender | 2.171 | 0.14 | ||
| Female | 21 | 14 | ||
| Male | 20 | 26 | ||
| T factor | 0.51 | 0.47 | ||
| T1+T2 | 4 | 6 | ||
| T3+T4 | 37 | 34 | ||
| N factor | 1.48 | 0.22 | ||
| N0 | 16 | 21 | ||
| N1+N2 | 25 | 19 | ||
| M factor | 37.37 | < 0.0001 | ||
| M0 | 7 | 34 | ||
| M1 | 34 | 6 | ||
| Differentiation | 0.99 | 0.61 | ||
| Well | 1 | 0 | ||
| Moderate | 20 | 20 | ||
| Poor | 20 | 20 | ||
| Tumor location | 3.6 | 0.059 | ||
| Rectal | 15 | 23 | ||
| Colon | 26 | 17 | ||
| CEA (ng/ml) | 9.01 | 0.0027 | ||
| ≥ 5 | 29 | 15 | ||
| < 5 | 12 | 25 | ||
The 5-year survival rate was 76.74% in the CRC patients with high Shp2 expression on TAMs in their primary lesions, whereas the 5-year survival rate of the patients with low Shp2 expression was significantly lower (23.68%) (Figure 1B).
In TME, CRC cells upregulate Shp2 expression on macrophages
To assess the expression of Shp2 on TAMs, we first used the colon cancer mouse cell line CT26 to subcutaneously injected into the nude mice and macrophages were isolated either from tumors or spleens. As shown in Figure 2A, high expression of Shp2 was detected in tumor macrophages whereas splenic macrophages expressed low levels of Shp2. We also determined the Shp2 expression on BMDMs after direct co-cultured with CT26 cells (Figure 2B). In consistent with the in vivo results, TAMs expressed high levels of Shp2. So as Thp-1 cells or BMDMs after indirect co-cultured with another human colon cancer cell line LoVo cells or CT26 cells (Figure 2C). Furthermore, Shp2 expression was also up-regulated on BMDMs stimulated with CT26 cell culture supernatants (Figure 2D). Together, these results imply that in TME, CRC might have an impact on Shp2 expression on TAMs.
Figure 2.
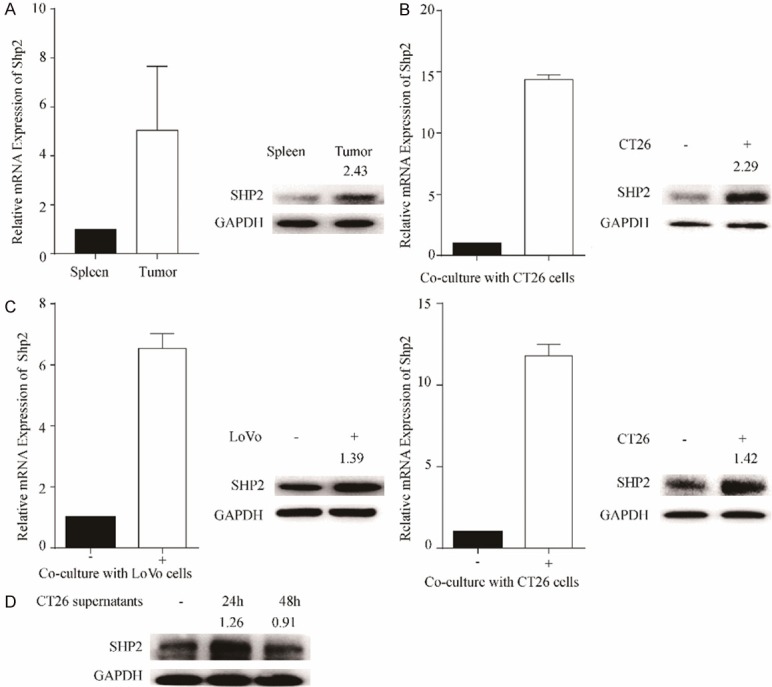
In TME, CRC cells upregulate Shp2 expression on macrophages. A. CT26 cells were injected into the right flanks of nude mice. 3 weeks later, mice were euthanasiad, tumors and spleens were collected for macrophages isolation. The mRNA and protein expression of Shp2 in isolated macrophages were determined by RT-qPCR and western blotting, respectively. Results were obtained from 2 independent experiments and are expressed as the means ± SEM. B. BMDMs were direct co-cultured with CT26 cells for 36 hours before macrophages were isolated to determine the Shp2 mRNA and protein expression. C. Thp-1 cells or BMDMs were indirect co-cultured with LoVo cells or CT26 cells, respectively for 36 hours. The mRNA and protein expression of Shp2 in Thp-1 cells or BMDMs were determined by RT-qPCR and western blotting, respectively. D. BMDMs were stimulated with CT26 conditioned medium for 24 or 48 hours before cells were collected for western blotting to determine the Shp2 expression. Results were obtained from 3 independent experiments and are expressed as the means ± SEM.
To test the Shp2 expression in M1 and M2 TAMs, we first detected the polarization of BMDMs after co-cultured with CRC cells which the expression of Shp2 was upregulated. As shown in Supplementary Figure 1A, macrophages have no clear polarization after co-cultured with CT-26 cells. Then we checked the Shp2 expression in macrophages stimulation either with LPS plus IFN-γ or IL-4 which differentiated to M1 or M2 macrophages. 24 hours later, RNA or proteins were extracted to determine the Shp2 expression. Results were shown in Supplementary Figure 1B. We found that the level of Shp2 in M1 and M2 TAMs was similar.
Absence of Shp2 on TAMs promotes CRC cells invasion and migration
To confirm our clinical observations that Shp2 on TAMs might inhibit the CRC metastasis, we investigated the migration and invasion of CRC cells in a co-culture model. CT26 cells were co-cultured with BMDMs isolated from myeloid-restricted Shp2 deficiency (LysMCre/+Shp2flox/flox, Shp2MKO) mice and their wild type controls (Shp2flox/flox, Shp2MWT). We first determined the expressions of matrix metalloproteinase 2 (MMP2), MMP3 and MMP9 in CT26 cells after 24 hours. Results revealed that all the MMPs detected were up-regulated in CT26 cells after indirect or direct co-cultured with BMDMs from Shp2MKO mice (Figure 3A and Supplementary Figure 2A). As expected, the migration and invasion ability of CT26 cells or MC38 cells after co-cultured with Shp2MKO BMDMs were also improved (Figure 3B and 3C). Consistent with the above findings, pretreatment of BMDMs with a Shp2 inhibitor PHPS1 increased the migration capacity of MC38 cells after co-culture (Figure 3D). Taken together, our results indicate that Shp2 on TAMs negatively regulate CRC cells invasion and migration.
Figure 3.

Absence of Shp2 on TAMs promotes CRC cells invasion and migration. A. CT26 cells were in-direct co-cultured with BMDMs isolated from Shp2MWT or Shp2MKO mice for 24 hours before CT26 cells were collected for RNA or protein extraction. The mRNA or protein expressions of MMP2, MMP3 and MMP9 were determined. B. CT26 cells were co-cultured with BMDMs isolated from Shp2MWT or Shp2MKO mice for 36 hours before migration and invasion capacity of CT26 cells were determined. C. MC38 cells were co-cultured with BMDMs isolated from Shp2MWT or Shp2MKO mice for 36 hours before migration capacity was determine. D. BMDMs were pre-treated with PHPS1 at 20 μM or DMSO for 1 hour before co-cultured with MC38 cells and migration of MC38 cells was determined. Representative images of migration or invasion were taken. Results are expressed as mean ± S.E.M. *P < 0.05, **P < 0.01.
Absence of Shp2 on macrophages promotes M2-like polarization of TAMs in TME
It is well known that macrophages in tumor microenvironment can be educated to M1 or M2 polarization. However, it is unknown in CRC whether Shp2 expression on macrophages is involved in this process. Our data showed that loss of Shp2 in BMDMs significantly suppressed the expressions of the M1-associated genes encoding iNOS, IL-6 and TNF-α, whereas there was a marked elevation in the expressions of the M2-associated genes, including Arg-1, Fizz1, Ym-1 and IL-10 (Figure 4A and Supplementary Figure 2B). The secretion of TNF-α, IL-6 and IL-10 were also determined by the ELISA. In consistent with the mRNA expression, the decreased level of IL-6 and TNF-α production and elevated level of IL-10 production were also detected (Figure 4B and Supplementary Figure 2C). Collectively, our results indicate that Shp2 is required for the activation of macrophages toward M1 polarization.
Figure 4.
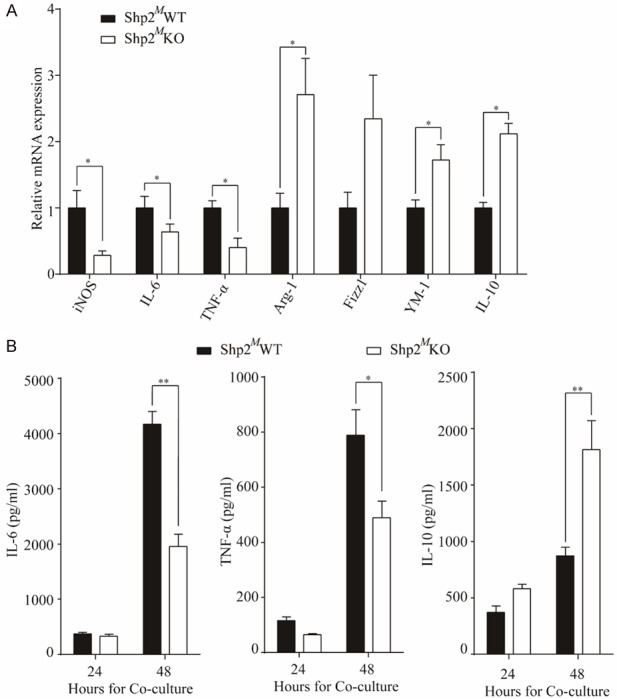
Absence of Shp2 on macrophages promotes M2-like polarization of TAMs in TME. CT26 cells were in-direct co-cultured with BMDMs isolated from Shp2MWT or Shp2MKO mice, A. 24 hours after co-culture, BMDMs were collected for RNA extraction and mRNA expressions of iNOS, IL-6, TNF-α, Arg-1, Fizz1, YM-1 and IL-10 were determined by RT-qPCR. B. Or 24 or 48 hours after co-culture, supernatants were collected for ELISA to determine the IL-6, TNF-α and IL-10 production. Results were obtained from 3 independent experiments and are expressed as the means ± SEM. *P < 0.05, **P < 0.01.
Inhibition of p-STAT3 or activation of p-NF-κB p65 reverses the Shp2-/- induced cells migration
To elucidate the molecular mechanisms responsible for Shp2 induced polarization of macrophages in TME, we analyzed the activations of relevant signaling pathways. As expected, co-culture of CRC cells and macrophages could activate the phosphorylation of MAPKs, NF-κB p65, STAT3 and STAT1 (Figure 5A and Supplementary Figure 3). However, deletion of Shp2 caused a remarkable enhanced phosphorylation of STAT3 and decreased phosphorylation of NF-κB p65. To further determine whether STAT3 or NF-κB p65 was involved in the regulating of CRC cells migration led by Shp2-/- TAMs, we used either AG490 to inhibit STAT3 activation or PMA to activate NF-κB before CRC cells were co-cultured with BMDMs. As shown in Figure 5B, either inhibition of STAT3 or activation of NF-κB could reverse the Shp2 knock-out on TAMs induced MMPs up-regulation. So as the migratory ability of CT26 cells (Figure 5C).
Figure 5.
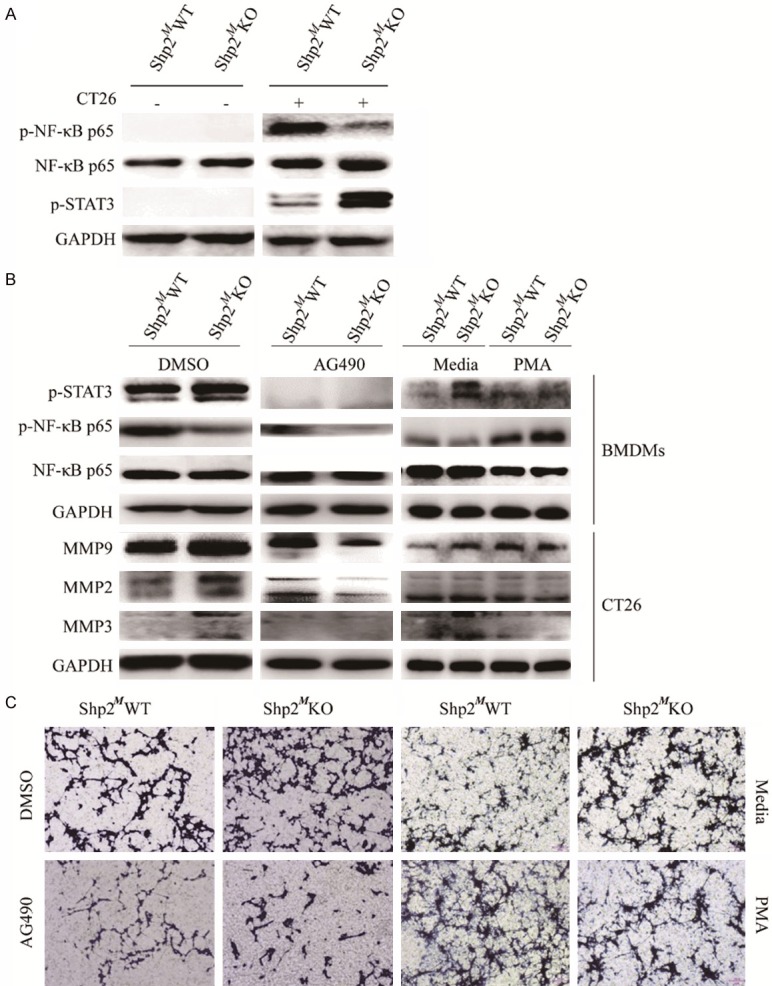
Inhibition of p-STAT3 or activation of p-NF-κB p65 reverses the Shp2-/- induced cells migration. A. CT26 cells were in-direct co-cultured with BMDMs for 24 hours before proteins were extracted from BMDMs for western blot analysis to detect the p-NF-κB p65, NF-κB p65 and p-STAT3 expressions. Shp2MWT or Shp2MKO BMDMs were either pre-treated with AG490 at 100 µM for 1 hour or PMA at 20 ng/ml for 6 hours before co-cultured with CT26 cells. B. 24 hours later, proteins were extracted, and western blotting was performed to determine the p-NF-κB p65, NF-κB p65 and p-STAT3 expressions in BMDMs and the MMP2, MMP3 and MMP9 expressions in CT26 cells. Results were representative of 3 independent experiments. C. At 36 hours later, migration capacity was determined by Transwell migration assay. Results were obtained from 3 independent experiments and representative images are presented.
Shp2 knock-out macrophages in TME promotes tumor metastasis in mice
Since Shp2 had an important role in regulating the polarization of macrophages and an inhibitory role in regulating CRC cells migration and invasion, thus we wondered whether Shp2 knock-out macrophages in TME could affect tumor progression. Since clodronate liposomes could deplete mature macrophages, we intravenously injected clodronate liposomes into the nude mice 48 hours prior to implantation of mixture of CT26 cells and macrophages in spleens. Mice were sacrificed 25 days after injection, livers and spleens were harvested and liver metastases were enumerated. The flow diagram of experiment was shown in Figure 6A. All the mice showed liver metastasis at 25 days after the injection of the mixture of cells (Figure 6B). However, the mice injected with the mixture of CT26 and Shp2MKO BMDMs showed more evident liver metastasis and had a greater metastatic burden (11.8 ± 4.5 vs 28.1 ± 5.5, P = 0.042). H&E staining also supported the results. These findings strongly indicate that Shp2 knock-out macrophages in TME could enhance the metastatic capability of CRC cells.
Figure 6.
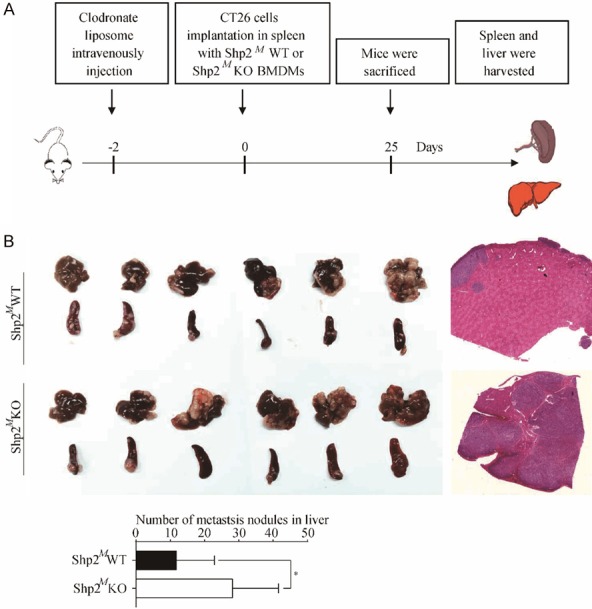
Shp2 knock-out macrophages in TME promotes tumor metastasis in mice. A. Flow diagram of establishment of spleen-liver model of metastasis of CRC cells. 200 μL of clodronate liposomes were intravenously injected into the nude mice and randomly divided into two groups. 2 days later, mixture of CT26 cells and Shp2MWT or Shp2MKO BMDMs were implanted into spleens. 25 days later, mice were sacrificed, livers and spleens were harvested. B. Numbers of liver metastases were enumerated, and H&E staining was performed. Results were obtained from 2 independent experiments and are expressed as the means ± SEM. Statistical significance was determined by Student’s t-test. Representative images are presented. *P < 0.05.
Discussion
TAMs affect tumor migration, invasion, epithelial-mesenchymal transition, metastasis and is closely associated with cancer prognosis [17,18]. Till now, little is known about the mechanism by which molecules induce TAMs polarization and contributes to tumor progression. Some molecules have been reported to be associated with TAMs polarization and play the anti- or pro-tumor effects. For example, Ron receptor tyrosine kinase on TAMs promotes tumor growth by attenuating M1 phenotype and promoting expression of Arg1, through a Stat6-independent mechanism [19]. In glioblastoma multiforme (GBM), coagulation factor X (FX) promotes macrophages toward M2 subtype polarization, thus accelerating GBM growth [20]. Our group also reported that α7 nicotinic acetylcholine receptor (α7nAChR) in TAMs inhibits colorectal cancer metastasis through JAK2/STAT3 signaling pathway. In the present study we elucidated the role of tyrosine phosphatase Shp2 in regulating TAMs polarization into the M1 phenotype thus play the anti-tumor role in CRC. The absence of Shp2 in TAMs resulted in enhanced activation of STAT3 and decreased the activation of NF-κB signaling.
Shp2 is ubiquitously expressed in cancer cells and immune cells such as T cells, macrophages and has been implicated to promote or inhibit tumor progression [21,22]. Some studies revealed Shp2 in immune cells has the pro-tumor role which was related to inflammation. For example, Shp2 deficiency in CD4+T cells inhibits the development of azoxymethane-DSS-induced colitis-associated colorectal cancer [23]. Recently, Xiao et al. also found that expression of Shp2 was increased in colonic macrophages and blood monocytes from IBD patients and Shp2 deficiency in macrophages protects mice from colitis and colitis-driven colon cancer [24]. However, Shp2 in CD4+T cells also could down-regulate the inflammation thus inhibiting tumor progression. Zhao et al. found that in melanoma, the levels of Shp2 in the CD4+T cells was down-regulated as tumor development and CD4+T cell-specific deletion of Shp2 promotes melanoma metastasis resulted from the increased release of inflammatory cytokines and the enhanced accumulation of tumor-promoting myeloid-derived suppressor cells in tumor-bearing mice [25]. Later Guo et al. proved that ablation or inhibition of Shp2 in macrophages causes intensified NLRP3 activation that lead to overproduction of proinflammatory cytokines [26]. In our study, we found that Shp2 expression on TAMs is negatively associated with CRC liver metastasis and high Shp2 is related to the favorable prognostic in CRC. We also found deletion of Shp2 in macrophages drove M2 activation after co-cultured with CRC cells, which promotes cells migration and invasion. Skewing macrophages activation toward M1 polarization was consistent with Tao’s results on BLM-induced pulmonary fibrosis [27].
Re-educating TAMs in TME has been considered to be a promising strategy to induce the effective switching of the tumor-promoting microenvironment to the tumor-inhibiting microenvironment. We have shown that CRC cells can up-regulate Shp2 expression on TAMs through direct interaction and paracrine effect (Figure 2B), suggesting that this might one of the mechanisms used by immune cells to maintain the tissue homeostasis and immune surveillance against tumors. Further analyses of how Shp2 expression was up-regulated are currently underway in order to obtain a better understanding of the pivotal roles of TAMs in CRC. Since high Shp2 expression is associated with the favorable prognostic in CRC, we speculated that some tumor cells may escape the immune surveillance through Shp2 expression anergy, thus skew the TAMs toward M2 polarization which lose its anti-tumor effects.
In conclusion, our present study reveals that Shp2 on TAMs is negatively associated with liver metastasis and high Shp2 is related to the favorable prognostic in CRC. Since Shp2 on TAMs promotes a functional shift towards M1 polarization which benefits its anti-tumor effects against CRC, the development of personalized therapeutic targets with the TAMs-based or Shp2-based treatment strategies are feasible.
Acknowledgements
This work was supported by the grant from the Key Project of Natural Science Foundation of Zhejiang Province (LZ16H160003 to WC).
Disclosure of conflict of interest
None.
Supporting Information
References
- 1.Hanahan D, Coussens LM. Accessories to the crime: functions of cells recruited to the tumor microenvironment. Cancer Cell. 2012;21:309–322. doi: 10.1016/j.ccr.2012.02.022. [DOI] [PubMed] [Google Scholar]
- 2.Ghesquiere B, Wong BW, Kuchnio A, Carmeliet P. Metabolism of stromal and immune cells in health and disease. Nature. 2014;511:167–176. doi: 10.1038/nature13312. [DOI] [PubMed] [Google Scholar]
- 3.Bussard KM, Mutkus L, Stumpf K, Gomez-Manzano C, Marini FC. Tumor-associated stromal cells as key contributors to the tumor microenvironment. Breast Cancer Res. 2016;18:84. doi: 10.1186/s13058-016-0740-2. [DOI] [PMC free article] [PubMed] [Google Scholar]
- 4.Cassetta L, Pollard JW. Targeting macrophages: therapeutic approaches in cancer. Nat Rev Drug Discov. 2018;17:887–904. doi: 10.1038/nrd.2018.169. [DOI] [PubMed] [Google Scholar]
- 5.Lawrence T, Natoli G. Transcriptional regulation of macrophage polarization: enabling diversity with identity. Nat Rev Immunol. 2011;11:750–761. doi: 10.1038/nri3088. [DOI] [PubMed] [Google Scholar]
- 6.Zhao L, Xia J, Li T, Zhou H, Ouyang W, Hong Z, Ke Y, Qian J, Xu F. Shp2 Deficiency impairs the inflammatory response against haemophilus influenzae by regulating macrophage polarization. J Infect Dis. 2016;214:625–633. doi: 10.1093/infdis/jiw205. [DOI] [PubMed] [Google Scholar]
- 7.Mantovani A, Sica A, Locati M. New vistas on macrophage differentiation and activation. Eur J Immunol. 2007;37:14–16. doi: 10.1002/eji.200636910. [DOI] [PubMed] [Google Scholar]
- 8.El-Shami K, Oeffinger KC, Erb NL, Willis A, Bretsch JK, Pratt-Chapman ML, Cannady RS, Wong SL, Rose J, Barbour AL, Stein KD, Sharpe KB, Brooks DD, Cowens-Alvarado RL. American cancer society colorectal cancer survivorship care guidelines. CA Cancer J Clin. 2015;65:428–455. doi: 10.3322/caac.21286. [DOI] [PMC free article] [PubMed] [Google Scholar]
- 9.Erreni M, Mantovani A, Allavena P. Tumor-associated Macrophages (TAM) and inflammation in colorectal cancer. Cancer Microenviron. 2011;4:141–154. doi: 10.1007/s12307-010-0052-5. [DOI] [PMC free article] [PubMed] [Google Scholar]
- 10.Jedinak A, Dudhgaonkar S, Sliva D. Activated macrophages induce metastatic behavior of colon cancer cells. Immunobiology. 2010;215:242–249. doi: 10.1016/j.imbio.2009.03.004. [DOI] [PubMed] [Google Scholar]
- 11.Kaler P, Godasi BN, Augenlicht L, Klampfer L. The NF-kappaB/AKT-dependent Induction of Wnt Signaling in Colon Cancer Cells by Macrophages and IL-1beta. Cancer Microenviron. 2009;2:69–80. doi: 10.1007/s12307-009-0030-y. [DOI] [PMC free article] [PubMed] [Google Scholar]
- 12.Forssell J, Oberg A, Henriksson ML, Stenling R, Jung A, Palmqvist R. High macrophage infiltration along the tumor front correlates with improved survival in colon cancer. Clin Cancer Res. 2007;13:1472–1479. doi: 10.1158/1078-0432.CCR-06-2073. [DOI] [PubMed] [Google Scholar]
- 13.Sugita J, Ohtani H, Mizoi T, Saito K, Shiiba K, Sasaki I, Matsuno S, Yagita H, Miyazawa M, Nagura H. Close association between Fas ligand (FasL; CD95L)-positive tumor-associated macrophages and apoptotic cancer cells along invasive margin of colorectal carcinoma: a proposal on tumor-host interactions. Jpn J Cancer Res. 2002;93:320–328. doi: 10.1111/j.1349-7006.2002.tb02175.x. [DOI] [PMC free article] [PubMed] [Google Scholar]
- 14.Funada Y, Noguchi T, Kikuchi R, Takeno S, Uchida Y, Gabbert HE. Prognostic significance of CD8+ T cell and macrophage peritumoral infiltration in colorectal cancer. Oncol Rep. 2003;10:309–313. [PubMed] [Google Scholar]
- 15.Huang Y, Wang J, Cao F, Jiang H, Li A, Li J, Qiu L, Shen H, Chang W, Zhou C, Pan Y, Lu Y. SHP2 associates with nuclear localization of STAT3: significance in progression and prognosis of colorectal cancer. Sci Rep. 2017;7:17597. doi: 10.1038/s41598-017-17604-7. [DOI] [PMC free article] [PubMed] [Google Scholar]
- 16.Cai P, Guo W, Yuan H, Li Q, Wang W, Sun Y, Li X, Gu Y. Expression and clinical significance of tyrosine phosphatase SHP-2 in colon cancer. Biomed Pharmacother. 2014;68:285–290. doi: 10.1016/j.biopha.2013.10.012. [DOI] [PubMed] [Google Scholar]
- 17.Zhang D, Qiu X, Li J, Zheng S, Li L, Zhao H. TGF-beta secreted by tumor-associated macrophages promotes proliferation and invasion of colorectal cancer via miR-34a-VEGF axis. Cell Cycle. 2018;17:2766–2778. doi: 10.1080/15384101.2018.1556064. [DOI] [PMC free article] [PubMed] [Google Scholar] [Retracted]
- 18.Bonde AK, Tischler V, Kumar S, Soltermann A, Schwendener RA. Intratumoral macrophages contribute to epithelial-mesenchymal transition in solid tumors. BMC Cancer. 2012;12:35. doi: 10.1186/1471-2407-12-35. [DOI] [PMC free article] [PubMed] [Google Scholar]
- 19.Sharda DR, Yu S, Ray M, Squadrito ML, De Palma M, Wynn TA, Morris SM Jr, Hankey PA. Regulation of macrophage arginase expression and tumor growth by the Ron receptor tyrosine kinase. J Immunol. 2011;187:2181–2192. doi: 10.4049/jimmunol.1003460. [DOI] [PMC free article] [PubMed] [Google Scholar]
- 20.Zhang Y, Feng J, Fu H, Liu C, Yu Z, Sun Y, She X, Li P, Zhao C, Liu Y, Liu T, Liu Q, Liu Q, Li G, Wu M. Coagulation factor X regulated by CASC2c recruited macrophages and induced M2 polarization in glioblastoma multiforme. Front Immunol. 2018;9:1557. doi: 10.3389/fimmu.2018.01557. [DOI] [PMC free article] [PubMed] [Google Scholar]
- 21.Ruvolo PP. Role of protein phosphatases in the cancer microenvironment. Biochim Biophys Acta Mol Cell Res. 2019;1866:144–152. doi: 10.1016/j.bbamcr.2018.07.006. [DOI] [PubMed] [Google Scholar]
- 22.Dempke WCM, Uciechowski P, Fenchel K, Chevassut T. Targeting SHP-1, 2 and SHIP pathways: a novel strategy for cancer treatment? Oncology. 2018;95:257–269. doi: 10.1159/000490106. [DOI] [PubMed] [Google Scholar]
- 23.Liu W, Guo W, Shen L, Chen Z, Luo Q, Luo X, Feng G, Shu Y, Gu Y, Xu Q, Sun Y. T lymphocyte SHP2-deficiency triggers anti-tumor immunity to inhibit colitis-associated cancer in mice. Oncotarget. 2017;8:7586–7597. doi: 10.18632/oncotarget.13812. [DOI] [PMC free article] [PubMed] [Google Scholar]
- 24.Xiao P, Zhang H, Zhang Y, Zheng M, Liu R, Zhao Y, Zhang X, Cheng H, Cao Q, Ke Y. Phosphatase Shp2 exacerbates intestinal inflammation by disrupting macrophage responsiveness to interleukin-10. J Exp Med. 2019;216:337–349. doi: 10.1084/jem.20181198. [DOI] [PMC free article] [PubMed] [Google Scholar]
- 25.Zhang T, Guo W, Yang Y, Liu W, Guo L, Gu Y, Shu Y, Wang L, Wu X, Hua Z, Ke Y, Sun Y, Shen Y, Xu Q. Loss of SHP-2 activity in CD4+ T cells promotes melanoma progression and metastasis. Sci Rep. 2013;3:2845. doi: 10.1038/srep02845. [DOI] [PMC free article] [PubMed] [Google Scholar]
- 26.Guo W, Liu W, Chen Z, Gu Y, Peng S, Shen L, Shen Y, Wang X, Feng GS, Sun Y, Xu Q. Tyrosine phosphatase SHP2 negatively regulates NLRP3 inflammasome activation via ANT1-dependent mitochondrial homeostasis. Nat Commun. 2017;8:2168. doi: 10.1038/s41467-017-02351-0. [DOI] [PMC free article] [PubMed] [Google Scholar]
- 27.Tao B, Jin W, Xu J, Liang Z, Yao J, Zhang Y, Wang K, Cheng H, Zhang X, Ke Y. Myeloid-specific disruption of tyrosine phosphatase Shp2 promotes alternative activation of macrophages and predisposes mice to pulmonary fibrosis. J Immunol. 2014;193:2801–2811. doi: 10.4049/jimmunol.1303463. [DOI] [PubMed] [Google Scholar]
Associated Data
This section collects any data citations, data availability statements, or supplementary materials included in this article.