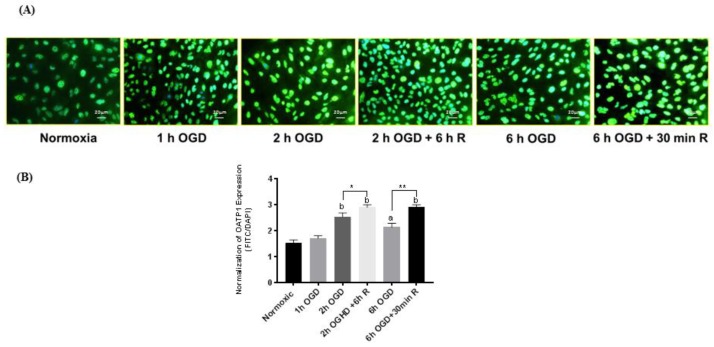
Figure 4.
(A) Immunofluorescence images of iPSC-BMECs after staining with OATP1 antibody at different OGD)-reperfusion time points. (B) Quantitative measurement of the changes in OATP1 expression after normalizing mean fluorescence intensity of OATP1 with that of 4,6-diamidino-2-phenylindole (DAPI). The expression of OATP1 in iPSC-BMECs increased after 2 and 6 h OGD exposure which further increased during reperfusion. Data represented as Mean ± SD (n = 4). * p < 0.05, ** p < 0.01. a < 0.001, b < 0.0001 vs normoxic.

