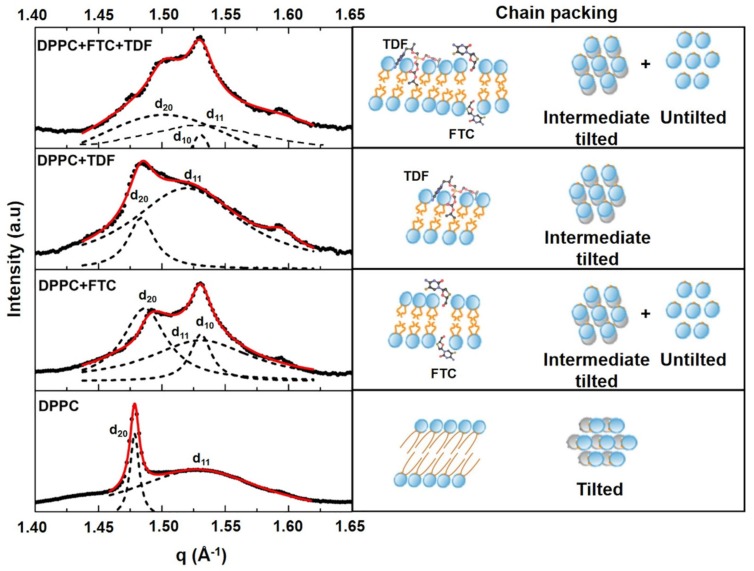
Figure 3.
Wide angle X-ray diffraction (WAXS) patterns of DPPC or DPPC containing TDF, FTC, or TDF and FTC (3:2 w/w) measured in the Lβ′ phase of DPPC. Solid red lines give the best fit of the Lorentzian’s analysis model (dashed lines) to the scattered intensities. A model of drug–membrane interaction is proposed for each diffractogram together with the resultant chain packing.

