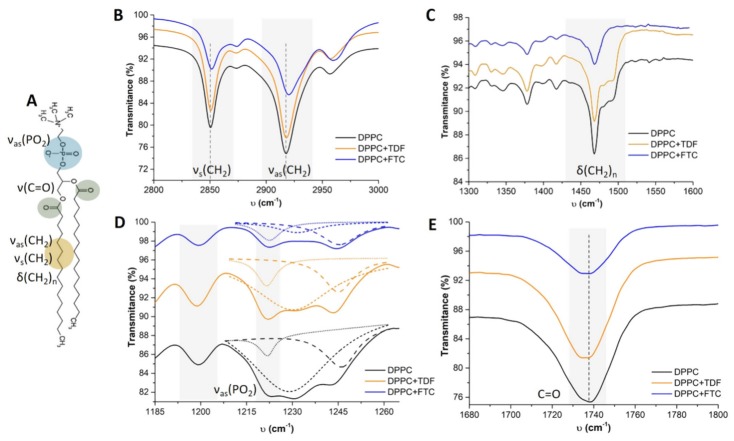
Figure 4.
(A) DPPC phospholipid showing the chemical groups responsible for the main infrared vibration modes; (B–E) show attenuated total reflection–Fourier transform infrared (ATR–FTIR) spectra obtained for DPPC membranes in the absence (black) or in the presence of TDF (yellow) or FTC (blue) for different vibration modes: υ(CH2) stretching modes (B); δ(CH2)n scissoring vibration mode (C); υas(PO2) stretching mode (D); and υ(C=O) stretching mode (E). In panel (D), dashed lines represent the deconvolution of the bands performed to determine with precision the area of the band located at 1221 cm−1 required to subsequent calculation of the ratio a1221/a1201.

