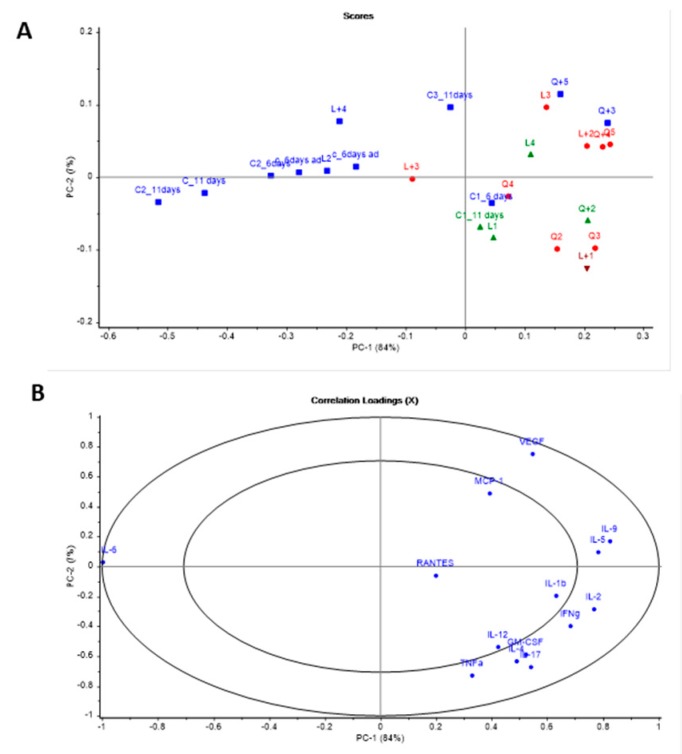
Figure 5.
Principal component analysis of the cytokine profile at day six and 11 for control group and at day 11 post-infection for all treatment groups. (A) Score plot. (B) Correlation loading plot. Key: C represents animals from the untreated control group; L- animals treated with LAMB and Q- animals treated with AMB-MET.

