Figure 8.

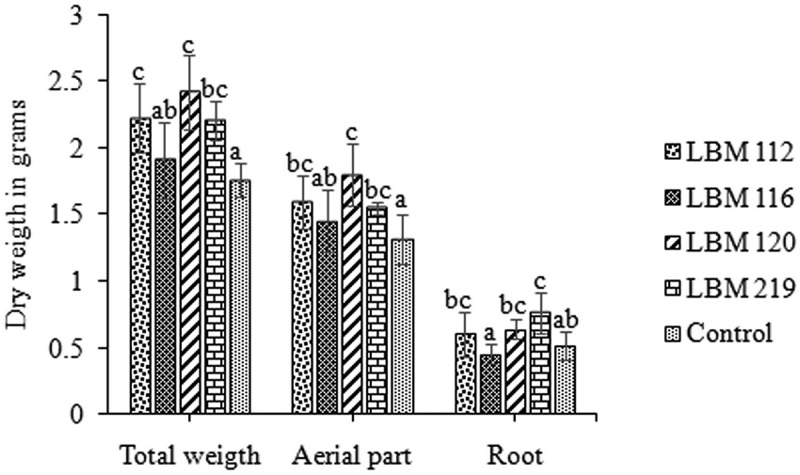
In vivo assay results. Representation of total, aerial part and root dry weight in grams. Standard error is represented with bars. The letter above the bars indicates homogenous group formation.

In vivo assay results. Representation of total, aerial part and root dry weight in grams. Standard error is represented with bars. The letter above the bars indicates homogenous group formation.